Executive Summary
Conducting market research constitutes an important aspect that existing and potential investors should undertake in determining the likelihood of generating the desired return from their current and potential investments in different stocks. The financial analysis report is one of the core sources that investors can obtain such information. Moreover, the financial analysis report is a source of insight that other stakeholders such as credit financiers can use in assessing a firm’s performance. This report details a financial analysis report regarding the Abu Dhabi Islamic Bank. The report illustrates detailed results on the company’s performance using financial statements such as the income statement and balance sheet. The analysis assesses the company’s efficiency in utilizing its assets to generate profits, operational efficiency, and the level of profitability. This report is based on ratio, vertical, and horizontal analysis. Based on these methodologies, the report details a variance analysis, which illustrates the change in the bank’s performance during the period under consideration.
Introduction
The global banking industry has become very volatile due to the effects arising from diverse macroeconomic forces. The impact of the macro-environment forces on financial institutions is not limited to specific countries or regions. On the contrary, it is a global phenomenon due to the high rate of globalization and financial contagion (Claessens & Forbes, 2006). In addition, global financial crises usually have a domino effect, and thus they affect the entire banking industry across the world. Therefore, the industry players are adjusting their corporate and business level strategies gradually to enhance their competitive edge and take advantage of the scarce resources. One of the motives of the strategic adjustments is attaining stability.
It is imperative for financial institutions such as the Abu Dhabi Islamic Bank [ADIB] to consider developing a long-term financial capital base at a low cost. ADIB commenced operations in 1998 with a total paid-up capital of 1 billion Dirhams, which was sourced by issuing shares. This aspect shows that the bank appreciates the importance of sourcing capital from the external market. Claessens and Forbes (2006) corroborate that attracting investors by selling stocks is one of the strategies for financial institutions to consider in their pursuit to strengthen their financial capital base. A report released by Deloitte (2014) identifies funding and liquidity as some of the major challenges affecting the UAE banking industry. To improve its effectiveness in sourcing funds externally, ADIB should disclose and communicate its financial performance to potential investors. This goal can be achieved by undertaking financial analysis reporting.
This paper entails a financial analysis report on ADIB. The bank provides diverse Islamic financial solutions to customers around the world. The objective of the financial analysis report is to provide information on the bank’s financial performance to different stakeholders such as an organization’s management team, owners, potential investors, and credit financiers. Subsequently, the financial analysis report will be a source of insight to the stakeholders on the company’s strengths and weaknesses. The financial analysis report entails an extensive evaluation of the company’s financial performance between 2011 and 2014. Therefore, investors can use the financial analysis report as a source of market intelligence.
Resources
The financial analysis report entails a detailed examination of different financial performance aspects. This goal is achieved by examining the firm’s profitability and financial position. The analysis is achieved by evaluating different financial statements such as the income statement and balance sheets. The report adopts the percentage analysis approach, which entails a comparison of a firm’s financial performance regarding operating results across different periods. The percentage analysis approach is implemented by taking into account the concepts of horizontal, vertical, and ratio analysis. Nikolai, Bazley, and Jones (2010) emphasize that horizontal analysis illustrates a company’s performance regarding the financial position and operating results over time. Conversely, vertical analysis “shows the monetary relationships between items on its financial statements for a particular period in percentages as well as in dollars” (Nikolai et al., 2010, p. 276). The financial analysis report further comprises a ratio analysis that evaluates different financial aspects at ADIB such as financial flexibility, operating capability, risk, return, and liquidity.
Method of Collecting Data
The data used in conducting the financial analysis report is collected by using a literature survey methodology, which entails a critical informational analysis to interpret the available information. The financial analysis report utilizes the ADIB’s annual report as the core resource. The years considered in collecting data range from 2012 to 2014. The company’s annual report comprises financial statements such as income statements, balance sheets, and cash flow statements. The data contained in the annual report is presented using a descriptive approach. Subsequently, it is comprised of the quantitative and qualitative methods of reporting, which enables the data to be presented in monetary terms and percentages. The annual reports have adopted the vertical and horizontal approaches as the core accounting analysis methods. The reporting method further incorporates a graphical presentation of the firm’s performance.
Significant Financial Events
The ADIB’s operations are subject to influence by significant financial events. Kieso, Weygandt, and Warfield (2012) define a significant financial event as “any occurrence that took place after the formal balance sheet date, but before the statement is issued” (p. 1521). Reporting significant financial events is fundamental because it provides investors with an opportunity to make informed investment decisions. Some significant events do not require the financial statements to be adjusted. These events are referred to as the non-recognized subsequent events. Examples of such events include the issue of stocks, change in market share price, and loss of inventory amongst others. One of the significant events that occurred during the period under consideration entails the sale of the bond. In 2013, ADIB sold bonds worth US$ 1 billion of its Tier-1 Sukuk. The issuance of the bond was expected to supplement the firm’s capital base, hence improving its ratings, which had dropped according to Moody’s rating.
Detailed Results
Despite the turbulent economic environment experienced in the UAE’s banking industry, ADIB has managed to depict positive financial performance. The company’s annual report shows growth regarding different financial aspects. Some of the areas that investors should consider in assessing the firm’s performance entail its balance sheet and the income statement. Another aspect that the investors should examine entails the company’s performance regarding the level of profitability. ADIB has experienced considerable growth over the past few years regarding the level of revenue. Table 1 below illustrates the changes in the bank’s revenue between 2011 and 2014.
Table 1: ADIB sales revenue
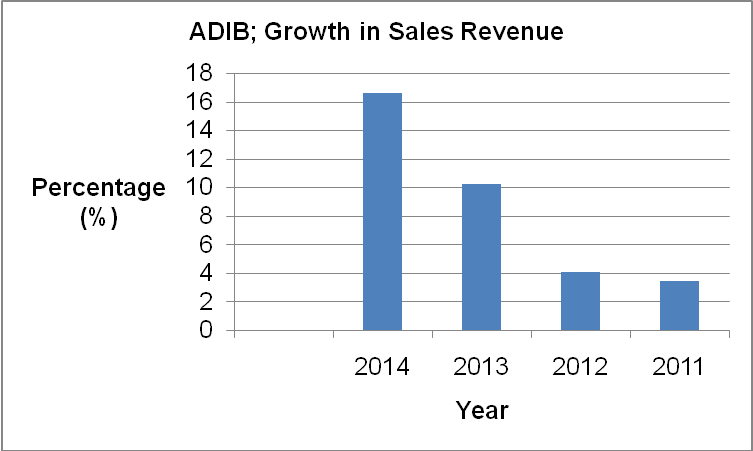
The table 1 and graph 1 show a significant growth in the firm’s sales revenue. Between 2011 and 2014, the firm’s sales revenue grew by a 12.5% margin. This aspect indicates that ADIB is very effective in utilizing its resources in generating sales revenue. Furthermore, ADIB has experienced a substantial increment in the volume of its operating profit over the years under consideration as illustrated in the graph below.
Table 2: ADIB operating profits
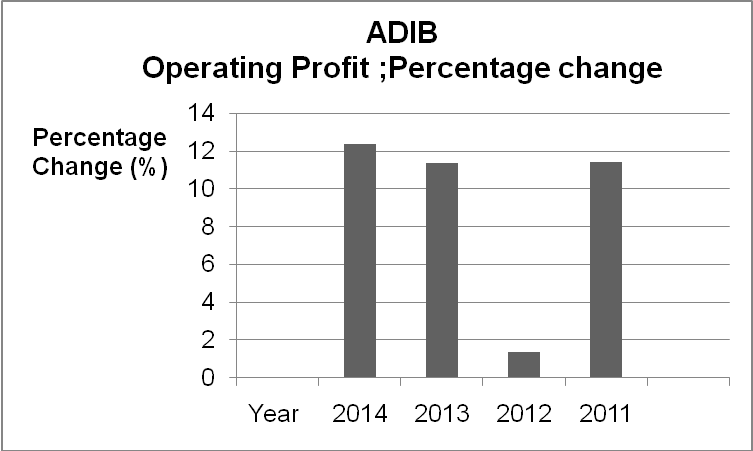
The bank’s profitability is further illustrated by the trend in its net profit margin, which is determining by dividing the net income by the net sales. In 2014, the ADIB’s operating profit increased by 12.42% as opposed to the previous level of 11.38% in 2013. This aspect indicates that the bank is characterized by a relatively strong future financial viability. Strong operating profits allow financial institutions to undertake full prudential provisioning. Furthermore, the high operating income at ADIB indicates that the bank is very efficient in generating profits. Thus, the likelihood of generating returns by investing in the banks’ stocks is considerably high.
Different ratios may be used in assessing the banks’ financial performance. Some of the ratios include return on assets and return on equity. The return on equity [ROE] is calculated by dividing a firm’s total net income by the net income. Alternatively, the return on asset (ROA) is determined by dividing a firm’s net income by its total assets. During the years under consideration in this report, ADIB has been characterized by a strong profitability performance as illustrated by its rates of ROA and ROE.
Table 3: ADIB rate of return on equity
The profitability performance indicates that ADIB is effective in formulating and implementing banking policies in addition to engaging in activities that foster the firm’s profitability. The year-on-year rate of ROE shows that the bank has maintained a positive performance regarding profitability. The trend in the bank’s ROE is close to the ideal industry average rate of 15% on ROE. This aspect indicates the ADIB’s management effectiveness in utilizing the investors’ money in generating profits. Despite the decline in the ROE experienced between 2011 and 2012, the ROE shows that it is possible for investors to derive dividends by investing in the bank’s stocks due to its efficiency in utilizing the investors’ money in activities that lead to profit generation.
In addition to the above issues, the ADIB’s positive performance is also illustrated by the rate of return on assets. The table below illustrates the trend in the firm’s performance regarding ROA.
Table 4: ADIB rate of return on assets
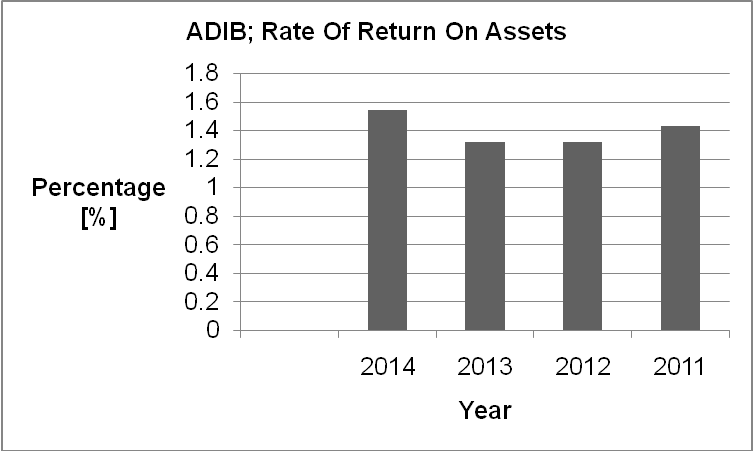
According to table 4 and graph 4, ADIB has been in a position to maintain its rate of ROA close to the 1.5% level, which is considered as ideal for banking institutions. The trend in the bank’s performance regarding the ROA indicates the ADIB’s profitability potential.
The ADIB’s financial position is also illustrated by the performance of the different components of its balance sheet. A horizontal analysis on the firm’s balance sheet indicates considerable growth as depicted in Table 3 below.
Table 5: ADIB’s balance sheet performance
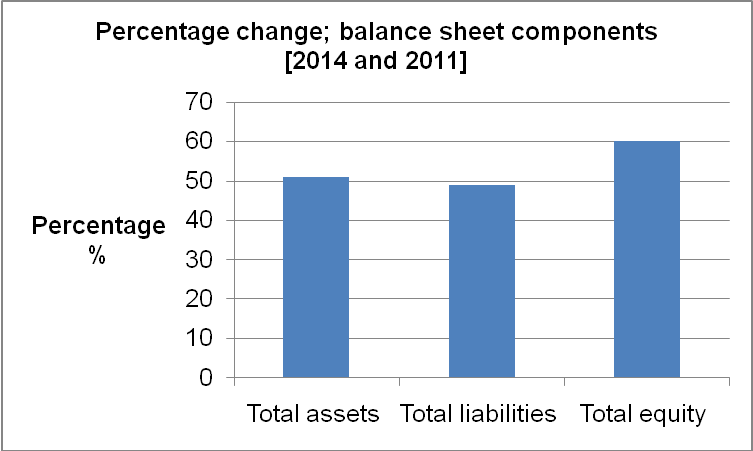
Table 5 and Graph 5 show that ADIB has managed to strengthen its financial position as illustrated by the change in total assets, total liabilities, and total equity. From table3, it is evident that ADIB has succeeded in establishing a balance between the various components of the balance sheet. By maintaining equilibrium in its balance sheet, ADIB has been in a position to sustain its financial stability over the years. For example, due to growth in its total equity, ADIB is in a position to invest in market expansion, hence improving its ability to generate revenue.
The ADIB’S strong performance is also depicted by its long-term solvency ratio. One of the measures that investors should consider in assessing an institution’s level of solvency entails the debt to equity ratio, which is calculated by dividing total debts by total equity. Alternatively, the level of solvency can be determined by calculating the total liabilities to total assets ratio.
Table 6: Total liabilities to total assets
Table 6 above indicates that the total liabilities to total assets ratio is relatively high. For example, the 1:0.88 total liabilities to assets ratio in 2014 show that 88% of the bank’s capital is comprised of debt finance. Thus, one can argue that the bank is highly leveraged. The ratio over the years is relatively similar as illustrated in Table 6, which means that the bank mainly finances its activities using debt finance. Consequently, one can argue that the bank is characterized by a relatively high financial risk. However, one of the factors that might explain the high total liabilities to total assets ratio relates to the bank’s rapid expansion. In the recent past, ADIB has engaged in an expensive market expansion. Some of the markets that the bank has entered include countries in South East Asia, the Middle East, and North Africa regions. Popil and Puri (2013) affirm this phenomenon by asserting that rapidly “expanding companies often have high liabilities to assets ratio” (p. 87).
Capital adequacy constitutes an important component in banks’ operations because it illustrates the ability to sustain operations despite the occurrence of negative business cycles. The capital adequacy ratio involves a comparison of a financial institution’s capital to its risk. The determination of the capital adequacy ratio [CAR] further indicates the effectiveness with which a bank can absorb internal shocks. By assessing the CAR, a bank can be in a position to estimate its capital requirements. A high capital adequacy ratio indicates a bank’s capacity to achieve operational efficiency, which is critical in lowering operating costs. Consequently, it is possible for a financial institution to mobilize capital at a realistic cost.
Table 7: ADIB’s capital adequacy ratio

In the course of its operation, ADIB has entrenched the regulations stipulated under the Basel II Accord on capital adequacy management in the banking industry. This aspect is evidenced by its compliance with the stipulation set by the UAE Central Bank, which is the custodian of the Basel II Accord. In 2014, the UAE Central Bank set the minimum rate of capital adequacy ratio at 12%. From the graph above, ADIB has succeeded in maintaining the CAR well above the minimum benchmark. Moreover, the adherence to the minimum CAR established by the UAE Central Bank is an indicator of the effectiveness with which the bank undertakes its supervisory review process.
An analysis of the bank’s balance sheet further illustrates its effectiveness in managing assets and liabilities. This assertion is depicted by the bank’s ability to maintain the loan-to-deposit ratio at an acceptable level. The graph below shows the trend regarding ADIB’s loan-to-deposit ratio.
Table 8: Loan to deposit ratio

Graph 8 depicts a substantial increment in the bank’s performance regarding loan and deposit management. Popil and Puri (2013) assert that a high loan-to-deposit ratio denotes that a bank is very effective in undertaking customer financing using the customers’ deposits. Moreover, the high loan-to-deposit ratio shows that the bank is very effective in generating additional income by advancing interest-bearing loans. Despite the effectiveness of issuing loans in enhancing a bank’s ability to generate profits, Popil and Puri (2013) argue that it is imperative for the bank’s management team to ensure that only quality loans are issued.
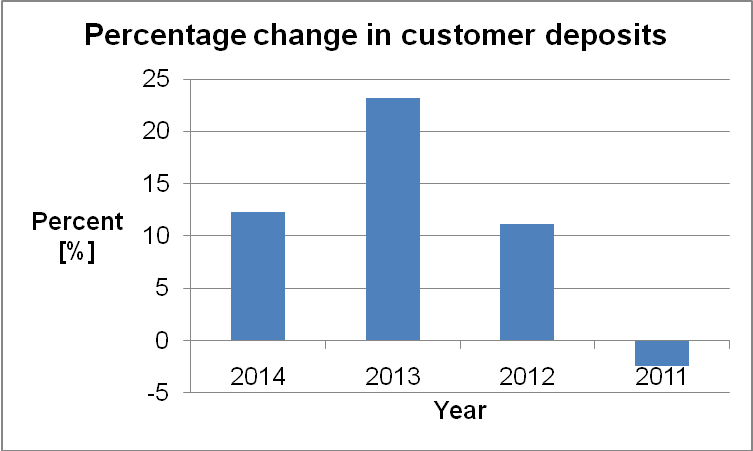
ADIB has integrated the concepts of retail and corporate banking. However, to succeed in these functions, ADIB has appreciated the importance of deposit mobilization. Deposits are a critical component in banks’ operational efficiency. ADIB has succeeded in deposit mobilization over the past years as illustrated by the growth in the level of deposits. The growth in deposits level indicates the bank’s capacity to generate profit through customer financing.
Table 9: ADIB customer deposits
In making investment decisions in the banking industry, it is imperative for investors to take into consideration the bank’s efficiency ratio, which is a critical benchmark for assessing the capacity to generate earnings. The efficiency ratio is determined by dividing the total operating expenses by the total operating income. Table 10 below illustrates ADIB bank’s efficiency ratio.
Table 10
From Table 10, ADIB bank has succeeded in maintaining a considerably high-efficiency ratio, which is an indicator of its earnings generation capacity.
Analysis of variance
Analysis of variance aids in assessing the changes in an organization’s financial performance over years. The ADIB’s financial performance is further indicated by the variance of the different components in the financial statement. The analysis of variance in the ADIB’s financial statements takes into consideration its 2013 and 2014 financial years. The two major components considered include the balance sheet and the income statement as shown in Appendix 2.
The table in Appendix 2 illustrates a positive change in ADIB’s performance regarding its profit. The positive variance further indicates the bank’s efficiency in generating a profit by managing its source of income and operating expenses. From Table 12, below, it is evident that ADIB has successfully improved its financial position as illustrated by the positive variance in the balance sheet component.
Table 12
Conclusion and projection on future performance
The financial analysis report indicates a positive trend in the ADIB’s performance. Despite the turbulent nature of the global banking industry, the bank’s management team has been in a position to sustain growth in the firm’s financial performance. The financial analysis report shows a positive trend regarding the bank’s profitability. A horizontal and ratio analysis of the bank’s income statements illustrates a significant increment in the level of profitability during the years under consideration. The report further shows the bank’s efficiency in utilizing the investor’s monies and assets. These aspects are indicated by the ability of the bank to maintain the rates of return on equity, return on assets, and the efficiency ratio at a level close to the industry benchmark. Moreover, the bank has sustained its capital adequacy ratio at a relatively high level, which indicates the bank’s operational efficiency hence its effectiveness in lowering operating costs.
To maximize profitability, ADIB has undertaken extensive market expansion over the past decade by entering new markets in the Gulf region. Subsequently, the firm has been in a position to maximize its sales revenue in addition to building a strong financial base by mobilizing deposits. The bank’s success in entering the new markets has been fostered by the development of Islamic bank products, hence meeting the customers’ needs. However, the bank’s rapid expansion program has led to the incurrence of a substantial increment in liabilities in addition to dependence on external sources of funds. Furthermore, an analysis of variance in the bank’s financial statements indicates the bank’s effectiveness in maintaining a positive change in its performance.
Based on the contents of the financial analysis report, one can argue that the Abu Dhabi Islamic Bank is likely to sustain its positive financial performance. The positive performance will arise from the management team’s efficiency, as indicated by its performance regarding profitability, the utilization of the company’s assets, and the investors’ funds. Therefore, the financial analysis reports provide invaluable market intelligence.
Reference List
Abu Dhabi Islamic Bank: Annual report. (2014). Web.
Claessens, S., & Forbes, K. (2006). International financial contagion. Boston, MA: Springer.
Deloitte: Banking industry in the UAE. (2014). Web.
Kieso, D., Weygandt, J., & Warfield, T. (2012). Intermediate accounting. Hoboken, NJ: Wiley.
Nikolai, L., Bazley, J., & Jefferson, J. (2010). Intermediate accounting. New York, NY: Cengage Learning.
Popil, G., & Puri, S. (2013). Strategic credit management in banks. New Delhi, India: PHI Learning Private Limited.
Appendices
Appendix 1: Financial Revenues
The financial analysis report is based on the ADIB’s financial revenues during the financial years under consideration. The financial revenues relate to the firms rent, interest, and other income earned by an organization for owning or renting property or asset.
Appendix 2: Consolidated Income Statement
Appendix 3: Observations – problems faced in preparing the report
One of the problems encountered in the process of preparing the financial analysis report entails the fact that data on financial revenues was obtained from different sources. Subsequently, the process of consolidating the data from the company’s annual report regarding the years under consideration was taxing. However, applying the descriptive statistics analysis methodology improved the efficiency of analyzing the obtained financial data. This goal has been achieved by using Microsoft Excel as the core data-analysis tool. Furthermore, using Microsoft Excel has improved the preparation of the financial analysis report through tabulation, graphical illustration, and data presentation. Subsequently, the firm’s financial data has been made understandable to different stakeholders.
Appendix 4: Projection on ADIB’s future performance
The bank’s future positive performance is likely to be fostered by the efficiency in utilizing the customers’ deposits in advancing loans. The management team’s efficiency will foster the bank’s profitability despite the occurrence of negative business cycles. Thus, the bank will be in a position to promote its profitability by generating additional income. Based on its past performance, investors are likely to maximize their wealth by investing in the bank’s securities.