Introduction
Evaluation of the dividend policy of a company is significant because it provides a better understanding of the financial performance of the company. In most cases, the amount of dividend paid by a company depends on the stage of growth of the company and past, present and future earnings. This paper aims at evaluating the dividend policies of Intel Corporation. Intel Corporation is a public company that operates in the semiconductor industry. Further, the dividend policy of the Corporation will be compared to that of its competitors such as Advanced Micro Devices, Inc., Texas Instruments Inc., and Broadcom Corporation.
Data
The tables presented below give a summary of information about the companies. The data cover a period of three years.
Competitors
Discussion
Intel Corporation
The company makes quarterly dividend payment. The data presented in the table above indicates that there has been a significant improvement in the dividend per share paid during the period. The value rose from $0.78 in 2011 to $0.87 in 2012. It further rose to $0.90 in 2013. A similar trend was observed in the case of the dividend payout ratio. The value increased from 32.7% in 2011 to 47.7% in 2013. This implies that the proportion of earnings paid out as dividend rose. Further, the dividend yield fluctuated during the period. It rose from 3.64% in 2011 to 4.53% in 2012. However, it declined to 3.58% in 2013 (Yahoo Finance, 2015). The trend exhibited by the dividend yield is caused by the changes in the share prices. Over the past the company reported a decline in performance in terms of sales and net income. The sales revenue dropped from $53,999 million in 2011 to $52,708 million in 2013 while the net income declined from $12,942 million in 2011 to $9,620 million in 2013 (Morningstar, 2015). Despite the decline in the profitability and earnings, there was an increase in the dividend paid and the payout ratio. A further evaluation of performance shows that the company has not been able to regain the high performance that was recorded during the internet bubble period. Therefore, it resorted to the dividend game with an aim of enhancing the investor’s confidence. However, this strategy has not been effective because the payment of the dividend is not supported by growth in performance. Thus, the overall effect is a negative impact on the performance of the stock.
Comparison with companies
In terms of dividend payment, Intel Corporation has performed relatively better than its competitors. For instance, its main competitor, Advanced Micro Devices, Inc., has not paid dividends since its formation. This can be attributed to the fact that the company is still in the growth stages of development. Thus, the company reinvests the entire profit earned. Further, in 2013, Texas Instruments paid a higher dividend and had a higher dividend payout ratio than Intel Corporation. However, the dividend yield for the company during the three years was lower than that of Intel Corporation. Broadcom Corporation paid lower dividends and had a lower payout ratio than Intel Corporation in all the years apart from 2013 when it had a higher payout ratio. The dividend yield for the company during the three years was lower than that of Intel Corporation.
Graphical illustration
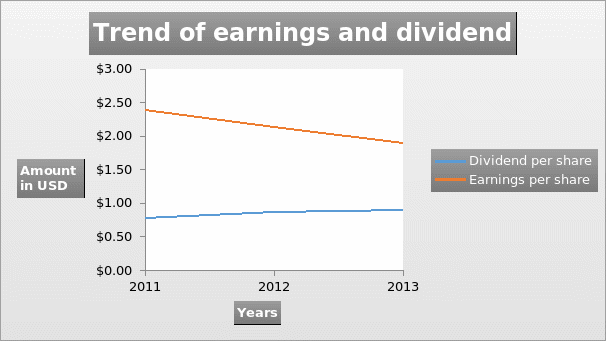
The graph presented below shows the trend of dividend per share and the earnings per share.

In the graph, it can be observed that the curve for earnings per share has a downward trend. This shows that the values dropped during the period. As mentioned above, this declined is caused by the deterioration of profits and revenue. Also, the increase in the number of shares contributed to the decline in the earnings per share. On the other hand, the curve for the dividend per share is upward sloping and it means that the values rose during the period.
Conclusion
The discussion above focused on companies the dividends paid four different companies. In the analysis, it can be observed that Intel Corporation paid a relatively higher dividend than its competitors. Further, the dividend payout ratio and the dividend yield for the company was higher that of the competitors. Despite the favorable dividend policy of the company, the financial position of the company deteriorated during the period. The dividends are meant to maintain high share prices and to raise investor confidence. The current trend of performance is expected to persist in the future. Also, there will be a dismal growth in future dividends
References
Yahoo Finance. (2015). Intel corporation (INTC). Web.
Morningstar. (2015). Intel corp (INTC). Web.