Company history
Sound of Music, Inc. was established in the state of Minnesota in 1966. It started as a retailer selling equipment related to audio components. The company expanded with the innovation of the videocassette recorder in the early 1980s (Best Buy Co., Inc 4). In 1983, the Sound of Music, Inc. changed its name to Best Buy Co., Inc.
The company expanded into operating large stores in the late 1980s. In 1989, the company offered self-service retailing. In 2000, the company started using the online marketing concept by launching its first website, known as ‘BestBuy.com.’ Its current operations are supported by several websites and call centers (United States Securities and Exchange Commission 4).
Financial analysis and the management team
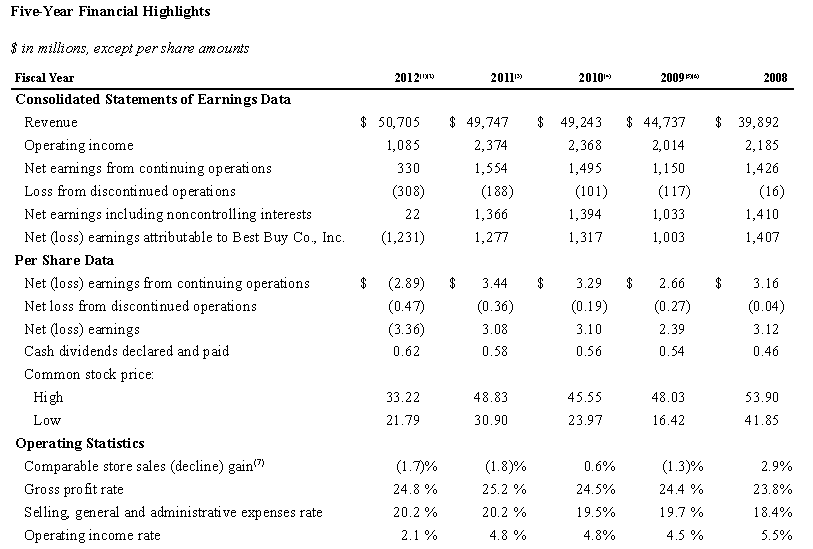
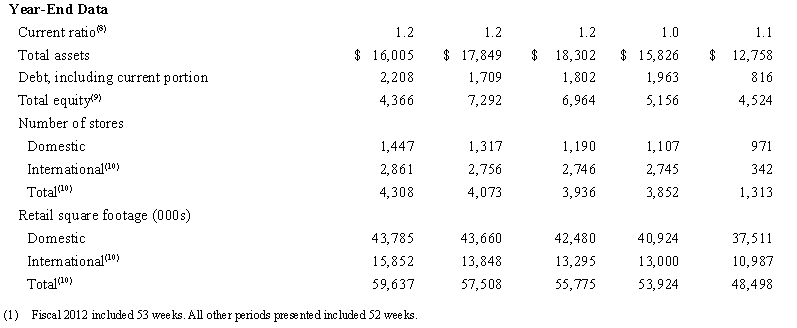
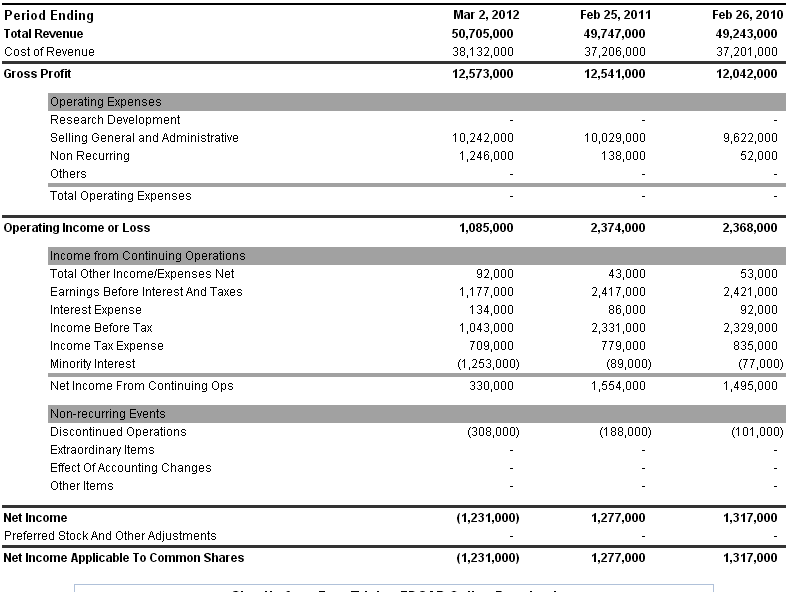
The company has maintained a current ratio of 1.2 since 2010. It is higher than in 2008 and 2009 (see appendix 1). The current ratio is calculated by dividing current assets by current liabilities. A current ratio of more than 1 shows a firm’s ability to repay its debts within a year. The higher the ratio, the higher the capability to repay debts is. Best Buy incurred net losses in the last financial year (see appendix 2).
Its management team consists of skilled employees. Best Buy’s strategy is to have low employee turnover. It aims at retaining highly skilled employees in the long-run (Best Buy Co., Inc. 14).
Market structure
The company operates under a monopolistic market structure. Different brands offer different products in a monopolistic market structure (Gitman and McDaniel 25). Best Buy has chosen to offer some products similar to their manufacturers. For example, Best Buy sells Dell and Apple products through its stores when the manufacturers also operate retail stores. Best Buy uses several brands to market products to different market segments.
The products are almost similar and substitutable. In monopolistic markets, companies use advertisement, packaging, and pricing strategies to capture a larger market share (Gitman and McDaniel 25). Best Buy and its major competitors, such as Wal-Mart, have to spend a lot of money on advertisements to increase their market share. The company uses support services to increase customer satisfaction and create customer loyalty. Best Buy is considered to operate under a monopolistic market structure because there are a few big superstore dealers and many small companies selling electronics. For smaller-sized companies, entry and exit are easy.
In monopolistic competition, the demand curve is highly elastic. It is highly elastic because Best Buy products can be substituted with other products (Gitman and McDaniel 25). There is an intensive rivalry between firms that retail electronics. The general market is also elastic because the products are not necessities.
The main advantage is that demand in a monopolistic market is less elastic than in the perfect competition. It is because of product and brand differentiation. The company wins customer loyalty through its brands and different products.
The main disadvantage of operating in a monopolistic market structure is that firms are unable to make high profits. In the long-run, they operate at the break-even point. However, large firms such as Best Buy and Wal-Mart may make normal profits depending on customer loyalty.
Maximizing profit
The long-run condition in a monopolistic market is that price exceeds marginal cost. Firms increase profitability by selling more products. Best Buy earns more by capturing a larger market share. In the company’s annual report, the company strategy includes opening more stores in its domestic and international market segments. The number of stores increased from 4,073 to 4,308 between 2011 and 2012 fiscal years (United States Securities and Exchange Commission 31). Its domestic market segment in the USA. Its international market segments include such countries as China, Canada, Turkey, and the UK.
Maximizing profits also requires the company to reduce its operating costs. These include “labor and benefit rates, advertising and marketing expenses, operating leases, and other store expenses” (United States Securities and Exchange Commission 15). Best Buy closed all its large stores in China, Turkey, and the UK by the end of the 2012 fiscal year (United States Securities and Exchange Commission 5). It can be seen as a strategy to reduce operating costs. Its gross profit rate is constant at about 24% within the five years (see appendix 1).
Competitors
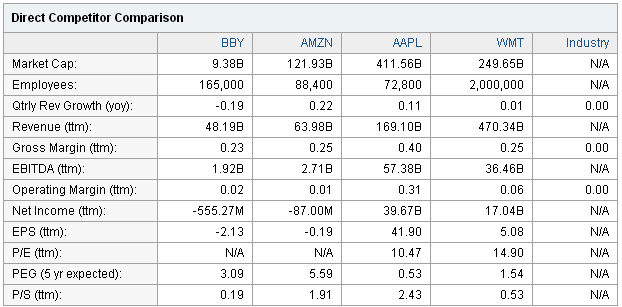
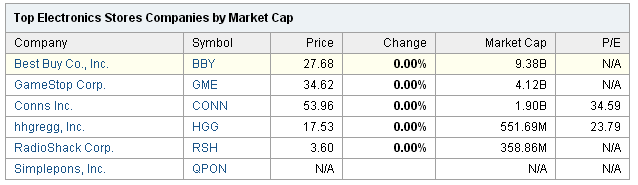
The company recognizes that some of its competitors can use competitive pricing because they operate low-cost structures. The company also recognizes the impact of internet shopping, which lowers costs through tax exemption in some of the states in the US. (the United States Securities and Exchange Commission 11). Website retailing also offers low operational costs for vendors. Rival companies may store similar products from the same manufacturers. Companies have to lower operating costs to use competitive pricing. The main competitors include Apple, Wal-Mart, RadioShack Corp, Simplepons, among others (see appendix 3 & 4). Best Buy shows a decline in profitability compared to competitors.
Price elasticity
The company has to review prices to match the prices offered by competitors (United States Securities and Exchange Commission 11). Price elasticity of demand measures how demand responds to changes in prices. It measures the percentage change in demand as a result of a percentage change in price (Arnold 118).
Proce elasticity of demand = percentage change in quantity demanded / percentage change in price
A price elasticity coefficient of 2 would mean that when price changes by 3%, demand changes by 6%. For example, Best Buy offers ‘Webroot Secure Anywhere’ antivirus for $49.99. The product is produced by a manufacturer that supplies Best Buy as well as rivals. It has substitutes such as Norton and Kaspersky. Buying the product from Best Buy or Wal-Mart may be less significant than the price. The customer will purchase the product where the price is lower.
The calculation assumes that Best Buy lowers the price to $46.00. Wal-Mart maintains the price at $49.00 for a month before realizing Best Buy has made a price change. Best Buy sales for the product increase from $42,491.50 (850 products at $49.99) to $55,200 (1200 products at $46.00) within the same month.
The coefficient formula is adjusted for using midpoints instead of the initial point (Tucker 101). The average of the old and new points is used in the calculation.
% change in quantity = 1200 – 850 / (1200 + 850) /2 = (350 / 1025) * 100 = 34.15%
% change in price = $49.99 – $46.00 / (49.99 + 46.00) / 2 = (3.99 / 47.995) * 100 = 8.31%
Coefficient of elasticity = 34.15% / 8.31% = 4.1
The coefficient is about four, which means for a 1% change in price, consumer demand for the antivirus may change by 4%.
Price elasticity is not perfect in monopolistic competition. Customers who shop at Wal-Mart may still purchase it there when purchasing other products despite a lower price at Best Buy. Customer loyalty and differentiated products such as Kaspersky may reduce price elasticity effects. The cross-price elasticity of demand may affect products that Best Buy stores. Cross-price elasticity is when the price of a substitute affects the size of demand for another product. In monopolistic competition, stores try to keep their product prices similar or close to their competitors’ product prices.
Macroeconomic analysis
The company has shifted to closing large stores in countries that have many small vendors such as China and Turkey. Its main international market segment in Canada. Canada may be considered as leading international market segment by concentration and number of stores. At the end of 2012, the company had 149 Future Shop Stores, 77 Best Buy Stores, and 30 Best Buy Mobile stores in Canada. During the same period, it operated 204 Five Star Stores in China.
In comparison, it had more stores in Canada than China (United States Securities and Exchange Commission 9). It also closed down large stores in China. The stores in Canada are also more differentiated than in China.
Comparison of GDP, inflation rate, and unemployment rate between China and Canada
At the end of 2011, Canada had a GDP per capita of $50,344 compared to China’s $5,445 (GDP per capita: current US$). Canada had an inflation rate of 0.83% between December 2012 and December 2011 (“Inflation Canada 2012” table). The inflation rate in China in the same period was 2.41% (Inflation China 2012). Canada’s unemployment rate remained at 7.2% between March and April 2013 (Canada Unemployment Rate, par. 1). China’s unemployment rate is at 4.1% (“China – National Statistics” table).
The data show that customers in Canada have a higher purchasing power than customers in China. Canada is preferable for operating larger stores than in China. It can explain the firm’s strategy to close the big stores in China. China has a higher percentage of people who have a source of income than Canada. A low inflation rate ensures that prices do not change by a large margin within a short period.
Input-output model
An input-output model is used to describe the interrelationship between industries or sectors within an economy. In the input-output model, there is a general equilibrium which “signifies interrelationship between industries” (Jain et al. 229). The input-output model assumes the production of a single product from each industry. One industry produces an output that is used by other industries or by itself.
For this reason, the economy is divided into inter-industry sectors and the final goods sector. The final goods sector utilizes output without adding value to the products. In most cases, the value of the product diminishes as it is being consumed.
Best Buy is found in the retailing industry, and the manufacturers of electronics are found in the technological products industry. Each of these industries utilizes human resources. A manufacturer of electronics may need some of the appliances it does not produce from Best Buy. On the other hand, Best Buy buys some of the electronics that the company manufactures for retail. For example, a company producing phones may require office products such as laptops, which they do not manufacture. It purchases laptops from Best Buy for its office uses and supplies Best Buy with mobile phones.
Human resources are significant because it becomes the purchasing power that creates demand. A high GDP and low unemployment rate may increase demand in almost all sectors. When customers demand more laptops from Best Buy, Best Buy demands more products from laptop manufacturers. Laptop manufacturers and Best Buy will increase the number of employees to meet increasing demand.
A low inflation rate limits companies from using large inventories for competitive pricing. Technological products’ demand varies with trends and lifestyle, which limits large companies from benefitting fully from the economies of scale. Best Buy’s expansion strategy is to increase the number of stores while maintaining almost the same level of retail square footage (see appendix 1). It closes big stores but increases the number of small-sized stores.
Works Cited
Arnold, Roger. Microeconomics, Mason: South-Western Cengage Learning, 2010. Print.
Best Buy Co., Inc. BBY 2013. Web.
Best Buy Co., Inc. BBY 2013. Web.
Best Buy Co., Inc. BBY 2013. Web.
Best Buy Co., Inc. Connected World: Fiscal 2008 Annual Report, Minnesota: Best Buy Co. Inc., 2008. Print.
China – National Statistics. n.d. Web.
GDP per capita: current US$. n.d. Web.
Gitman, Lawrence and Carl McDaniel. The Future of Business: the Essentials, Mason: South-Western Cengage Learning, 2009. Print.
Inflation Canada 2012. n.d. Web.
Inflation China 2012. n.d. Web.
Jain, Tror, Balbir Bajaj, Ashok Gupta, Ashpta Sandhu. Development Economics, New Delhi: FK Publications, 2007. Print.
Tucker, Irvin. Survey of Economics, Mason: South-Western Cengage Learning, 2011. Print.
United States Securities and Exchange Commission. Best Buy Fiscal 2012 Form 10-K, Washington, DC: USSEC, 2012. Print.
Appendices
Appendix 1
Appendix 2
The three year period income statement in USD
Appendix 3
Appendix 4