Abstract
Aim of the Research
The main aim of the research is to determine the relationship between customer satisfaction and price, product as well as service quality as well as a reflection by market share. This venture is achieved by using Pearson’s Correlation Model.
Participants
The study involves people sampled from online phone reviewers as registered on online stores such as alibaba.com and official Nokia and Samsung websites
Sampling and Sample
Sampling was conducted using random purposive sampling. The sample was 503 (N=503) participants in total with 258 Nokia (N1=258) and 245 Samsung (N2=245) users.
Data Collection
Data was collected by sending an online survey containing 18 questions that were objectively structured to answer the four research questions and fulfill the four research objectives.
Variables
Dependent variables included customer satisfaction and customer loyalty. The Independent variables included price, product quality, and market share and service quality
Results
There were strong correlations between customer satisfaction and each of the independent variables that included price, product quality, and market share and service quality. Similar results were obtained in the case of customer loyalty.
Conclusion
According to the study, it is concluded that sellers, manufacturers, and service providers in the Smartphone industries, as well as other industries, must check their pricing strategy, reduce the cost of use, improve product or service quality, and monitor market share to achieve high customer satisfaction and loyalty.
Introduction
This introductory chapter seeks to create a foundation for the commencement of the research. Importantly, it seeks to provide background concepts that relate to the topic of study. The chapter will also include a clear elaboration of the rationale and the purpose of the study. The rationale indicates the need for the study in the contemporary business setting and outlines how the findings of the research will help to improve the area of focus. This will be reinforced by the statement of various research questions which form the basis of presenting the results and making conclusions. Further, the chapter will focus on the specific scope of the research to identify the geographical, conceptual, and logistical focuses of the study. This discussion also incorporates a detailed dissertation structure which explains the various chapters and their component. As such, it sets the stage for the conduct of this research, provides a clear roadmap and ensures a logically organized documentation of the same.
Background of the Study
In general terms, this study focuses on the relationship between customer satisfaction and loyalty versus other aspects that include the product or service quality, price, and the reflection of the market share. As such, this implies that the study will first seek to determine the association of customer satisfaction and all the three mentioned variables separately. It will then proceed to investigate the relationship between the loyalty of customers and each of the variables above (price, product quality, and reflection by the market share). Based on the focus of the study, it is evident that customer satisfaction, loyalty, price, product quality, service quality, and the reflection by the market share are the anchors of the study. In this light, therefore, it becomes important to understand the background concepts revolving around these six aspects and their components.
To start with, customer satisfaction is seen as a representation of the extent to which product and service providers meet or surpass the needs and expectations of their clients. This implies that customer satisfaction provides a parameter that can be used to measure the performance of the business and simultaneously provide the basis for improvement. In case, the satisfaction of customers is low, the product or service provider is under the obligation to identify the inherent detriments of the business, eliminate them, or reduce their impacts on the expectations of the customers. Such a procedure can effectively amount to a business improvement process. In other words, it is a metric used to monitor and manage business given that, in a business scenario, the customer is the key determining factor of success.
Of critical importance to this study is the fact that customer satisfaction is highly related to the loyalty of the customers towards the product or the service provided. This relationship is based on the fact that the level of satisfaction serves as an indicator of the likelihood of customers to repurchase the product or re-seek the service. Further, it is a major tool used by businesses and companies to differentiate their products and services. This differentiation is crucial because most of the product or service providers incur competition. On the face of such competition, differentiation is not only paramount but also inevitable if at all the business has to survive and thrive.
As mentioned previously, the second aspect of concern in this study is the loyalty of customers. In this regard, the loyalty of customers is closely associated with the satisfaction of the customer. By definition, it is defined as the likelihood of customers to repurchase a product or re-seek a service from the same provider due to the satisfaction derived from admirable physical attributes of the product, perception of product’s value, and positive emotional encounter. From this definition, it is important to note that loyalty can be determined by satisfaction, but it brings in a factor of emotional connection and perception.
When it comes to price, it is seen as the value that the customer gives as payment in exchange for a service or a product. In contemporary society, however, this value is widely measured in terms of money. As such, some can define price as the money given by a customer in exchange for a product or service provision. For this dissertation, the price will be considered in terms of two different dimensions. In particular, price in a typical Smartphone industry comprises of market price and the total cost of utilization. The market price is the price set by the providers and sellers mainly based on the supply and demand forces. The total cost of use is viewed as the maintenance cost that the client incurs as a result of using the product. There is also another dimension known as the value for money although it will not be used in the dissertation. Value for money is a parameter of the price that assesses whether the client gets the benefits that are consistent with the money given to the seller. As such, value for money is a variable that incorporates the market price, total cost of use, and the value of the products.
Product and service qualities also comprise an important aspect of this study since the research seeks to understand its relationship with the customer s satisfaction and loyalty. In principle, quality is defined as the fitness of a product or a service to its intended purpose or required fulfillments respectively. Essentially, the quality of products and services is very crucial in the Smartphone industry. This importance is based on the fact that the industry provides both devices and supplementary services to ensure that all the customers’ needs are served.
The last aspect of consideration in this research is the reflection by market share. In this regard, the question is whether the customer’s satisfaction affects the market share of a service or product provider. Market share is the percentage of customers that a product or service provider controls out of the total number of clients that have subscribed to the service or bought similar products. In most cases, the market share of a given seller is determined by the number of clients that have purchased or used the seller’s product or service respectively. In particular, this study will consider the battery capacity, and weight of the phone Smartphone as the components of product quality. Regarding service quality, the courtesy of customer care, time used to resolve complaints, and representative knowledge to measure the quality of service.
Table 1: A table showing the variables considered in this research and their corresponding possible dimensions.
Rationale of the Study
Essentially, the technological industry is growing at a rapid rate due to the increasing demand for efficiency and cost reduction. As such, many companies have emerged to provide customers with technologically efficient and cheap devices. The Smartphone industry is one of the arenas where many manufacturers have emerged to take a portion of the market. As a result, the industry has become very competitive and sensitive to service delivery as well as customer relations. Understandably, customer satisfaction is a crucial component when it comes to the issue of relationships with customers. In this light, therefore, companies must determine the factors that affect the satisfaction and loyalty of their customers to succeed. Further, they must also seek to rank these factors to understand the ones that have a bigger impact than the others.
Besides, the increased competition has led to the provision of more technologies and services in pursuit of increasing sales as well as gaining more customers. This scenario amounts to disruption-like change. With a disruption of this kind, it is important to conduct up-to-date research that determines whether aspects, such as price, market share and product or service quality, still influence the customer’s decision of purchase just as it has been perceived traditionally.
Further, the investigation regarding the satisfaction of customers is important for Nokia. In this case, the research seeks to focus on Nokia as the company of study. Understandably, Nokia was one of the traditionally dominant companies in the world. However, it incurred heated competition due to the rise of many mobile phone companies. As such, the viability and dominance of Nokia as a brand were surpassed by the new entrants especially with the rise of the Android operating system. This competition and subservience of the company have led to drastic measures such as the rebranding of Nokia to Microsoft. It is therefore very important for Nokia to pay attention to the customer’s relationship because it will determine their ability to rise once more and thrive amidst the contemporary competition. These aspects form the rationale of the study and show its significance both in the Smartphone industry and the customer relations arena.
Aims and Objectives of the Study
Essentially, the aim and objectives of a research study are interconnected but their scope differentiates them. In particular, the aim of a research study is the general intention of the researcher. On the other hand, the objectives comprise the various undertakings that must be fulfilled to achieve the aim as shown below.
Aim of the Research
This research aims to determine the relationship between customer satisfaction and aspects that include price, product, or service quality, as well as how it is reflected by the market share. In the same light, it seeks to determine the relationship between loyalty and the same mentioned aspects that include price, product or service quality, as well as how the customer’s loyalty is reflected by the market share.
Research Objectives
To fulfill the above research aim, the following undertakings will be fulfilled. In this case, it is important to note that customer satisfaction or loyalty means that calculations for customer’s satisfaction and loyalty will be conducted separately.
- To calculate the correlation between customer satisfaction and price using Nokia and Samsung as the case.
- To calculate the correlation between customer satisfaction and Product quality using Nokia and Samsung as the case.
- To calculate the correlation between customer satisfaction and the service quality using Nokia and Samsung as the case.
- To determine how customer satisfaction and loyalty are reflected by the market share using Nokia and Samsung as the case.
NB: The customer’s satisfaction and loyalty were considered as two different variables during the calculations. As such, the correlations for customer satisfaction will be calculated followed by those of loyalty.
Research Questions
In principle, the research questions are derived from the research objectives. Based on this fact, four pertinent research questions will form the basis for interpreting the results.
- Using Nokia and Samsung as the cases, what is the association between customer satisfaction and price?
- Using Nokia and Samsung as the cases, what is the association between customer satisfaction and product quality?
- Using Nokia and Samsung as the cases, what is the association between customer satisfaction and service quality?
- Using Nokia and Samsung as the cases, how are customer’s satisfaction and loyalty reflected by the market share?
Scope of the Research
The scope of this research is viewed in three different dimensions, including the geographical, institutional, and focus-based scopes. Concerning institutional scope, the research uses Nokia as the case study company. When it comes to the question of geographical scope in light of answering the question of market share reflection, the research considers America, Asia, and Africa as the regions of analysis. Lastly, the research focuses on the relationship between customer satisfaction or loyalty and the variables included in table 1.
Dissertation Structure
The dissertation includes five different chapters that include an introduction, literature review, methodology, results and findings, and conclusion.
Introduction
This chapter forms the foundation of the entire dissertation based on the fact that it describes the background, significance, and aim of the study. As presented here already, it does not only provide the framework of the research, but it also shows the roadmap of the study.
Literature Review
This chapter analyzes critically previous studies that investigate the relationship between customer satisfaction or loyalty and any other aspect of the business. As such, the analysis is used as a basis for identifying the existing research gaps that should be filled in this study.
Research Methodology and Methods
This chapter includes the methods that were used to conduct various research undertakings. These undertakings include sampling, data collection, review process, and analysis among other items. Importantly, also, it discusses the rationale of using the chosen methods as opposed to others.
Data Presentation and Analysis
The chapter includes critical components that include the presentation of the collected data and its analysis. It presents the evidence obtained as a result of collecting data from the survey and proceeds to analyze and interpret it to answer the research questions.
Conclusion
Based on the data analysis and findings, the conclusion will present the main findings of the research about the research questions and objectives. Then, the chapter discusses the limitations of the study, possible future research, and the recommendations based on the research findings
Literature Review
As mentioned in paragraph 1.6, this chapter seeks to analyze and critically review existing literature regarding customer satisfaction, loyalty, and how they relate to the other aspects of business such as price. This analysis serves as the basis for identifying the research gap that is filled by the findings of the study. In essence, the chapter comprises of twelve items addressing loyalty, customer satisfaction, and the gap analysis as discussed onwards.
Customer satisfaction and Its Importance
In section 1.1, it is indicated that Esaki (2013) defined customer’s satisfaction as the extent to which the service or product providers surpass the expectation needs of the customers as influenced by emotions. Whereas Esaki defined customer satisfaction in that manner, Farkas (2011) defined it as a metric of evaluating customer’s positive or negative emotional experience. Although the two authors present two seemingly different definitions and meanings of the concept, they both agree that customer’s satisfaction is dependent and associated with emotions. Critically, this implies that the seller or the service provider must ensure a positive emotional experience using whatever actions or attributes.
Esaki (2013) further explains that customer satisfaction can be determined by a single attribute. Alternatively, it can be brought by cumulatively positive actions that happen over a given period. This implies that customer satisfaction can either be instant or a continuous process. In a critical sense, it means that the seller or service provider must act with the clients’ best interest in mind at all times. Otherwise, a single drawback or mishandling of a client can cause detriment in a competitive industry. Although the author creates the perception that these two are critical ways of achieving customer satisfaction, Schrader (2014) emphasized the long term and cumulative-based aspect is better in measuring customer satisfaction.
Having defined customer satisfaction in principle, Esaki indicated that customer satisfaction is a crucial component because it provides a metric of measuring performance. This position was backed by Schrader when he reiterated that customer satisfaction is essentially one of the major ways of assessing a company’s fulfillment of its obligations. In this case, the two authors seem to be convinced that business performance is mainly measured by its capability to serve the needs of customers. As such, a business that satisfies the expectations of customers should be described a well-performing entity. Now, Farkas does not essentially agree that a company’s ability to meet expectations is a perfect measure of performance. In that case, the author indicates that performance is a variant of many aspects such as profitability and satisfaction of stakeholder’s too. From a critical sense, this perspective makes sense but in the context of customers’ relations, the client is the king. This argument is based on the fact that, without meeting the expectations of the clients, variables such as profitability and stakeholders wither away. Importantly, the focus of this research is not limited to a company scenario, but also sole proprietorships as well as partnered businesses.
This implies that Traders and Esaki were very insightful and correct in this context of customer satisfaction. In the same light, Farkas sites another importance of customer satisfaction as the development of long term loyalty and referral. The author indicates that a business that meets the expectations of customers’ has a higher likelihood of progressive growth of customer base. This is based on the fact that customers are capable of referring to each other for a good product or service. It, therefore, becomes a self-driving process of customers’ acquisition in a business scenario. McKean noted that satisfied customers are capable of providing about 3 times more revenue as compared to those that are unsatisfied. Critically speaking, this scenario is contributed by the fact that satisfied customers have a high likelihood of repurchasing. Of course, the willingness of customers to repurchase goods is the basis of loyalty. This is the probable reason why Farkas indicated that customer loyalty and customer satisfaction are essentially intertwined even though they should be treated as mutually exclusive elements of the business. Lastly, McKean noted that a business finds it difficult to gain new customers than retain the old ones. As such, the satisfaction of customers is the surest way of ensuring that the current customers are maintained. Critically, this is one of the good reasons why businesses cannot ignore meeting the customer’s expectations.
Relationship between Customer Satisfaction and Price
Kyriazopoulos (2007) found that the relationship between customers’ behavior and the price of the commodity is close. This implied that customers respond to the price positively or negatively according to how the seller conducts pricing. In a similar research Esaki (2013) discovered that the customer’s satisfaction is highly influenced by the pricing. In this regard, it was noted that as the price increases, the capability of the devices and the fulfillment of services are assured. However, from a critical perspective, this scenario does not always hold because the seller might not automatically provide better products because he or she is getting more money. Instead, they might decide to save on the cost and provide substandard goods. As such, the factor of increasing satisfaction with the increasing price is dependent on the values of the provider and the willingness to provide high-quality goods or services.
Kyriazopoulos proceeded to investigate the behavior of customer satisfaction and the total cost of use which is a component of price in this research. In this case, the researcher noted that customer satisfaction reduced with the increase in the total cost of use. If a device demanded a lot of money to maintain and use, customer satisfaction reduces drastically. This is based on the fact that customers’ need to reduce their general cost of operation while getting the best value for the money they gave out. Critically, this implies that sellers and developers must work hard to reduce the cost of operation as well as maintenance cost. Esaki also provided a very important insight in regard to the question of value for money. In this regard, the author found that sellers who provided products that have value for money had a high likelihood to impress their customers and maintain them. This is an implication that people in general and clients prefer goods whose value is consistent with the money they gave out. As such, it is an indication that sellers should be very sensitive n value for money. Otherwise, charging more money or having exaggerated prices for a substandard product would reduce customers’ confidence and reduce the likelihood of repurchase or re-subscription.
Relationship between Customer’s Satisfaction and Product Quality
Farkas (2011) indicated that the quality of products is very influential on the satisfaction of customers. In the author’s research presentation, he indicated that every client seeks products because they require satisfying certain needs in their lives. As such, the researcher argued that the extent to which those needs are met determined the degree of satisfaction of the customer in question. This was backed by a similar finding which was made by Ko, Park, and Lee (2011). These authors indicated that customer satisfaction is highly dependent on how much the product appeal to the customer. Critically, this implies that a customer values product efficiency and performance.
Ko, Park, and Lee (2011) also made another finding to the effect that the longevity of a product is crucial to the satisfaction of a customer. Essentially, the longer the product lasts, the higher the satisfaction of the customers. This scenario implies that when a seller provides durable products, there is a very high likelihood of achieving customer satisfaction. Farkas alludes to this sentiment when he stated that leather products are preferred not mostly because of the product’s beauty but because of their ability to last for longer periods as compared to other synthetic products in the market.
Relationship between Customer Satisfaction and Service Quality
In research to determine the correlation between customer satisfaction and service quality, Kyriazopoulos (2007) noted that customers are very sensitive to how they are handled by the business owners. In this case, the author found that the social interaction between the customer and the seller or the company’s staff, determining satisfaction. Importantly, the research indicated that customer care is probably the strongest tool that a seller can use to earn new customers and retain them. In this light, the author reiterates that customers are not just buyers. They are normal human beings who seek social satisfaction during the interaction. This implies that a customer does not only come to a business to purchase a product and then disappear.
Instead, he or she seeks to interact with those s/he meets there. As such, sellers who handle customers with courtesy are more likely to attain customer satisfaction than those who do not. In addition to this, Farkas focused on the issue of response to customers’ concerns. In this case, the author indicated that customers’ have an emotional connection to the speed f response. In this regard, he reiterates that when a customer has a complaint or a question, the time used to respond and solve the conflict is very crucial. If the seller consumes a lot of time to respond to the issues raised, there is a very high likelihood of being unsatisfied. In case less time is used to solve the problem, the satisfaction of the customer is likely to increase. Essentially, the two authors agree that customers are social beings who are sensitive to the interpersonal skills exhibited by the seller. In the first case, courtesy shows that the seller has the goodwill to serve the client. That goodwill creates a positive impression on the mind of the client.
The Reflection of Customer satisfaction by the Market Share
Smith, Murray, and Howat (2014) indicated that the satisfaction of customers is associated with the size of the market share. In this case, the authors conducted investigated the influence of perception created about physique on customer satisfaction. In particular, the research focused on the fitness industry whereby the authors noted that the market share reflected the level of customer satisfaction. In particular, they discovered that increased market share in the fitness industry indicated high customer satisfaction. In a different study, Melnikas and Dapkevicius (2009) suggested that the market share is highly influenced by the influence of existent customers through referrals. In this regard, customers are fond of referring their colleagues to companies and service providers whom they have tested and approved. As such, according to the researcher, it was evident that the market share reflects the extent to which customers’ are satisfied by the services or products.
Customer loyalty and Its Significance to Smartphone Industry
Kyriazopoulos (2007) defined loyalty as the willingness of a customer to purchase a product from the same service/product provider. As such, the author reveals that loyalty can occur in the forms of both formal and informal loyalties. Regarding formal loyalties, service providers develop a system of loyal members. These members are provided with a loyalty card and they are entitled to various benefits as a result of such loyalty. On the other hand, it can be informal in the sense that customers repurchase products or re-seek services personally due to the fulfillment of expectations by the seller. In both cases, McKean (2014) indicated that loyalty is crucial to the success of a business regardless of the form in which it appears. The author identifies various benefits of customer loyalty which include the constant income flow and its predictability. When it comes to income flow, companies, and sellers with loyalty programs or loyal customers are assured of a certain threshold of sales regardless of the season/stage of the annual business cycle.
Besides, the business earning and return behavior becomes predictable because the company can study the customers over some time and determine their consumption behavior. Besides, that prediction forms the basis of production and service provision emphasis. In a different research study conducted by Kumar (2008) loyalty was termed as the foundation of a business. In this regard, the researcher discovered that creating loyal customers presents an opportunity to relate and earn from those customers from the conception to the strong establishment of the business. The author even proceeded to reiterate the customer loyalty is one of the techniques that help business people and companies to cut advertisement costs. In this case, the development of loyalties can surpass any marketing campaign however massive it is. As such, the researcher was a marketing venture. Lastly, research conducted by three scholars Ko, Park, and Lee (2011) found that loyalty is the surest way of fighting competition. In this case, the authors stated that the generation of loyalties insulates the business against competitive rivalry from both the established competitors as well as new entrants.
Relationship between Customer loyalty and Price, Product or Service Quality
Barlow and Ller (2008) stated that customer loyalty is an essential component in business. To explain some of the aspects that affect it, the authors indicated that price and product quality are critical to increasing customer loyalty. This was an indication that a customer would not repurchase a product if it did not have value for money or quality. In the same light, Belas, Chocholakova, and Gabcova (2015) reiterated that how sellers handle their clients determined the level of loyalty they have towards the seller and the business. In that same context, Anderson, (1996) had indicated that some of the components of service quality include staff courtesy, knowledge of respondents, and responsiveness. Some of these components are used as the sub-variables of service quality in this research. Further, Chinomona (2014) added some components including the time of complaint resolution and after-sale services such as warranty.
Reflection of Customer loyalty by the Market Share
Harden & Heyman (2009) investigated how market share can reflect the loyalty of customers. In their findings, they stated that market share is dependent on the number of customers subscribing to a service or purchasing a product. In that light, therefore, the researchers implied that if the market share is reliant on the number of customers and the customer base is dependent on loyalty, then the market share is a reflection of this loyalty. However, they did not analyze whether loyalty was a major determinant of market share or a weak aspect in that regard. This sentiment was support by Joseph (2010) when he indicated that the market share acts as the mirror of customer’s loyalty to a business, service, or product.
Gap Analysis
Although a lot of literature concerning customer satisfaction or loyalty and its relationship with other variables exists, it seems that that the research studies are general or specific on industries. In that regard, the Smartphone is a new industry which has surpassed industries such as computer-manufacturing. In that regard, therefore, it is clear that very little research has been conducted concerning the relationship between customer satisfaction and other aspects of the business. Besides, research has not focused on customer satisfaction of straining companies such as Nokia and comparing it with others that are doing well such as Samsung. This research will close this gap by focusing on the Smartphone industry and taking two companies that are fairing differently.
Research Methodology and Methods
Epistemological Approach
This study follows a positivist perspective in light of analyzing and interpreting the data. The positivist approach is a paradigm that advocates the pure use of mathematical stipulations and calculation to make determinations in research (Berg 2009). Essentially, it asserts that credible and reliable knowledge can only be obtained through the use of numerical calculations, but not the analysis of qualitative information (Collis & Hussey 2009). This is an implication that this approach disregards the use of qualitative aspects in analyzing and interpreting information to make recommendations (Creswell 2009). Although this approach comes under heated criticism, it is applied in this study because of its consistency to the nature of the study. The research uses numerical data and analysis to determine the association of customer satisfaction or loyalty and aspects such as price, product or service quality, and the market share. It is therefore vital to use the positivist approach when interpreting and analyzing the data. Besides, the interpretivism is inconsistent with the nature of the data considered in the study. As such, it cannot be used to interpret and approach the research whatsoever.
Research Approach and Time Frame
As mentioned in paragraph 3.1, this research seeks to use quantitative methods to collect and analyze the data collected. In particular, it relies on the Likert Scale to collect data on the level of customer satisfaction and loyalty in different scenarios. Further, the collected data is analyzed using the correlation analysis which is done with the assistance of the SPSS Software Package. At this point, it is important to note that the research proposal indicated that SERVQUAL and Kano models would be used. However, Denscombe (2009) noted that the two models are effective in determining the actual customer satisfaction or loyalty, but not the relationship between these variables and other aspects. Particularly, the correlation analysis focuses on the Pearson correlation which gives a correlation coefficient (r) which is used to identify the level of association. If the correlation coefficient is positive and greater than 0.5, there is a high positive association (Flick 2009). If the correlation is less than -0.5, there is a strong negative correlation between the variables. In case the coefficient is positive and less the 0.5, there is a weak positive correlation (Jha 2008). Similarly, if the coefficient is greater than -0.5 and negative, Liamputtong (2009) states that there is a weak reverse association as shown in this table.
In light of conducting this research, there was a schedule that was followed to the letter to ensure that there was the effective use of time availed for completion.
Research Strategy
The research uses a survey as the research strategy of choice in light of collecting its data. In particular, the survey comprises a questionnaire that required the respondent to answer 18 questions. The survey strategy was chosen on the basis that customer satisfaction and loyalty are aspects determined by the client’s mood. As such, a good indicator, which in this case, was the Likert Scale, would be used to obtain reliable data from the relevant population. The questions were framed in a manner that can be translated into numerical data using the Likert scale. Importantly, the research questions were structured to answer the research questions and fulfill the research objectives as follows.
However, before this final questionnaire was reached, a pilot survey was conducted to determine some of the deficiencies in the structure. In this regard, various issues were noted and the questionnaire improved accordingly. First, a welcoming message was included at the beginning of the questionnaire to ensure that the respondents have goodwill at responding to the questions. Then, a thank you message was also included to appreciate the input of the respondents. Also, the phrase Nokia or Samsung was changed to represent (Nokia or Samsung). This change was made because it was noted that respondents did not clearly understand the question with the original phrase. With the new phrase customers were able to understand the question clearly. Further, the original questionnaire did not include the question of the continent of residence. This was a very vital parameter because it was expected to provide information about market share for both companies in different continents. After the pilot study, the question was included to give a total of 18 questions.
Data Collection
Target Population
The population refers to the people that a study seeks to consider in light of data collection (Marshall & Rossman 2011). In this case, the population included people who had purchased a Samsung or a Nokia Smartphone. To get these people, online sites including alibaba.com and the official websites of Nokia and Samsung were considered. Clients who had either reviewed Samsung or Nokia received a reply under their reviews requesting to help in the survey. As such, 500 Samsung clients and 500 Nokia clients were contacted and verbal consent was obtained using phone calls. When the potential participants refused, calls were made until consent was attained. The questionnaire bearing survey was emailed to the email addresses to allow responses
Sample Size
Although 1000 potential participants conceded to participate in the study, only 503 responded to the online survey. Essentially, 258 and 245 participants responded from the Nokia and Samsung selections respectively. This implies that the total sample size was 503 and the percentages of respondents for both Samsung as well as Nokia were 52% and 48% respectively.
Sampling
In perspective, sampling was conducted using a random purposive method. This incorporates two different techniques including randomization and purposefulness (Sachdeva 2009). Randomization helped to eliminate biasness while the purposefulness ensured that those people who were contacted had substantially useful information to the research (McBurney & White 2010). That is why the research focused on people who had reviewed the two smartphones.
Data Analysis
Although the research proposal had indicated that SERVQUAL and Kano models would be used in this research, further investigations showed that correlation analysis was the most appropriate. In this case, therefore the Pearson correlation coefficient was used to analyze data and interpret it. This coefficient was calculated by the use of the SPSS software package and the interpretation was done onwards.
Ethics
Yin (2009) emphasized the importance of ethical behaviors when undertaking research studies. To conduct ethical research, two aspects were considered in the process. First, the participants’ rights were considered all through. Verbal consent was obtained to ensure that participants agreed to take the survey. Secondly, the personal information of participants was protected and kept confidential to ensure personal privacy. Third, the participants were only contacted in the course of the daytime to ensure that their time with family and friends at night was not affected.
Reliability and Validity
There are various ways in which reliability and the validity of the research were ensured. In this case, sampling was done randomly to prevent biasness and purposively to ensure objectivity. Additionally, the researchers used a quantitative approach which is more valid than the qualitative methods. As such, the reliability and validity of the research were substantially ensured.
Data Presentation and Analysis
Customer satisfaction Data
N= 503
Nokia Owners Participants (N1) = 258
Samsung Owners Participants (N2) = 245
Data regarding customer satisfaction and the prices for both Samsung and Nokia cases
To what extent does a Nokia or Samsung Smartphone of the following market prices satisfy you?
To what extent does the Nokia or Samsung Smartphone with the following total cost of use satisfy you?
Data regarding customer satisfaction and the product quality for both Samsung and Nokia cases
To what extent does a Nokia or Samsung Smartphone with the following battery capacities satisfy you?
To what extent does a Nokia or Samsung Smartphone with the following weights satisfy you?
To what extent does a Nokia or Samsung Smartphone with the following camera capabilities satisfy you?
Data regarding customer satisfaction and the service quality for both Samsung and Nokia cases
To what extent does the following level of staff courtesy satisfy you in Nokia or Samsung companies?
To what extent do the following time frames of conflict resolution satisfy you?
Data regarding how customer satisfaction is reflected by market share for both Samsung and Nokia cases
The overall level of satisfaction and the market share.
Analysis of Data for Customer’s Satisfaction
Analysis of Data Regarding Customer satisfaction and Price
Analysis of Data Regarding Customer satisfaction and Service Quality
Analysis of how customer satisfaction is reflected by market share
Customer’s Loyalty Data
Data concerning Customer loyalty and Price
To what extent does a Nokia or Samsung Smartphone of the following prices influence your willingness to repurchase it?
To what extent are you likely to repurchase a Nokia or Smartphone with the following monthly cost of use?
Data concerning customer loyalty and Product Quality
To what extent are you likely to repurchase a Nokia or Samsung Smartphone with the following battery capacities?
To what extent does a Nokia or Samsung Smartphone with the following weights influence your willingness to repurchase it?
To what extent are you likely to repurchase a Nokia or a Samsung Smartphone with the following camera capabilities?
Data regarding customer loyalty and the service quality for both Samsung and Nokia cases
To what extent are you likely to repurchase a Nokia or Samsung Smartphone based on the following level of staff courtesy?
To what extent do the following time frames of complaint resolution increase your likelihood to repurchase satisfy you?
Data on how customer loyalty is reflected by the market share
- In which continent is your country of residence situated? (Tick beside the appropriate answer)
-
- Asia
- Africa
- Europe
- America
- How do you rate your willingness to repurchase a Nokia or Samsung Smartphone?
Customer loyalty Data Analysis
Analysis of data regarding customer loyalty and price
Analysis of data regarding customer loyalty and product quality
Analysis of data regarding customer loyalty and service quality
Analysis of data concerning customer loyalty and Market Share
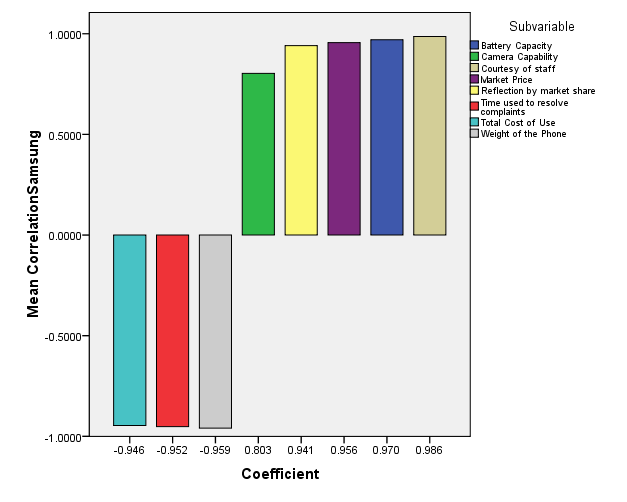
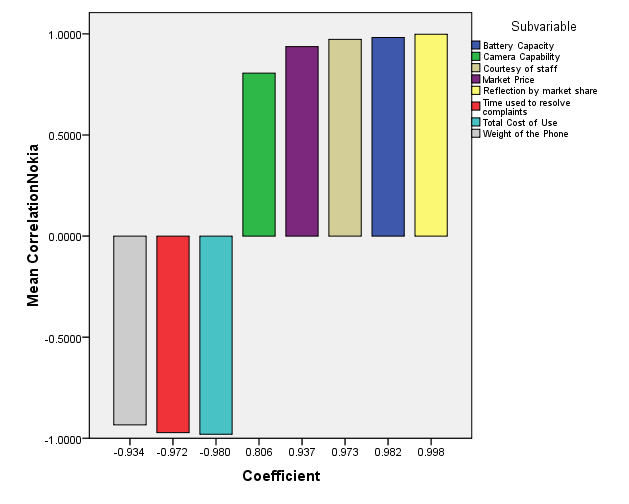
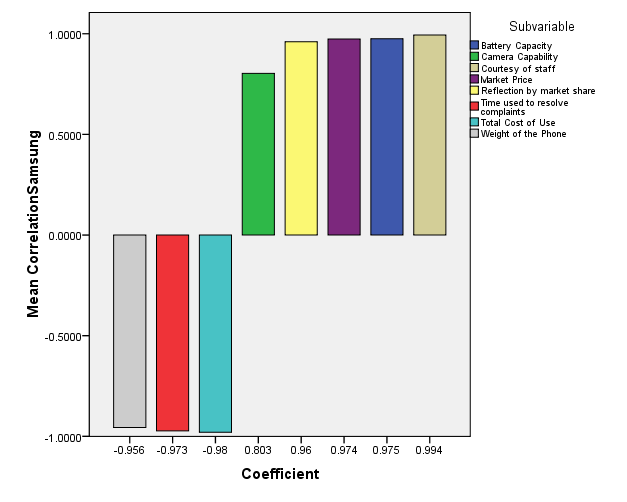
A tabular representation of correlations coefficients between various variables/sub-variables and customer satisfaction and Loyalty
Correlation Coefficients for Customer satisfaction and the Variables
Correlation Coefficients for Customer loyalty and the Variables
Critical Interpretation
Based on the analysis, the correlation coefficients indicate that there are strong associations between customer satisfaction or loyalty and other variables. All the variables have a strong relationship with customer satisfaction. However, some of the sub-variables have a positive correlation while others are negatively correlated. In particular, the market price, the battery life, courtesy of staff, and reflection by market share are positively correlated. This implies that whenever there is an increase in the market price, courtesy of staff, and market share, the customer’s satisfaction, and loyalty increase. On the other hand, the cost of use, time used to resolve complaints, and weight of the phone are negatively and highly correlated to customer satisfaction. This implies that an increase in the total cost of use, the weight of the phone, or the time used to resolve a conflict leads to reduced customer satisfaction or loyalty. In that regard, the reverse is true such that a reduction in the weight of the phone, time used to resolve complaints, and total cost of use lead to increased satisfaction. Importantly, it is critical to note that customer satisfaction and loyalty is reflected by the market share. In this case, when a brand offers high customer satisfaction and incurs a high level of loyalty, it increases its market share according to this study. Essentially, these findings are consistent with the findings of Esaki and Farkas as discussed in the literature review.
Conclusion
This chapter discusses the main findings of the research about the research objectives. To satisfy these objectives, the findings will be provided in form of answers to the research questions. This format of presentation is based on the fact that research each research question is drawn from the correspondent research objective directly. Also, the chapter presents some of the research limitations, a future study on the topic, and recommendations drawn from the findings made
Main Findings in the Context of Research Objectives and Questions
Using Nokia and Samsung as the cases, what is the association between customer satisfaction or loyalty and price?
The analyzed data shows a high positive correlation between customer satisfaction or loyalty and price. The correlation obtained for customer satisfaction and market price case of Nokia is 0.932 while that one of Samsung is 0.956. The correlation of customer loyalty and the market price is also above 0.5 and hence considered a high positive association. However, the correlations between customer satisfaction or loyalty and total cost of use are negative but also very high. This is an indication that customers’ do not get satisfaction with a Smartphone that has a high cost of use. As such, it can be concluded that the total cost of use is inversely related to customer satisfaction. As a direct answer to the question of whether the price is related to customer satisfaction and loyalty, then it is concluded that there is a strong relationship.
Using Nokia and Samsung as the cases, what is the association between customer satisfaction or loyalty and Product quality?
All the sub-variables of product quality showed a high correlation with customer satisfaction and loyalty. In this case, the weight of the phone showed a negative high correlation with satisfaction and loyalty. On the other hand, battery capacity and the capacity of the camera showed a high positive correlation. As the bottom line, therefore, it can be concluded evidently that product quality is closely associated with customer satisfaction and loyalty.
Using Nokia and Samsung as the cases, what is the association between customer satisfaction or loyalty, and service quality?
In this case, the research analysis finds that there is a correlation between customer satisfaction or loyalty and service quality. It was determined that an increase in the courtesy of customers and a reduction in the time used to resolve a complaint lead to an increase in customer satisfaction. In this case, they are indeed associated but the association for customers’ courtesy is positive while that of time used to resolve complaints is negative.
Using Nokia and Samsung as the cases how are customer satisfaction or loyalty and loyalty reflected by the market share?
Lastly, it was similarly determined that the loyalty and satisfaction of customers are reflected by the market share. In this case, this conclusion was based on the high positive correlation which implied that a high market share corresponded with high customer satisfaction or loyalty. In essence, it cannot be disputed that the variables of price, service quality, and product quality are strongly related to customer satisfaction and loyalty. In the same light, customer satisfaction or loyalty is reflected in the market share.
Implications, Contributions, and Recommendations of the Research
Essentially, various implications can be made from this research based on the findings made. First, it is implied that the pricing strategy of a product manufacturer in the Smartphone industry affects the satisfaction of customers. In this case, however, the price increase must come with value for the money such that the high prices reflect high value. Second, it can be implied that the seller’s service quality and the quality of the product they produce is essential in determining whether the customers are satisfied and whether they will repurchase the item. Lastly, the findings mean that the level of customer satisfaction or loyalty affects the market share significantly. In terms of the contributions of the research, the vast number of participants allows the research to be applied in other industries rather than the Smartphone industry alone. In this case, its findings are important in guiding how sellers price their products in the market and how they handle after-sale services. In this light, therefore, the following recommendations are made in pursuit to improve the customers’ relations in the Smartphone industry and other fields of production or service provision.
- Sellers and service providers should make sure that the prices placed on goods and services are consistent with the value of the service or product. In other words, their prices should reflect value for money.
- Product manufacturers, companies, and other organizations should ensure they do not provide substandard goods to cut costs. Substandard production reduces customer satisfaction or loyalty and hence the customer-based reduces.
- The sellers should pay close attention to how they handle their clients because it is a major determinant of satisfaction or loyalty. In this case, the behavior of staff should be professionalized and the time used to solve complaints should be reduced as much as possible
- Lastly, it is recommended that sellers and service providers should keep in mind the importance of customer satisfaction to the market base. This way they should remember that their client base is determined by the satisfaction of customers and their willingness to purchase from them.
Limitations and Challenges
One of the critical limitations of this study arises from the fact that the participants in the case of Samsung did not surpass half of the ones contacted. There were 500 participants contacted but 245 responded. This implies that the non-respondents were 255 which amounts to 51%. As such, only 45 percent responded to the study after they received the questionnaires. This implies that there is a likelihood for the responses of the non-responders to negate the responses of the responders. However, since the overall percentage of responders was approximately 50.3%, it was assumed that the effect would not be significant. Besides this limitation, there was a critical challenge during the collection of data. In this case, it was very difficult to convince people to take the surveys considering that they were selected from customers who conducted online reviews. Such a scenario meant that they had to be contacted by relying on the reviews requesting them to provide their email for the survey.
Future Research
In this case, future research can be conducted to incorporate multiple industries such as the hospitality, fashion, and food industries among others. This suggestion is based on the fact that different industries have unique characteristics. As such, it would be important to investigate whether the relationship between customer loyalty and the four variables changes.
References
Anderson, E 1996, ‘Customer Satisfaction And Price Tolerance’, Marketing Letters, vol. 3, no. 21, pp. 265-274.
Barlow, J, & Ller, C 2008, A complaint is a gift recovering customer loyalty when things go wrong, Berrett-Koehler, San Francisco, California
Belas, J, Chocholakova, A, & Gabcova, L 2015, ‘Satisfaction and loyalty of banking customers with a gender approach’, Economics & Sociology, vol. 21, no. 7, pp. 176-188.
Berg, B 2009, Qualitative research methods for the social sciences, 7th edn, Allyn & Bacon, Boston.
Chinomona, R 2014, ‘The Influence of E-Service Quality on Customer Perceived Value, Customer Satisfaction and Loyalty in South Africa’ MJSS Mediterranean Journal of Social Sciences, vol. 5, no. 9, pp. 331-341.
Collis, J & Hussey, R 2009, Business research: a practical guide for undergraduate & postgraduate students, 3rd edn, Palgrave Macmillan, Basingstoke, Hampshire.
Creswell, J 2009, Research design: qualitative, quantitative, and mixed methods approaches, 3rd edn, Sage, Los Angeles.
Denscombe, M 2009, Ground Rules for Social Research Guidelines for Good Practice, 2nd edn, McGraw-Hill International (UK) Ltd, Maidenhead.
Esaki, K 2013, ‘Analysis of Influence of Price to Customer Satisfaction Based on the Prediction Models’, IIM Intelligent Information Management, vol. 5, no. 6, pp. 93-102.
Farkas, V 2011, Customer relations, Nova Science, New York.
Flick, U 2009, An introduction to qualitative research, 4th edn, Sage Publications, Los Angeles.
Harden, L & Heyman, B 2009, Digital engagement internet marketing that captures customers and builds intense brand loyalty, AMACON, New York.
Jha, N 2008, Research methodology, Abhishek Publications, Chandigarh.
Joseph, J 2010, The experience effect engage your customers with a consistent and memorable brand experience, AMACOM, New York.
Liamputtong, P 2009, Qualitative research methods, 3rd edn, Oxford University Press, South Melbourne, Vic.
Marshall, C & Rossman, G 2011, Designing qualitative research, 5th edn, Sage, Los Angeles.
Ko, S, Park, E, & Lee, H 2011, ‘Structural Relations among Perceived Justice of Service Recovery, Customer’s Emotion and Satisfaction: Focusing on Airline Complaint Customers’, The Journal of the Korea Contents Association, vol. 3, no. 34, pp. 413-423.
Kumar, V 2008, Managing customers for profit: Strategies to increase profits and build loyalty, Wharton School Pub, Upper Saddle River, N.J.
Kyriazopoulos, P 2007, ‘Can Price Perceptions Influence Customer satisfaction?’, Research of Marketing Laboratory, vol. 6, no. 1, pp. 11-22.
Lawfer, M 2004, Why customers come back how to create lasting customer loyalty, Career Press, Franklin Lakes.
McBurney, D & White, T 2010, Research methods, 8th edn, Wadsworth Cengage Learning, Belmont, CA.
McKean, J 2014, ‘Today’s Customer’s New Voice Vertical Industry Innovators’, Customer’s New Voice Extreme Relevancy and Experience Through Volunteered Customer Information, vol. 2, no. 1, pp. 101-145.
Melnikas, B & Dapkevicius, A 2009, ‘Influence of Price and Quality to Customer satisfaction in Neuromarketing Approach’, Science in Future of Lithuana, vol. 1, no. 3. pp. 132-143.
Sachdeva, J 2009, Business research methodology, Himalaya Pub. House, Mumbai.
Schrader, D 2014, ‘Practical Guide: How to Leverage the Customer’s New Voice Today’, Customer’s New Voice Extreme Relevancy and Experience Through Volunteered Customer Information, vol. 6, no. 2, pp. 213-233.
Smith, J, Murray, D & Howat, G 2014, ‘How perceptions of physique can influence customer satisfaction in health and fitness centers’, Managing Leisure, vol. 5, no. 4, pp. 442-460.
Yin, R 2009, Case study research: design and methods,Sage Publications, Los Angeles.
Appendices
Appendix 1: Final Questionnaire
Thank you for accepting to participate in this survey. This research seeks to understand the relationship between customer satisfaction or loyalty and aspects of price, product or service quality, and market share.
- Between Samsung and Nokia which model did you concede to provide data? (Choose one option based on which you will provide answers)
- To what extent does a Nokia or Samsung Smartphone of the following market prices satisfy you?
- To what extent does Nokia or Samsung Smartphone with the following total cost of use satisfy you?
- To what extent does a Nokia or Samsung Smartphone with the following battery capacities satisfy you?
- To what extent does a Nokia or Samsung Smartphone with the following weights satisfy you?
- To what extent does a Nokia or Samsung Smartphone with the following camera capabilities satisfy you?
- To what extent does the following level of staff courtesy satisfy you in Nokia or Samsung companies?
- To what extent does the following times frames of complaint resolution satisfy you?
- In which continent is your country of residence situated? (Tick besides the appropriate answer)
-
- Asia
- Africa
- Europe
- America
- What is your general level of satisfaction with the Nokia or Samsung Smartphone?
- To what extent are you likely to repurchase a Nokia or Samsung Smartphone of the following prices?
- To what extent are you likely to repurchase a Nokia or Smartphone with the following monthly cost of use?
- To what extent are you likely to repurchase a Nokia or Samsung Smartphone with the following battery capacities?
- To what extent are you likely to repurchase a Nokia or Samsung Smartphone with the following weights?
- To what extent are you likely to repurchase a Nokia or a Samsung Smartphone with the following camera capabilities?
- To what extent are you likely to repurchase a Nokia or Samsung Smartphone based on the following level of staff courtesy?
- To what extent are you likely to repurchase a Nokia or Samsung Smartphone based on these time frames of complaint resolutions?
- In which continent is your country of residence situated? (Tick besides the appropriate answer)
-
- Asia
- Africa
- Europe
- America
- How do you rate your general likelihood to repurchase Nokia or Samsung Smartphone?
I highly appreciate the time, efforts, and the replies that you have provided for the sake of my research. Indeed, this research will be a major contribution to the two companies and the entire Smartphone industry so that the players can better understand customers needs including yours. Thank you.
Appendix 2: Original Questionnaire before Pilot Study
- Between Samsung and Nokia based on which model did you concede to provide data? (Choose one option based on which you will provide answers)
- To what extent does a Nokia or Samsung Smartphone of the following market prices satisfy you?
- To what extent does Nokia or Samsung Smartphone with the following total cost of use satisfy you?
- To what extent does a Nokia or Samsung Smartphone with the following battery capacities satisfy you?
- To what extent does a Nokia or Samsung Smartphone with the following weights satisfy you?
- To what extent does a Nokia or Samsung Smartphone with the following camera capabilities satisfy you?
- To what extent does the following level of staff courtesy satisfy you in Nokia or Samsung companies?
- To what extent does the following times frames of complaint resolution satisfy you?
- What is your general level of satisfaction with the Nokia or Samsung Smartphone?
- To what extent are you likely to repurchase a Nokia or Samsung Smartphone of the following prices?
- To what extent are you likely to repurchase a Nokia or Smartphone with the following monthly cost of use?
- To what extent are you likely to repurchase a Nokia or Samsung Smartphone with the following battery capacities?
- To what extent are you likely to repurchase a Nokia or Samsung Smartphone with the following weights?
- To what extent are you likely to repurchase a Nokia or a Samsung Smartphone with the following camera capabilities?
- To what extent are you likely to repurchase a Nokia or Samsung Smartphone based on the following level of staff courtesy?
- To what extent are you likely to repurchase a Nokia or Samsung Smartphone based on these time frames of complaint resolutions?
- How do you rate your general likelihood to repurchase Nokia or Samsung Smartphone?
.Appendix 3: Graph showing the correlations of Customer satisfaction or loyalty and the Sub-variables