Abstract
Employee turnover has become foremost problem with companies today. Employee turnover causes a high cost to the company. In the UAE employee turnover is very high. This paper is an investigation into the employee turnover problem that the firms in UAE face. The paper tries to determine the reasons, which causes job dissatisfaction among employees and results in turnover intention. The research used a quantitative methodology and data was collected through questionnaire survey. Hypothesis testing was done through correlation analysis of the measures of job satisfaction, which were work environment, career development, management style, promotion, and compensation. The analysis showed that the above-mentioned measures led to greater job satisfaction and thus helped in retention of the employees. The suggested retention strategies to be employed by the organizations in order to retain employees was to improve the working environment of the organizations, introduce career development, make management style more participative, promotions must be fair, fair and equitable compensation, and enrichment of the job of the employees.
The retention strategies that should be employed by the organizations are to improve the working environment of the organizations, introduce career development, make management style more participative, promotions must be fair, fair and equitable compensation, and enrichment of the job of the employees. This will increase job satisfaction of the employees and increase retention of employees by reducing turnover.
Introduction
The most important asset in an organisation is its people. Therefore, it is crucial for an organisation to retain its employees as they are considered the main asset of any kind of business. Having worked in a government organisation in Dubai, high turnover has been experienced. Even when, due to the present financial crisis there are abundant of human resource, organisations in the Middle East are faced with a challenge of recruiting and retaining employees.
Employee turnover is divided into two types – involuntary turnover and voluntary turnover. When employees are asked to leave due to poor performance or inappropriate behaviour it is called involuntary turnover. Voluntary turnover is when an employee leaves an organisation based on personal choice such as when employees find jobs that offer higher salaries, better compensation, better job position etc.
There are numerous problems associated with employee turnover in organisations. One of the main problems is that high rates of employee turnover costs huge amount of money. “The costs of employee turnover can be staggering, ranging anywhere from 1/2 to 5 times an employee’s annual wages dependent upon his or her position.” Today, the costs associated with employee turnover along with the difficulty in finding qualified employees present a huge risk facing organisations. According to Zed Ayesh, Managing Directors of Flagship Consultancy, a management expert firm, “’Costs of turnover can easily surpass 150% of the employee compensation figure and would be much higher for managers and high paid executives.” Developing retention strategies is important as it leads to the reduction in the cost of employee turnover, loss of company knowledge, interruption of customer service, affects the goodwill of the organisation, turnover can lead to even higher turnover, and waste of time to find the right replacement.
The aim of this study is to evaluate and measure the rate of employee turnover in government organisations in the UAE. Turnover related data will be collected through questionnaire survey and analysed. Based on the analysis, strategies will be recommended where significant improvement is required. Three government companies from the petroleum, telecommunications, and real estate and investment sectors will be studied and evaluated vis-a-vis a set of criteria related to job satisfaction.
The petroleum company has a network of approximately 167 service stations located in Dubai and the Northern Emirates. It also runs the vehicle registration service as well as vehicle servicing centres.
The telecommunications company which is the largest in the region and 12th largest globally operates in the UAE. The company has a modern telecommunications infrastructure and offers innovative and up-to-date high-tech services.
The real estate company,, launched in 2005, is a holding company that owns and develops a portfolio of different industries such as leisure and entertainment as well as other developments related to energy, healthcare and hospitality. It has a major role in the growth of Dubai. The portfolio of the company spans four major strategic areas, which include transport and logistics, dry-docks, and maritime, urban development and financial services.
Employee turnover is a growing concern in the United Arab Emirates and the region as a whole. According to the most recent Labour Report released by the UAE Ministry of Labour, “Expatriate labour in UAE makes up more than 90% of the private sector’s labour force at about 3,113,000 foreign workers employed by 260,000 establishments, which is an average of 12 workers per establishment”. The average length of time an employee holds a job in the UAE is 4.7 years. According to Gulf News, “UAE companies may be incurring Dh9.9 billion in additional staff-related costs due to high turnover among workers in the country.”
According to Zed Ayesh, “Mobility of skilled professionals remains a challenge to UAE businesses.” Consequently, this leads to waste of resources and increase in expenses of the organisation. In addition, to the tangible cost there are intangible costs of turnover which affects regional companies experience knowledge drain as employees leave with valuable experience and knowledge.
Ayesh also believes that turnover results in training and productivity cost of new employees, as it takes time for people to be productive. In addition, other costs include loss of revenue, slow customer service, less production, the ability to deliver projects on time and loss of business relationships and contacts.
Reducing the rate of employee turnover in organisations implies retaining good performers. This would reduce training cost of new employees regularly. Moreover, when people leave, work is left pending, which leaves other employees to carry out those jobs temporarily, leaving some frustrated as increase.
Furthermore, a stronger retention strategy would increase employee loyalty and decrease in expenses: “High staff turnover has both monetary and non-monetary consequences.” If an employee resigns, the organisation has to bear expenses related to end of service benefits, visas, cost of employment card, absence of staff until replacement is found as well as loss of productivity, loss of knowledge and training of employees who have left the organisation. Other expenses are related to recruitment processes such as cost of recruitment agencies and cost of advertising for the vacant position.
In the UAE, the cost associated with turnover of each employee is about AED15,180 every year. “The turnover rate of 21% (approximately 657,930 workers) in a workforce of 3,113,000 equates to a ($2.7bn) Dhs9.9bn cost to business every year. For an average business with 12 workers, the annual turnover cost is approximately ($10,400) Dhs38,250.”
This paper can be beneficial to any organisation experiencing such problems in order to gain improvement and increase productivity.
Literature Review
Literature review encompasses the relevant theories and previous studies in the area of employee turnover in organizations. This section first discusses the concepts of how job satisfaction and retention is related to performance. Then, theories related to employee turnover are mentioned. Theories related to the measures of job satisfaction, like work environment, management style, career development, nature of job, compensation, promotions, and co-worker relationships, are covered. Finally, strategies undertaken to reduce the rate of employee turnover in different organizations are described.
Employee Turnover
March and Simon (1958) described that an employees’ intention to depended on his job dissatisfaction and his perceived ease of availability of job. They considered ‘job satisfaction’ as a “push” factor and the latter “pull” factor. Mobley (Mobley 1977) conceived a model, which associated negative job attitude to voluntary turnover. He proposed a series of links between an employees’ perception of his present job and turnover in a causal order – assessment of existing job – job dissatisfaction – thinking of quitting – evaluation of expected utility of search and cost of quitting – intention to search for choice – search for choices – appraisal of choices – assessment of alternatives vs. present job – intention to quit/stay – quit/stay. Subsequent researches on employee attrition have reflected influence of March and Simon’s push and pull factor and Mobley’s psychological model.
Griffeth, Hom and Gaertner (2000) conducted a meta analysis of 800 employee turnover studies and concluded that employee turnover is affected by:
- Overall job satisfaction
- Loyalty towards the employer
- Employer alternatives
- Employee intentions to quit
Griffeth et al (2000) noted that lack of job satisfaction led to employee turnover. A similar finding is demonstrated in the study by Boxall et al (2003) who studied an organization in New Zealand. According to their study, the main reason for employee attrition was when they found another job to be more interesting.
Previous researches have shown that economic factors have a dominant impact on employee turnover in organizations. As Mobley et al (1979) noted that there exists a link between economic factors such as levels of employment or job vacancies and employees leaving the organisation.
Researchers have established a link between employee turnover and their intentions to quit. Mobley et al (1979) believed that employees’ intention to quite, has greater influence over employee turnover than job satisfaction.
Rosse and Miller (1984) developed a basic model that proposed that there are certain behaviour families that lead to dissatisfaction of employees at work. Rosse and Hulin (1985) concluded with the findings that dissatisfied employees who did not choose an adaptive response to dissatisfaction experienced mental and health illnesses compared to those who successfully adapted.
According to studies made, it has been found that the main reason behind job withdrawal is job satisfaction, which is defined as “a pleasurable feeling that results from the perception that one’s job fulfils or allows for the fulfilment of one’s important job values.” (Hollenbeck & Wright 2003: 430). There are three aspects that are related to job satisfaction, which are values, perception, and importance. Employees are satisfied when they find or perceive that their actual job specifications are congruent with their value system.
Employees express dissatisfaction with their jobs when organisations experience job withdrawal with their employees. Job withdrawal is “a set of behaviours that enact to avoid the work situation.” (Hollenbeck & Wright 2003: 427).
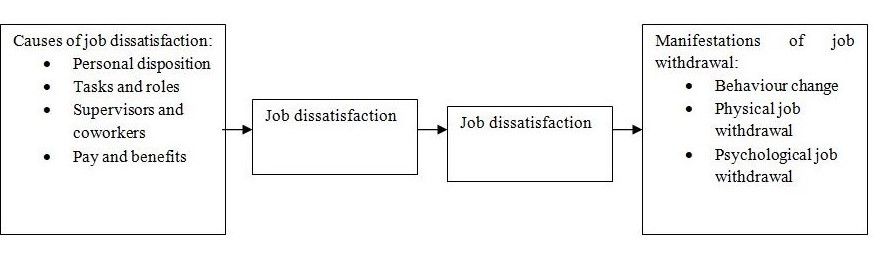
Figure 1 describes the different forms of job withdrawal (Hollenbeck & Wright 2003) show that there are two types of job withdrawal – physical job withdrawal and psychological job withdrawal. An example of physical withdrawal is being absent. Another type of job withdrawal is psychological withdrawal, which means, when employees cannot physically withdraw themselves from their jobs for some reason, they would attend physically; however, they would be absent minded, in other words, their minds would be somewhere else. Low level of organisational commitment is also considered a form of withdrawal (Hollenbeck & Wright 2003). Research has shown that employees who have a low level of commitment are waiting to grasp an opportunity to leave the organisation for a better job (Blau & Boal 1987). Therefore, it is very difficult to motivate employees with los job involvement, which negatively affects job satisfaction. The theories related to job satisfaction are illustrated below.
Work Environment
Research carried out shows that satisfied employees attend work despite environmental constraints, which can be considered an excellent excuse not to come to work (Smith, 1977). Pelled and Xin (1999) suggested that negative moods lead to absenteeism rather than turnover. A meta-analysis by Irvine and Evans (1995) demonstrates that work environment is always not an accurate predictor of employees’ intention to quit.
Mitchell et al. (2001) has shown that high degree of job embeddedness results in higher degree of satisfaction of job among employees. In a work environment, which is less embedded in job communities’ individuals, will have a higher degree of intention to quit. Creating a positive work environment leads to a decrease in turnover, in other words, contributes to employee retention (Guthrie 2001). Outcomes, however, can be negative, when an employee is accused of poor work. (Thomson, 1999)
Career Development
Career development is one of the methods that lead to increase in job satisfaction as policies and procedures related to training and development are specifically designed to provide support in their job and help them to achieve and perform better. According to Arnold and Davey (1999) relation between career development and employee turnover has not been widely studied. They believe that as long-term career development, training, and interesting work are the main reasons for employees to join organizations.
Training is an integral part of career development. “Training and development is a key to attracting and retaining talented employees.” (Raymond 2008: 17) Martin (2003) explored the relationship between employee turnover and training. He found that organisations that provide continuous training programs to their employees experience lower rates of employee turnover.
Winterton (2004) asserted that training programs have resulted in changes experienced with the attitudes of employees. It is evident that attitude is significantly related to physical and mental withdrawal from an organisation and turnover.
Development refers to these four methods “that help employees perform effectively in their current or future job and company.” (Raymond 2008: 315) Development helps employees to gain experience in other positions in the organisation in order for them to be prepared to move to another job when required. Moreover, development helps employees to be prepared for changes that may occur, which can happen because of changes in the external conditions experienced by the organisation. A development plan for the career of the employees is important as this keeps them motivated, and their spirits up (Pearson 1966). Employee development is significant as it improves quality, meets the challenges faced by competitors, incorporates advancement in technology, and is very important for development of employees, especially those holding senior positions and those that are likely to become leaders. A study by Maurer (1985) of the job rotation in naval forces showed that a rotation of jobs of the navy personnel to shore jobs helped to keep them motivated and reduce attrition.
Management Style
Managing people and talent management have a significant effect on job satisfaction, retention, and employee turnover. It is very important for managers to manage their employees in order to prevent them from creating problems, which will affect them and the organisation. Many studies have revealed that the main problem experienced by organisations is due to human errors or wrong decisions made. In some cases, organisations sometimes experience employees who do not perform well, cause problems by spreading rumours, and who do not attend their jobs according to the official working hours by attending late or leaving early. (Thomson, 1999)
IDS (2004) suggest organisations that face a problem of increase in employee turnover should fully aim to communicate regularly with employees and motivate them. A study by Kim (2002) shows that organizations that employees perception of a participative management style for strategic planning, empowerment, and effective supervisory communication leads to job satisfaction.
Another study by Parnell and William (2003) of organizations of Egyptian origin shows that national culture has a strong impact on the behaviour of employees and the measures of their satisfaction. This has as stronger implication in case of management decision making. According to this study “the potential for conflict between employee and employer tends to positively associate with the degree of cultural diversity” (2003, p. 59) thus indicating that the expatriates in Egypt were facing greater degree of problem adjusting with the management style than the locals which led to their dissatisfaction.
Nature of Job
There is a significant relationship between the nature of a job experience and job satisfaction. This is considered one element that has an effect on job satisfaction. One of the methods that lead to increase in job satisfaction is that employees should be given power; in other words “given the discretion and the resources to make decisions in the workplace themselves.” (Grugulis 2007: 124)
Jobs that are considered boring and monotonous do not challenge employees leading to dissatisfaction. According to previous studies, it has been shown that such jobs have a negative effect on females more than males. For example, a recent study has been carried out on thirty-two manufacturing plants. It shows that monotonous jobs affect females more than males, as the rate of absenteeism was three times higher with females than males.
Another element that influences job satisfaction is the degree in which physical strain is associated with a job. Advancement in technology has made some jobs less demanding. Finally, the third element that affects job satisfaction is the value of the work to the employees.
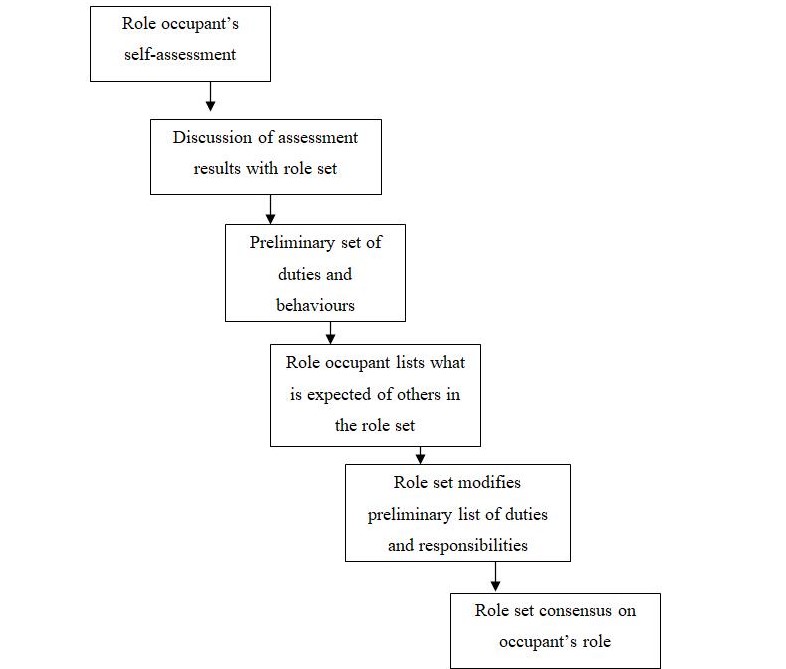
Studies have shown that the role of employees have an effect on job satisfaction as well, like role ambiguity, role conflict and role overload. Role ambiguity means an employee feels that he/she is uncertain about what is expected from him/her. Role conflict implies that the employee holds more than one role, which causes confusion due to different expectations. Role overload can result in job dissatisfaction due to excessive workload.. A survey carried out by Hollenbeck and Wright (2003) shows that 46% of American employees experience long working hours. According to Peter Warr (1992), stress at work or work overload can lead to a decrease in the productivity of employees. Moreover, if an employee is absent from illness related to stress at work, the organisation ends up paying for the employee’s medical expenses. (Thomson, 1999).
In order to eliminate such problems, role analysis technique has been designed to increase communication and understand the expectations of the employees. The role analysis technique is defined as “a method that enables a role occupant and other members of the role occupant’s role set to specify and examine their expectations for the role occupant” (Hollenbeck & Wright (2003:437). The employees list their expectations. Everybody then meets to discuss what is expected from each employee so that anything that is unclear is removed and conflicts are identified and resolved. This results in the development of balanced roles as requirements and expectations are clear among employees.
Compensation
It has also been found that there is a significant relationship between compensation (pay levels, pay raises, pay structure, and benefits) and job satisfaction. Pay level is the amount of income associated with a given job. Employees often leave the organisation as they find jobs with better pay elsewhere.
Benefits are also considered another aspect that can lead to job satisfaction. In addition, satisfaction with how pay is structured in an organisation deals with how an employee is satisfied with the rank of pay according to different jobs. For example, an employee can be satisfied with the salary; however, due to sales commissions, a colleague ends up having most of it. Organisations should also take into account pay raises. Employees expect that salaries be increased over certain period; if this is not met, however, they are dissatisfied.
Griffeth et al (2000) found out that salaries have an impact on employee turnover. They showed the relation between pay, performance, and turnover. They concluded that employees would leave the firm if they experience an insufficient reward system. Rewards can be tangible and/or intangible. Tangible rewards are financial rewards such as bonuses, salaries etc. Whereas, intangible rewards are in the form of additional benefits such as healthcare, holidays, company car etc (Thomson, 1999).
Co-Worker Relationships
Turnover and its relation with employee attitude have been studied in the literature (Zimmerman 2008). Personality trait of the employee affects his turnover intentions and behaviour. According to Zimmerman low emotional stability, best predicted employees’ intention to quit and conscientiousness and agreeableness led to the actual turnover decision. According to this study the relation between job complexity and job satisfaction and performance are not as strong as previously believed.
When employees work with each other, understanding them is not only enough, but it is important for the behaviour of employees to be adjusted, which becomes accepted by others rather than just satisfying themselves.
Employee relationship can be enhanced by forming groups. A group is defined as “a collection of two or more people who possess a common purpose.”
Groups are classified into two types – primary and secondary group. A primary group consists of a large number of members who are in contact face to face; whereas, secondary groups consist of large members, where the relationship with each other is less personal and there exists a lack of immediate contact between employees.
An employee gains the following benefits from being a member in a group:
- Satisfaction of social needs
- Gaining shared experience
- Mutual support
- Self-expression, as the security provided by groups encourages employees to be creative.
The following are the conditions that would lead to the form action of a cohesive working group:
- Employees must be close enough for face-to-face contact to be established.
- Work done must be related.
- Individuals must be compatible with similar social status, skill, or education.
- The total number should not exceed twelve.
- An external threat often causes a collection of employees to form a group.
Organisations sometimes are faced with employees resistant to change. “The group tends to resist change imposed on it, and will react slowly because of the threat to its existence, its security, its customs and its pattern of relationships.”
The following are some ways to overcome resistance to change and for a positive co-work relationship to be established:
- Respect differences of others by respecting their opinions, feelings, and values.
- Think positive and be optimistic.
- Acknowledge co-workers by communicating with each other on a regular basis.
- Listen to others and acknowledge what is being said.
- Show appreciation and provide support for the job done daily.
- Respect other people’s schedules and priorities.
- If mistakes occur, one has to be honest and apologise if necessary.
Promotion
One of the ways to measure job satisfaction is when the organisation provides good promotional opportunities to employees. It is very significant for an organisation to consider the efforts of employees and reward them effectively.
“A promotion is a move of an employee to a job within the company which has greater importance and, usually, higher pay.” When an employee is promoted, he/she gets higher status and carries better benefits. There are two ways in which employees are promoted:
- By management decision: An employee is selected for promotion based on information available with the management.
- By internal advertisement: Employees are informed that a post is vacant, for whomever interested in applying.
Employees are usually satisfied with a company policy of promotion. However, promotions that are not handled properly can cause dissatisfaction. The following are the most significant points:
- The criteria for promotion must be fair, taking into account the ability and experience of the employee as well as the length of service.
- The method, in which promotions take place, must be fair.
- Selection for promotion must be based on appraisals by past as well as present managers.
- The salary offered to the promoted employee must be based on what the job deserves and not what the management thinks the salary the employee would accept.
- Candidates not chosen for promotion must be treated sympathetically.
- There must be no discrimination. All employees must be treated fairly.
Retention Strategies
As mentioned earlier, job satisfaction is crucial to retain employees. The following are strategies developed to increase job satisfaction:
- Set new challenges in the job carried out such as:
- Improve job skills
- Develop a project to work on
- Mentor a co-worker
- Beat the boredom such as:
- Break up the monotony
- Cross-training
- Volunteer for something different
- Stay positive
- Stop negative thoughts
- Put things in perspective
- Look for the silver lining
- Learn from mistakes
- Be grateful
In addition, strategies have been developed to solve the problem of employee turnover, hence, to increase job satisfaction.
According to Nancy Glube, Regional HR Director of BellSouth Mobility in Boca Raton, Florida, the following are five key retention strategies:
- Employee Relations
- Compensation
- Benefits
- Work scheduling
- Workplace Enhancements
Another strategy to retain employees is to keep them motivated. It is very important to keep employees motivated. This would lead to increase in job satisfaction and decrease in the rate of turnover. Abraham Maslow noted in his theory related to human motivation, which is Maslow’s Hierarchy of Needs, which states that there are different needs that need to be addressed to motivate an individual. Motivation at work is a very important factor that leads to decrease in employee turnover.
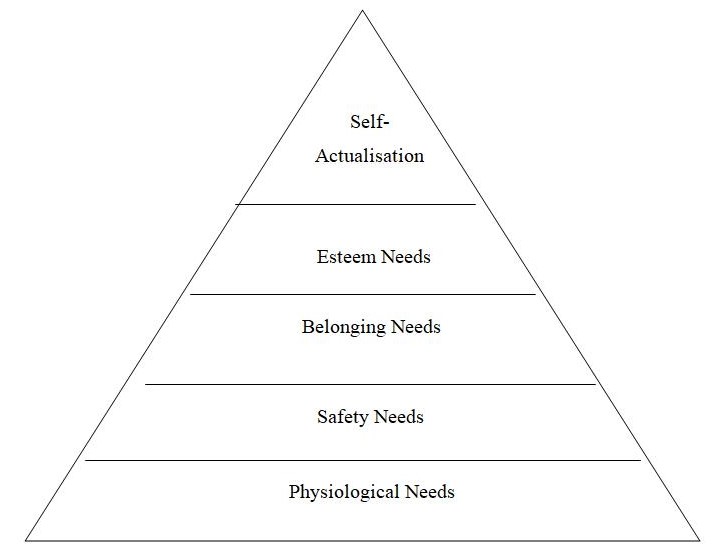
According to Maslow (figure 3), there are five different levels of needs that motivate an individual. Each lower human need is met before moving to the next higher need. The first needs are physiological needs, which are basic and most important needs such as food, water, sleep etc. Safety needs where an individual is kept out of danger in a safe environment. The next higher level is belonging needs where an individual needs to feel a sense of belonging. The next higher level is esteem needs where an individual requires to be respected by other people. Finally, the last need is self-actualisation needs where an individual wants to be where he/she wants to be, which leaves him/her fulfilled.
One of the ways to increase job satisfaction is job enrichment, which is “specific ways to add complexity and meaningfulness to a person’s work.” (Hollenbeck & Wright 2003: 434) For example, at Xerox, the structure of work is divided into large functional units, which are manufacturing, research, marketing, and finance. This has given the job more meaning. Another way to increase job satisfaction is job rotation, which results to have a more flexible workforce. Job rotation is defined as “a process of systematically moving a single individual from one job to another over the course of time.” (Hollenbeck & Wright 2003: 434).
Many organisations measure job satisfaction using self-reports. This an excellent method used by organisations to measure the level of satisfaction of their employees “There is a vast amount of data on the reliability and validity of many existing scales as well as a wealth of data from companies that have used these scales, allowing for comparisons across firms.” (Hollenbeck & Wright 2003: 439).
A very common measure of job satisfaction is Job Descriptive Index (JDI), which can measure satisfaction with pay, the job itself, supervision, co-worker relationships, and promotions. The JDI, however, does not focus on the dimensions of each; for example, it examines how the employees are satisfied with pay and not pay levels. However, the Pay Satisfaction Questionnaire (PSQ) gives a more detailed explanation about what the employees sees as more or less satisfying.
Despite how many measures are used to measure job satisfaction, an on-going program of employee survey research should be part of human resource strategy, as it allows the firm to keep an eye on trends, and overcome problems that might happen before the organisation experiences employee turnover. Moreover, yearly surveys “give employees a constructive outlet for voicing their concerns and frustrations.” (Hollenbeck & Wright 2003: 444). Employees who have the opportunity to express their problems have higher job satisfaction. For example, nurses revealed that providing such surveys enhanced work attitudes and reduced the rate of turnover.
Retention is an issue that involves customers as well as employees. For example, the average period sales agents remain at State Farm Insurance are eighteen to twenty years, two to three times the average tenure in the same industry. This results in sales agents learning the job and enhances their relationships with customers. State Farm also conducts surveys with the sales agents to find out where customer satisfaction is high, where it is low, and how service can be improved. As a result, 40 percent higher sales are achieved with State Farm in comparison to competition. Furthermore, the rate of retention among State Farm customers is higher than 95 percent.
It is very important that organisations that conduct surveys act on results. For instance, at Doctor’s Hospital in Manteca, California, a survey of opinions of employees showed dissatisfaction in many areas. The results were then given back to employees, with an action plan to address each of the problems encountered. An example in the area of career development, the survey revealed that even though the hospital reimbursed 100 percent of education expenses, it did so in the end of the semester, which did not give the employees the opportunity to utilise this benefit. This helped the organisation overcome this problem by paying employees’ tuition fees in advance. As a result, a source of dissatisfaction has become a source of satisfaction.
Another retention policy organisations should focus on is conducting exit interviews and acting on results. If handled properly, exit interviews “reveal the reasons why people are leaving, and perhaps even set the stage for their later return.” (Hollenbeck & Wright 2003: 445).
It is the role of the Human Resource Department (HRD) to develop strategies to increase job satisfaction, leading to retention of employees, as the function of HRD is described as “training and development, the field of motivation and reward, and the whole question of career management, recruitment, and assessment.” (Gibb 2002: 52).
Research Methodology
Data
The data for the study has been collected from secondary and primary sources. The sources of secondary data are books, journals, websites, etc. Primary data is collected by observation, interview and questionnaire survey.
Primary data analysis involves both qualitative and quantitative research. The main objective of quantitative research is to develop mathematical models and theories. Quantitative research is carried out using scientific methods. Once the required data is collected, the next step is to develop the right sampling method as well as collection of data using questionnaires (Craig, S. & Douglas, S, 228). However, quality research aims to understand human behaviour in-depth and the reasons that facilitate different aspects of behaviour.
The primarily data analysis will used to better understand the factors which will reduce the rate of employee turnover in the organisations and answer the research questions. The following are the steps required to design and administer the questionnaire:
- Defining the objective of the survey
- Determining the sampling group
- Writing the questionnaire
- Administering the questionnaire
- Interpreting the results
Defining the Objective of the Survey
A questionnaire that is prepared without a well-defined or clear purpose or goal is considered meaningless. The objective of the survey is to find out what factors have an impact on the rate of employee turnover in government organisations and how they affect job satisfaction.
Determining the Sample Group
Questionnaires will be circulated by e-mail to employees in four companies in different sectors. The four companies chosen are listed in Dubai International Financial Exchange (DIFX) Dubai Financial Market (DFM) and Abu Dhabi Stock Exchange. First ten companies from various sectors are chosen. All ten were contacted. However, responses are received from four companies only, which restricted our sample size to 167, which can be broken down into the following:
- 45 employees from the investment company
- 42 employees from the telecommunications company
- 30 employees from the petroleum company
- 50 companies from the real estate company
Employees will be chosen according to simple random sampling. This form of sampling helps to get effective results as it allows selecting a sample portion without focusing on specific criteria. As the sample size is not large, it is important to obtain a high rate of response in order for the findings to be considered acceptable and valid. (Saunders, M. & Thornhill, A., 2007) Hence, if necessary, a follow-up will be carried out by telephone two weeks after the questionnaire is circulated.
Writing the Questionnaire
The responses to the questionnaire are taken in a 5-point Likert scale. The choices were strongly agree, agree, neither, disagree, and strongly disagree.
The measures used to measure job satisfaction are work environment, career development, management style, job description / responsibilities, compensation, work environment and co-worker relationships.
There are three questions related to work environment, career development, and Job Description / Responsibilities each, five for management style, four for compensation and two for promotion and co-worker relationship.
A pilot survey is conducted to see the applicability of the questionnaire. In addition, the questions are grouped according to the different areas of measure. There is also a good combination of questions to avoid boredom.
In addition to questionnaires distributed to employees, a HR questionnaire is conducted with a Human Resources representative at each of the companies. The objective of the questionnaire is to obtain more information related to employee turnover experienced.
The types of questionnaires used are qualitative questionnaires. The objective of the qualitative method is to access the world in terms of those people being reached (Burton, 2000). A questionnaire is the most widely used survey instrument. Therefore, a questionnaire given to employees is made up of multiple-choice answers to allow easy completion, which results in a high rate of response. This results in good measure of reliability and validity of data. The other Human Resources interview is to be conducted with a senior representative in the Human Resources Department. These respondents will have the ability to express their opinions and provide more information.
Fowler (1993) argues, “…determining a question for a survey instrument is designing a measure not a controversial inquiry. Good questionnaires maximise the relationship between the answers recorded and what the researcher is trying to measure.” If questionnaires are carefully designed, it provides important insight into human behaviour (Burton, 2000).
The questionnaire, which has been addressed in the questionnaire keeping in mind the various measures of attrition, is provided as follows:
1. Work environment
- Are employees satisfied with the work environment?
- Is an active social structure implemented in the organisation?
- Are employees satisfied with the company’s working hours?
2. Career Development
- Are employees satisfied with training programs offered?
- Does the organisation provide support to employees for further education or certification?
- Is a clear career development plan given to employees?
3. Management Style
- Is there good communication between employees and management?
- Does management keep employees involved and updated with their decisions?
- Are managers qualified for their positions?
- Do employees learn from the management?
- Are employees treated fairly by their supervisors and top management?
4. Job Description / Responsibilities
- Are goals and targets clear?
- Are employees involved in the decision-making process?
- Are employees given significant responsibilities?
5. Compensation
- Are employees satisfied with their salaries? Are they paid fair salaries according to the market place?
- Are salaries of employees similar to their colleagues who are in the same position?
- Are employees compensated for working overtime?
- Is there a fair reward scheme implemented?
6. Promotions
- Is there a fair reward scheme implemented?
- Are promotions given fairly?
7. Co-Worker Relationships
- Do employees have good relationships with their colleagues?
- Do employees have good communication with their colleagues?
Hypotheses
The literature review clearly demonstrated that the prevailing literature has provided a clear indication towards the reasons that were thought to be the main causes of employee turnover. The following hypotheses are formed and an experiment will be carried out to help prove or disprove the hypotheses, once the data is analysed. There are seven hypotheses based on which the questionnaire is built on. Null hypothesis is presented as H0 and Alternative hypothesis as HA.
Job Satisfaction
H0: No relationship of statistical evidence between job satisfaction and employee turnover.
HA: There exists a relationship of statistical evidence between job satisfaction and employee turnover.
1) Work Environment
H0: No relationship of statistical evidence between job satisfaction and work environment.
HA: There exists a relationship of statistical evidence between job satisfaction and work environment.
2) Career Development
H0: No relationship of statistical evidence between job satisfaction and career development.
HA: There exists a relationship of statistical evidence between job satisfaction and career development.
3) Management Style
H0: No relationship of statistical evidence between job satisfaction and management style.
HA: There exists a relationship of statistical evidence between job satisfaction and management style.
4) Job Description/ Responsibilities
H0: No relationship of statistical evidence between job satisfaction and the job itself.
HA: There exists a relationship of statistical evidence between job satisfaction and the job itself.
5) Compensation
H0: No relationship of statistical evidence between job satisfaction and compensation.
HA: There exists a relationship of statistical evidence between job satisfaction and compensation.
6) Promotion
H0: No relationship of statistical evidence between job satisfaction and promotion
HA: There exists a relationship of statistical evidence between job satisfaction and promotion.
7) Co-Worker Relationships
H0: No relationship of statistical evidence between job satisfaction and co-worker relationships.
HA: There exists a relationship of statistical evidence between job satisfaction and co-worker relationships.
Research Model
The following is the research model:
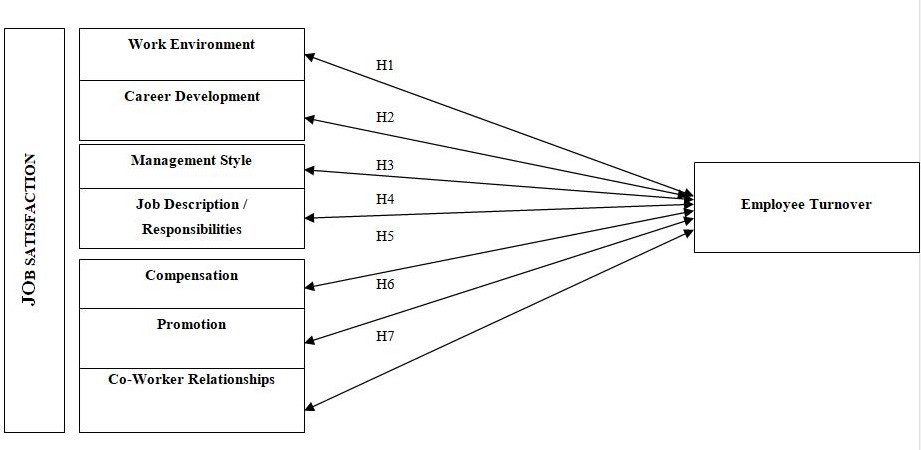
The questionnaire is focused on the following main seven areas to measures job satisfaction:
- Work Environment
- Career Development
- Management Style
- Job Description/ Responsibilities
- Compensation
- Promotion
- Co-Worker Relationships
The objective of the questionnaire is to find out the reasons for employees leaving the organisation; hence to develop strategies to improve retention in the workplace. In addition to questionnaires distributed to employees, a HR questionnaire will be conducted with a Human Resources representative at each of the companies. The objective of the questionnaire is to obtain more information related to employee turnover experienced.
Results
This chapter analyses the primary data gathered from the questionnaires carried out by a sample size of 167 employees in four government companies operating in a variety of sectors.
The first section analyses a breakdown of the characteristics of the demographic traits of the sample group chosen. The second section shows the frequency distribution or the breakdown of the results, followed by a section that describes the descriptive statistics. Finally yet importantly, the last section describes the hypotheses testing for data analysis and findings.
Sample Description
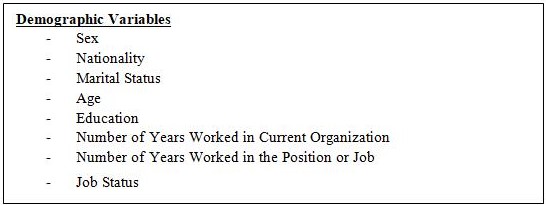
Tables 1 to 7 demonstrate the sample description such as gender, nationality, marital status, age, level of education, and number of years in current organisation, number of years in the same position or job and job status.
Table 1 illustrates the breakdown of gender comprising majority of males. The table shows that 65.3 percent of the respondents were male and 34.7 percent were female. In absolute terms out of 167 respondents, 109 were male and 58 were female.
Table 1: Sample Description- Gender
Table 2 illustrates the breakdown of nationality comprising of majority of expatriates compared to UAE Nationals. Out of 167 individuals who sent back valid answers, 65 were nations of the UAE and 102 were expatriates. In percentage terms, 38.9 percent were from UAE and 61.1 percent were expatriates.
Table 2: Sample Description – Nationality
Table 3 illustrates the breakdown of marital status comprising majority of married employees. Table demonstrates that more that 60 percent of the respondents were married and rest were single.
Table 3: Sample Description – Marital Status
Table 4 illustrates the breakdown of the age of selected employees comprising majority of employees between the ages of 25-35. The data shows that most of the respondents are in the age group of 35-35 years, which comprised more than half of the total respondents. 34 percent of the employees fall in the age group of 36-46 years. The lowest number of respondents is from the age group of 17-57 years. In the age, group under 25 years, 7.8 percent of respondents fall.
Table 4: Sample Description – Age
Table 5 illustrates the breakdown of the level of education of the selected employees comprising majority of Graduates. More than 60 percent of the respondents are graduates, 1.8 percent is less than high school, 6.6 percent high school educated, 18.6 percent high diploma, and 15 percent with masters or above degree.
Table 5: Sample Description – Level of Education
Table 6 illustrates the breakdown of the number of years of employees having worked in current organisation, comprising of majority of employees having worked in the current organisation for 2-5 years. More than 32 percent of the respondents have less than 1 year of experience. Rest of the 13.8 percent and 9.6 percent comprised of experiences between 6-10 years and 11-19 years respectively.
Table 6: Sample Description – Number of Years in Current Organisation
Table 7 illustrates the breakdown of the job status of employees comprising majority of junior level. Most of the respondents are from the junior management level where the percentage of respondents is 56.3 percent. In the senior management level there are 24 percent of the respondents and 19.8 percent of the respondents are from senior management level.
Table 7: Sample Description – Job Status
Frequency Distribution
The answers to the three questions related to work environment of the employee are analysed in table 8, 9, and 10. The first question was related to the employees’ satisfaction vis-a-vis the work environment in the office. Table 8 shows that 75 percent of the respondents believe that they are satisfied with the work environment.
Table 8: Workenv1
The second question shown in table 9 is related to the implementation of active social structure in the organization. Most of the respondents feel there is an active social structure in place in the organization.
Table 9: workenv2
Table 10 reflects the employees’ comfortableness with the company’s working hours. Here too more than 83 percent of the employees say that they are happy with the working hours of the company.
Table 10: workenv3
The responses to the work environment related questions show that the employees expressed their satisfaction to their organizational environment. Previous research in the area has shown that work environment alone is not a very successful predictor of intention to quit (Irvine and Evans 1995; Pelled and Xin 1999) but a good work environment increases employee embeddedness and thus increases retention of the employee (Mitchell et al. 2001; Guthrie 2001).
According to Tables 11, 12, 13, and 14, there were different results related to career development. Majority of employees were satisfied with the training programs offered. Most of the employees were neutral with their answers as to if the organisation provides full support to them for further education as well as to if they are given a clear development plan. Majority of employees disagreed with the fact that they are offered job rotation during induction.
Table 11 demonstrates the answers given by the respondents for the question “I am satisfied with training. Effective training programs are offered.” The answer to the question shows that more 68.9 percent of the employees believe that effective training is provided in the organization. Percentages of employees who feel that neither agree nor disagree are 19.2 percent. Moreover, the rest 12 percent of the employees feel that they do not have adequate training opportunity. As training is considered to a vital need to enhance employee job satisfaction, it is an important retention tool (Arnold & Davey 1999).
Table 11: Careerdev1
Table 12 shows the response rate for the question “Organisation provides full support to me for further education or certification that will enhance my career i.e. CFA, MBA etc.” This question indicates the career development opportunities the employees receive in their organization for academic pursuit. Overall, the most of the respondents believed that they were given the opportunity to pursue their career goal with 22.2 percent employees responding Agree and 16.8 percent of the respondents stating Strongly Agree. However, 32.3 percent respondents did not agree (Strongly Disagree and Disagree) to the statement and felt they were not given the opportunity by their organization to pursue higher study.
Table 12: Careerdev2
The organizations have not given a career development plan to the employees. The statement, which was present in the questionnaire, was “I am given a clear development plan” to which 33 percent of the respondents, agreed, 36.5 percent neither agreed nor disagreed and 30.6 percent disagreed.
Table 13: Careerdev3
To the question, “I am offered job rotation during my induction”, mostly the respondents believed that they were not offered job rotation. 33 percent of the employees believed they received job rotation, while 24 percent believed that they were not sure. However, 42.5 percent of the respondents believed that they were not given job rotation opportunity. Moreover, 11.4 percent strongly disagreed and 31.1 disagreed to the statement.
Table 14: Careerdev4
From the above tables it is clear that career development in the organizations has not been properly in place. Even though employees were provided effective training which helped them to improve their job learning and development, they were neutral to the question if the organizations provided opportunity for higher education and career development plan. Further, the employees provided a negative answer to the question if they were offered job rotation. As career development is a vehicle for satisfying employees, according to the survey, government organizations were falling short of the career development measures. The only career development program operation to boost employee satisfaction as evident from the survey is training programs (Raymond 2008). Thus, this tool helps them to retain some talented employees (Martin 2003; Raymond 2008). Whereas the absence of a career development plan (Pearson 1966; Raymond 2008) and job rotation is alarming as they lead to dissatisfaction among employees (Maurer 1985).
According to Tables 15, 16, 17, 18, and 19 it is evident that majority of the employees are satisfied with the management style. Table 15 shows the response to the question “There is good communication between Management and myself”. The response shows that majority of the respondents i.e. 65.3 percent of the employees believe that there is a good communication channel between them and the management. A mere 12 percent disagree and 22.8 percent are unsure.
Table 15: Mgtstyle1
Table 16 shows the responses to the statement “Management keeps me involved and updated with their decisions” which measures the level of participation of the employees in strategic decision-making process. The response shows that 48.5 percent of the respondents believe they are part of the strategic decision-making process and are aware of the management decisions, 28.1 percent are unsure, and 23.4 percent feel they are not part of the decision making process.
Table 16: Mgtstyle2
Table 17 answers the question “I feel the Management are qualified for their positions and perform their jobs well”. Most of the employees (61 percent) agree to the statement, 23.4 percent were unsure, and 15.6 percent disagreed.
Table 17: MGTSTYLE3
Table 18 provides the analysis to the question “I learn a lot from the Management”. To which 56.9 respondents believe that they have learnt from the management, 28.7 are unsure, and 14.4 percent disagree.
Table 18: Mgtstyle4
Table 19 shows the response to the question “I am fairly treated by my Supervisor and the Top Management”. The responses show that 63.3 percent of the employees believe that they are fairly rerated by the top management indicating a high perception of fairness in the organizations. The percentage of the respondents who are not sure is 18.6 percent and 18 percent of the respondents disagree to it.
Table 19: Mgtstyle5
From the analysis, it is clear that management style is not a source of dissatisfaction of employees. Most of the employees feel that they are aware of the management decision and the perception of participatory management is high. The survey reveals that, as employees are satisfied with management style, thus are not dissatisfied with this measure of turnover, indicating negative perception of management style is not a deterring factor for employee turnover. This view has been supported through previous research of Thomson (1999), Kim (2002), Parnell and William (2003), and IDS (2004).
According to Tables 20, 21, and 22 it is evident that majority of the employees are satisfied with the description of their job. Table 20 shows the responses to the question “Goals and targets are clear”. The table shows that 67 percent of the respondents believe that the goals are clear, while 15 percent do not agree or disagree, and 17.4 percent disagree with the statement. This indicates that most of the employees who participated in the survey feel that there is no role ambiguity.
Table 20: jobdesc1
Table 21 shows the responses to the question “I am involved in the decision-making process”. The responses show that the employees mostly agree (60.5 percent) that they are involved in the decision making process. While 24 percent, feel they are not sure and 15.6 percent believe that they are not.
Table 21: jobdesc2
Table 22 provides the responses for the question “I feel challenged as I am given significant responsibilities”. The table shows that most of the respondents (69.4 percent) feel that their job is challenging, while 10.8 percent respondents disagree.
Table 22: jobdesc3
The analysis shows that the employees feel that their job is enriched and challenging. They feel that they take part in decision-making process and have clear targets and goals.
According to Tables 23, 24, and 25 most of the employees agreed to the fact that they are satisfied with their salaries. Majority of the employees were neutral with their answers as to if their salaries are similar to their colleagues of the same position and if they are compensated for working overtime. Table 23 shows that 48.5 percent of the respondents are satisfied with their salary and feel are fairly paid, 17.4 percent of the respondents are unsure, and 34.2 percent of the employees feel they are not.
Table 23: Comp1
Table 24 shows the response to the question “My salary is similar to my colleagues in the same position”. Responses to this question states that 27 percent of the respondents agree to it, 35.3 percent are unsure, and 37.7 percent disagree. Thus, there is a perception of non-equity of pay.
Table 24: Comp2
Table 25 states that the responses to question “I am compensated for working overtime” shows that 48.5 percent of the employees are not compensated for their overtimes, 20.3 are unsure, while 22.2 percent feel they are compensated.
Table 25: Comp3
The questions related to the compensation mostly show that employees are satisfied with their pay, but feel equity of pay is not existent. Most of the respondents perceive that are not compensated for their overtime work, which may lead to dissatisfaction (Griffeth et al. 2000).
According to Tables 26 and 27, majority of the respondents agreed to fact that fair reward scheme is implemented in the organisation. They were neutral with their answers whether promotions are fairly given or not. Table 26 shows that the responses to the question “There is a fair reward scheme implemented in the organisation, which takes into account promotions and increase in salaries”, 44.3 percent of the respondents feel that the promotion process is fair, while 33 percent feel they are unsure, and 22.2 percent feel it is not.
Table 26: Promo1
Table 27 shows there responses for the question “Promotions are given fairly”. The responses show that 40 percent of the respondents feel it is, 39.5 percent are unsure, and 20.4 percent disagree.
Table 27: Promo2
According to Tables 28 and 29, most of the answers revealed that employees agreed to the fact that they have good relationship with their co-workers. Table 28 measures the responses to the question “I have good relationships with my colleagues/ staff”. The responses show that 95.6 percent of the respondents feel that they have good relation with heir peers.
Table 28: Coworkerrel1
To the question, “I have very good communication with my colleagues, where we update each other regularly”, 91.6 percent of the respondents have stated that they agree to the question (see table 29).
Table 29: Coworkerrel2
According to Tables 30, majority of the employees (34 percent) have changed their jobs once in the last ten years. Moreover, the 29 percent of the employees have not changed their jobs in the last 10 years indicating that they are happy with their job and company.
Table 30: TURN1
According to Table 31, most of the employees (50 percent) have strongly agreed that they are considering leaving the organisation in the short-term, indicating a high degree of intention to quit.
Table 31: Turn2
According to Table 32, results reveal that if employees are to leave the organisation, 30.5 percent of the employees feel that the main reason they would is for higher salaries and 27.5 percent feel it would be for better job position. The other reasons would be long-term benefits (19.2 percent), better image and reputation worldwide (13.8 percent), and different job responsibilities (9 percent).
Table 32: Turn3
Descriptive Statistics
Table 33: Descriptive satistics
Table 33 shows that the responses to the questions were quantified as 1 for strongly disagree which is the minimum and 5 for strongly disagree which is the maximum for 167 responses. The mean of all the responses range from 3 to 4 with exception being for Careerdev4, Comp2, Comp3, Turn1, and Turn3 shows that the responses vary below 3 indicating average disagreement with the responses. This indicates that average number of responses disagree to the above-mentioned questions. However, the standard deviation for the questions are higher than 1 indicating a widely dispersed responses among all the options indicating that not all responses were close to the mean score. For mean scores higher than 4, which is found for Coworkerrel1, Coworkerrel2, and Workenv3 shows that the standard deviations are lower than 1 indicating a lower degree of dispersion from the mean score indicating all the answers are close to the mean score. Even for responses with mean score ranging from 3 to 4, the standard deviations are greater than 1 indicating a widely dispersed response rate.
Turnover Analysis
The correlation analysis in table 34 shows that age of employee’s age is positively correlated with work environment and it provides a statistically significant result at the significance level of 0.05. This indicates that higher the age, the need for a better work environment at office is desired by employees, which increases their satisfaction. Similarly, the correlation between age and compensation shows a positive relation, which is statistically significant at 0.05. This too indicates that employees’ in higher age bracket like to have higher compensation. Therefore, at higher age bracket the motivating factors leading to job satisfaction are better work environment and compensation. Age has a negative relation with career development, job description, and co-worker relation indicating that young employees like to have better career development options, with a clear career path. They like to have cordial co-worker relationship and have a clear job description. Turnover intention is higher among younger employees than among older employees.
Education of employees when correlated with job satisfaction measures yield a negative relation with work environment, career development, job description and co-worker relation. The relation with work environment is statistically significant at 0.01. This indicates that higher the education, employees lay less concern on work environment. This can be explained thorough Maslow’s need gratification theory. As employees, attain higher education their needs for security and societal symbol reduces, thus reducing their need for better work environment, career development, job description and co-worker relations. Further, it should be noted that higher the education of the employees, higher is their propensity to quit.
When number of tears employees have spent in organizations is correlated to the measures of job satisfaction and turnover intention it is found that the former is negatively related to work environment, career development, management style, compensation, promotion and turnover intention. This shows that when the number of years an employee has spent in an organization is higher, his concerns over work environment, career development, management style, compensation, and promotion is lower and his intention to quit is lower. However, higher number of years in organization, greater is his need for better job descriptions and co-worker relations. In this category, the significant correlation is number of years in organization and compensation, which has a negative relation indicating higher the number of years an employee stays in an organization, compensation, seizes to become the factor for job satisfaction. But when an employee has been with the company for a short time, compensation plays a very important role to enhance job satisfaction.
Table 34: Correlations
Correlation between job statuses with the measures provides significant correlation with work environment, career development, and co-worker relations. The analysis shows that job status has a positive relation with work environment, which implies when employees are in junior level of management, they value work environment more than when they are in managerial or above position. This finding is similar to our finding with age of employees. Older employees are in more senior positions in the organization and as older employees have less importance on work environment it explains the present preference for employees in junior level management positions for better work environment as they are younger. At junior levels, the employees will be satisfied with a detailed career path. However, at junior levels, the importance of co-worker relations is less and the intention to quit is higher. This result is similar to the findings of Pearson (1966).
Hypotheses Testing
Table 34 shows correlation analysis of the measures, which are work environment, career development, job description, compensation, promotion, co-worker relation and turnover intention. The underlying assumptions, which have been taken for correlations in table 34, are interpreted, assuming the following:
- -1.0 to -0.7 strong negative association
- -0.7 to -0.3 weak negative association
- -0.3 to +0.3 little or no association
- +0.3 to +0.7 weak positive association
- +0.7 to +1.0 strong positive association
Apart from this, it is assumed that job dissatisfaction is the key cause for turnover intention. Therefore, whenever one has a statistically significant intention to quit, it implies he is dissatisfied with his job and vice versa (Hellman 1997).
Given these assumptions, it is observed that intention to turnover has a negative correlation with work environment, management style, job description, compensation, and co-worker relation. However, all correlation coefficients fall within -0.7 to -0.3 range indicating that these measures have little or no association on turnover intention. Therefore, according to the survey a slightly bad work environment, non-participative management style, non-challenging job, low compensation, or bad co-worker relation will have little or no effect on turnover intention of the employees.
Hypothesis 1
Work environment and turnover intentions have a correlation of -0.1, which too has a statically insignificant relation between the two. Therefore, we cannot ascertain any relation between job satisfaction and work environment. Further considering the p value for a significance level of 0.01 is 0.17. The p value for work environment and career development, management style, promotion, and co-worker relation are 0.00 (first three) and 0.008 (<0.01) significance level, indicating that they are statistically significant. Their Pearson’s r is 0.4, 0.39, 0.27 and 0.041 indicating a weak positive relationship. Therefore, with betterment of work environment, there is more positive career development, management style, promotion, and co-worker relation. As there arises a significant increase in other variables this indicates that job, satisfaction is increased, thus showing that work environment has a positive effect on increasing job satisfaction by a statistically significant level. Therefore, we can accept the hypothesis.
Hypothesis 2
Career development and turnover intention has a correlation of 0.032 indicating that there is no association, but the p value is 0.68 indicating that it is greater than 0.01, implying that the statistical result is statistically significant. Therefore, we accept the null hypothesis. Further the p values for career development and work environment, management style, promotion, job description, compensation and promotion are all less than 0.01 indicating all these correlations are statistically significant. As all these variables have a positive relationship with career development indicating that a positive increase in career development will lead to a positive increase in the others is significant. Further, in all the cases the correlation shows a weak relationship but statistically significant. This finding is similar to other researches like that of Pearson (1966), Maurer (1985), Martin (2003), Winterton (2004), and Raymond (2008).
Hypothesis 3
Management style is when correlated with turnover intention of employees yielded a correlation of -0.05, which predicts no association between the two. The p value is 0.686 which is higher than 0.01 indicating that the null hypothesis can be accepted implying that the hypothesis is statistically erroneous. This indicates that the relation between management style and turnover intention is statistically significant implying statically insignificant relation between management style and job satisfaction. Thus, job satisfaction of the employees is significantly related to management style. Similar result has been found in the study of Parnell and Crandall (2003) who stated that most of the literature on job satisfaction and employee turnover is based on organizations in Western countries. Their study, which was based in Egypt, showed that management style was expected to be authoritative and employees were satisfied with a non-participatory form of organization. This indicated that cultural difference mellowed down the affect of management style on job satisfaction and turnover intention. An extension to this argument could be to examine the issue of expatriate or foreign employees but the analysis is beyond the scope of this research. Thus, hypothesis 3 does not show statistically significant result. A positive increase in Management style too can lead a statistically significant positive increase in work environment, career development, promotion and compensation. For all these cases, management style has a p value lesser than 0.01 and Pearson’s r between +0.3 to +0.7 indicating a weak positive relationship. Thus, a better management style will lead to job satisfaction.
Hypothesis 4
The correlation between job description and turnover intention is -0.017, which has little or no significance on intention to quit. The p value for the relation is 0.83, which is much higher than.01 indicating that the statistical result is not significant. This indicates that employees are satisfied with their job responsibilities and authority, which leads to significant job satisfaction, thus insignificant turnover intention. As job dissatisfaction is the root cause of turnover intention (Winterton 2004) and relation between job description and turnover intention gives a negative but statistically insignificant relation to turnover intention, we can say that job description has a statistically significant relation with job satisfaction. This shows that the hypothesis 4 holds significant result in the analysis.
Table 35: correlation analysis
** Correlation is significant at the 0.01 level (2-tailed).
Hypothesis 5
Compensation increase will lead to a statistically significant positive increase in work environment, management style, career development, and promotion. This is so because the p values are all less than 0.01 for these variables indicating the statistical significance of the results and the Pearson’s r are positive and shows weak association. Thus, an increase in compensation will lead to a positive increase in work environment, management style, career development, and promotion. This finding is supported by the literature, which shows similar results (e.g. Thomson 1999; Griffeth et al 2000).
Hypothesis 6
The p values for promotion and other variables like career development, work environment, compensation are all less than 0.01 except for management style, job description, and turnover intention. This shows a Pearson’s r of 0.3, which gives a weak positive relation between the two. The relation with turnover intention gives a positive correlation and a p value greater than 0.05 indicating a statistically insignificant result. Thus, it can be said that increase in promotion will lead to a significant increase in job satisfaction. Thus, the hypothesis is validated.
Hypothesis 7
Most of the respondents reported that they have a good relation with their peers with a mean score for two questions to be 4.25 and 4.35 with standard deviation below 1. The p value is 0.9 (> 0.01) thus, indicating statistically not significant result. This indicates that they were happy with their co-worker relation. A correlation analysis between co-worker worker relations and turnover intention is insignificant indicating that they were satisfied with their job due to healthy relation with peers. As co-worker relation is higher, there is a greater degree of organizational citizenship among employees leading to job satisfaction. This does not supports hypothesis 7, as there is a significant relation between good co-worker relation and job satisfaction of employees.
This result for correlation for compensation and turnover intention in our research validates findings from previous researches (e.g. Griffeth et al 2000) which believed that a perception of low reward would lead to turnover. In case of the UAE firms, employees perceive their compensation and reward to be fair which should lead to low turnover intention.
The relation between turnover intention and the other variables shows that the Pearson’s correlation fall in the zone of no association. The p values too are greater than.05 indicating no statistically significant relationship. Thus, it can be stated that not all the variables, which has been considered as a measure of, job satisfaction viz. work environment, career development, management style, promotion, job description, and compensation have a statistically impact on turnover intention.
Recommendation
The above analysis shows that the measures that leads to job satisfaction in the UAE organizations and thus prevents turnover are as follows:
- Work environment
- Career development
- Management style
- Promotion
- Compensation
These will lead to greater job satisfaction and thus help in retention of the employees. This shows that the retention strategies that should be employed by the organizations are to improve the working environment of the organizations, introduce career development, make management style more participative, promotions must be fair, fair and equitable compensation, and enrichment of the job of the employees. This will increase job satisfaction of the employees and increase retention of employees by reducing turnover. From Maslow’s hierarchies of need it can be found that compensation gratifies the employee’s physiological need, co-worker relation gratifies social needs, Job enrichment and autonomy due to a more participative management style gratifies esteem or psychological need, and promotion and career development gratifies self-actualization needs. Therefore, these measures will lead to job satisfaction when improved significantly. The study shows that the main areas, which need to be improved for retaining employees, are work environment, career development, promotion, and compensation.
Limitation
- Expatriate employees find it difficult to adjust with the new culture and management style. This leads to their dissatisfaction and thus high turnover. This aspect of the study has not been dwelled upon in this research and has serious implications for further research.
- The study did not correlate the relation between demographic variables and the measures of job satisfaction in order to ascertain which demographic variable could be influenced by which measure. This would have provided a more direct understanding of retention strategies to be undertaken.
- The study did not yield any significant relation between turnover intention and other measures. Therefore, assuming it is not job satisfaction related measures, which affect an employees’ intention to quit, other reasons need to be dwelled upon, like external factors like solicitation from other companies, perusing other companies, or higher education, etc.
Conclusion
Increasing incidence of employee turnover in organizations in UAE has been an area of concern for many. The reason for the increase in employee turnover and the retention strategies need to be understood to prevent further outflow of employees, which cause extensive cost to the employees. Therefore, this study undertook the task of ascertaining the measures, which would lead to job satisfaction of the employee, which will increase the possibility of retaining them. The study is based on a questionnaire survey, which was set to test the hypothesis. Correlation analysis was conducted to test the hypothesis.
The analysis showed that the main factors, which have influence over the employees in the UAE’s job satisfaction, are work environment, career development, promotion, and compensation. As these measures lead to the job satisfaction of the employees, it can be intuitively deduced that they help in retaining employees, as we assumed that satisfied employees have low intention to quit (Hellman 1997). Therefore, we deduce that when these factors are taken care of and increases job satisfaction, this will lead to retention of the employees.
Employees tend to leave organisations when they are not appreciated for the work they do. Other reasons include when employees feel that the organisation take care of them, when an organisation shows favouritism and when the firm does not get involved with problems caused by employees. Successful organisations develop appropriate strategies to solve the problem of high turnover experienced by motivating employees and increasing job satisfaction.
These will lead to greater job satisfaction and thus help in retention of the employees. This shows that the retention strategies that should be employed by the organizations are to improve the working environment of the organizations, introduce career development, make management style more participative, promotions must be fair, fair and equitable compensation, and enrichment of the job of the employees. This will increase job satisfaction of the employees and increase retention of employees by reducing turnover. From Maslow’s hierarchies of need it can be found that compensation gratifies the employee’s physiological need, co-worker relation gratifies social needs, Job enrichment and autonomy due to a more participative management style gratifies esteem or psychological need, and promotion and career development gratifies self-actualization needs. Therefore, these measures will lead to job satisfaction when improved significantly. The study shows that the main areas, which need to be improved for retaining employees, are work environment, career development, promotion, and compensation.
Appendices
Appendix 1.
Responsibilities of an Effective Leader
- Looks at the task and decides what his or her role is
- Acquires knowledge needed to carry out the task effectively
- Adequately briefs others in detail of what is required and what the limits of their authority are
- Considers the problems of others
- Delegates decisions and responsibility where possible
- Is fair and consistent
- Is prepared to accept criticism
- Helps others without Doing their Work for them
- Acts as a Resource Person
- Makes Decisions
- Understands how Leadership Operates in a Group Situation
- Is Aware of Individuals within a Group
Managerial Abilities for the Twenty-First Century
- Respond to and Manage Change
- Manage Cross-Functional Teams
- Take the Initiative
- Adhere to Corporate or Organisational Goals
- Understand the Operations of the Whole Organisation
- Empower Staff and Others to Develop their Skills
- Manage their Own Development as a Manager
- Maintain Motivation in their Staff
- Maintain their Own Motivation
Appendix 2
23. How many times have you changed your job in the last ten years?
a) Never
b) Once
c) Twice
d) Three times and more
24. Will you consider leaving the organisation in the short-term?
a) Strongly agree
b) Agree
c) Neither agree nor disagree
d) Disagree
e) Strongly Disagree
25. From your point of view, why would you consider leaving your current company?
a) Higher salaries
b) Better image and reputation worldwide
c) Different job responsibilities
d) Better job position
e) Long-term benefits
Appendix 3
The following are the companies listed on Dubai International Financial Exchange (DIFX):
- Damas
- DEPA Limited
- DP World
- Fortune Management Inc
Appendix 4
The following are the companies listed in Dubai Financial Market (DFM):
Banks
- Arab Emirates Investment Bank
- Amlak Finance
- Commercial Bank of Dubai
- Dubai Islamic Bank
- Emirates National Bank of Dubai
- Emirates Islamic Bank
- Gulf Finance House
- Mashreq Bank
- Tamweel
- Al Salam Bank
- Bank of Ajman
- Al Salam Sudan
Investment and Financial Services
- Alfirdous Holding PJSC
- Almadina for Finance and Investment
- Bayan Investment Company
- Dubai Financial Market
- Dubai Investments Company
- Global Investment House
- Gulf General Investment Company
- Gulf Petroleum Investment
- International Financial Advisors
- International Investment Group
- Salam International Investment
- SHUAA Capital
- Ekttitab Holding Company K.S.C.C
Insurance
- Alliance Insurance
- Dubai Islamic Insurance
- Arab Orient Insurance Company
- Arab Insurance Group
- A. Scandinavian Insurance
- Al Sagr Insurance Company
- Takaful House
- Dubai Insurance
- Dubai National Insurance & Re-Insurance
- Islamic Arab Ins.
- National General Insurance
- Oman Insurance Company
- Takaful Emarat
Real Estate & Construction
- Arab Heavy Industries
- Arabtec Holding P.J.S.C
- Dubai Development Company
- Deyaar Development PJSC
- Emaar Properties
- Grand Real Estate Projects Company (K.S.C.C)
- Al Mazaya Holding Company
- National Real Estate Company
- Kuwait Commercial Markets Complex Co.
- Union Properties
- Air Arabia PJSC
- ARAMEX
- Gulf Navigation Holdings
- Agility
Materials
- ACICO Industries Co. (K.S.C)
- National Cement Company
- National Industries Group Holdings
Consumer Staples
- Dubai Refreshments Company
- Gulfa Mineral Water & Processing Industries Co. PLC
- Jeema Mineral Water
- United Foods Company
- United Kaipara Dairies Co. PSC
Telecommunications
- Emirates Integrated Telecommunications Company – Du
Utilities
- TABREED
Appendix 5
The following are the companies listed in Abu Dhabi Stock Exchange:
- Aabar Investments
- Al Buhaira National Insurance Company
- Abu Dhabi Aviation Co.
- Abu Dhabi Commercial Bank
- Abu Dhabi National Hotels
- Abu Dhabi National Insurance Company
- Abu Dhabi Ship Building Co.
- Fujairah National Insurance Co.
- AGTHIA Group PJSC
- Al Khazna Insurance Co.
- Al Ain Al Ahlia Insurance Co.
- ALDAR Properties PJSC
- Arkan Building Materials Co.
- International Fish Farming Holding
- Al Wathba Insurance Co. P.S.C
- Abu Dhabi National Co.
- Bank of Sharjah
- Commercial Bank International
- Commercial International Bank (Egypt)
- Dana Gas PJSC
- Al Dhafra Insurance Co.
- Emirates Driving Company
- Emirates Insurance Co.
- Etisalat
- Fujairah Building Industries P.S.C
- Fujairah Cement Industries
- First Gulf Bank
- Finance House
- FOODCO Holding P.J.S.C
- Fujairah Trade Centre
- Gulf Cement Co.
- Gulf Medical Projects
- Invest Bank
- Gulf Pharmaceutical Co.
- Methaq Takaful Insurance Co.
- National Bank of Abu Dhabi
- National Bank of Fujairah
- National Bank of Umm Al-Qaiwain
- National Corp for Tourism and Hotels
- National Marine Dredging Co.
- Oman & Emirates Inv. Holding Co.
- Palestine Telecommunication Company
- Umm Al Qaiwain Cement Industries Co.
- Qatar Telecom
- National Bank of Ras Al-Khaimah
- Ras Al Khaimah Cement Company
- Ras Al Khaimah Ceramic Co.
- Ras Al Khaimah National Insurance
- RAK Properties
- Ras Al Khaimah White Cement
- Ras Al Khaimah Poultry and Feeding Co.
- Sharjah Cement and Industrial Development Co.
- Sharjah Islamic Bank
- Sharjah Insurance Company
- Sorouh Real Estate
- Sudan Telecommunications Co. Ltd
- Abu Dhabi National Energy Company
- Abu Dhabi National Takaful Co. PJSC
- United Arab Bank
- Union Cement Co.
- United Insurance Co.
- Union National Bank
- Union Insurance Company
- Waha Capital PJSC
Appendix 6
HR Questionnaire
Investigation of employee turnover in Government organisations in the UAE
- Is the rate of employee turnover in your company considered high or low?
- How is it measured?
- What has been the trend over the last 3 years? Increasing or decreasing?
- According to exit interviews, what are the main reasons for employee turnover?
- How do you tackle the results?
- Any new HR policies been implemented?
- What is the ratio of male to female employees in the company?
- Is employee turnover higher with females more than males?
- What is the main reason for females leaving the organisation?
- What is the ratio of Local to Expatriate employees in the company?
- Is employee turnover higher with Expatriates more than Locals?
- What is the main reason for Expatriates leaving the organisation?
Appendix 7
Questionnaire Results
Analysis of Results
Organisation № 1.
- Work Environment
Employees are satisfied with the work environment.
There exists an active social event structure.
Employees are satisfied with the working hours.
- Career Development
Employees are satisfied with the training programs offered.
Organisation provides full support to employees for further education.
There exists a clear development plan.
Employees are offered job rotation during their induction.
- Management Style
There exists good communication between employees and the management.
Management keeps employees involved and updated with their decisions.
Managers and decision-makers are qualified.
Employees learn a lot from the management.
Supervisors and top management treat the employees fairly.
- Job Description / Responsibilities
Goals and targets are clear.
Employees are involved in the decision-making process.
Employees feel challenged as they are given significant responsibilities.
- Compensation
Employees are satisfied with their salaries.
Salaries of employees match their colleagues in the same position.
Employees are compensated for working overtime.
- Promotions
There is a fair reward scheme implemented.
Promotions are given fairly.
Co-Worker Relationships
Employees have good relationships with each other.
Employees have good communication with each other where they update each other regularly.
Organisation № 2
- Work Environment
Employees are satisfied with the work environment.
There exists an active social event structure.
Employees are satisfied with the working hours.
Career Development
Employees are satisfied with the training programs offered.
Organisation provides full support to employees for further education.
There exists a clear development plan.
Employees are offered job rotation during their induction.
- Management Style
There exists good communication between employees and the management.
Management keeps employees involved and updated with their decisions.
Managers and decision-makers are qualified.
Employees learn a lot from the management.
Supervisors and top management treat the employees fairly.
- Job Description / Responsibilities
Goals and targets are clear.
Employees are involved in the decision-making process.
Employees feel challenged as they are given significant responsibilities.
- Compensation
Employees are satisfied with their salaries.
Salaries of employees match their colleagues in the same position.
Employees are compensated for working overtime.
- Promotions
There is a fair reward scheme implemented.
Promotions are given fairly.
- Co-Worker Relationships
Employees have good communication with each other where they update each other regularly.
Organisation № 3
- Work Environment
Employees are satisfied with the work environment.
There exists an active social event structure.
Employees are satisfied with the working hours.
- Career Development
Employees are satisfied with the training programs offered.
Organisation provides full support to employees for further education.
There exists a clear development plan.
Employees are offered job rotation during their induction.
- Management Style
There exists good communication between employees and the management.
Management keeps employees involved and updated with their decisions.
Managers and decision-makers are qualified.
Employees learn a lot from the management.
Supervisors and top management treat the employees fairly.
- Job Description / Responsibilities
Goals and targets are clear.
Employees are involved in the decision-making process.
Employees feel challenged as they are given significant responsibilities.
- Compensation
Employees are satisfied with their salaries.
Salaries of employees match their colleagues in the same position.
Employees are compensated for working overtime.
- Promotions
There is a fair reward scheme implemented.
Promotions are given fairly.
- Co-Worker Relationships
Employees have good relationships with each other.
Employees have good communication with each other where they update each other regularly.
Organisation №4
- Work Environment
Employees are satisfied with the work environment.
There exists an active social event structure.
Employees are satisfied with the working hours.
- Career Development
Employees are satisfied with the training programs offered.
Organisation provides full support to employees for further education.
There exists a clear development plan.
Employees are offered job rotation during their induction.
- Management Style
There exists good communication between employees and the management.
Management keeps employees involved and updated with their decisions.
Managers and decision-makers are qualified.
Employees learn a lot from the management.
Supervisors and top management treat the employees fairly.
- Job Description / Responsibilities
Goals and targets are clear.
Employees are involved in the decision-making process.
Employees feel challenged as they are given significant responsibilities.
Compensation
Employees are satisfied with their salaries.
Salaries of employees match their colleagues in the same position.
Employees are compensated for working overtime.
- Promotions
There is a fair reward scheme implemented.
Promotions are given fairly.
- Co-Worker Relationships
Employees have good relationships with each other.
Employees have good communication with each other where they update each other regularly.
Appendix 8
References
Books
- Burton D. Research Training for Social Scientists. Sage Publications Ltd.: London, UK, 2000.
- Craig, Samuel & Douglas, Susan. International Marketing Research. John Wiley & Sons, 2000.
- Fowler, Floyd. Survey Research Methods. Sage Publications Ltd.: London, UK, 1992.
- Gibb, Stephen. Learning and Development: Processes, Practices and Perspectives at Work. Palgrave Macmillan: Hampshire, UK, 2002.
- Graham, H T & Bennett, Roger. Human Resources Management. Prentice Hall: Great Britain, 1998, 9th ed.
- Grugulis, Irena. Skills, Training and Human Resource Development. Palgrave Macmillan: Hampshire, UK, 2007.
- Hollenbeck, Noe & Wright, Gerhart. Human Resource Management: Gaining a Competitive Advantage. McGraw Hill Publishing: New York, USA, 2003, 4th ed.
- March, JG & Simon, HA 1958, Organizations, Wiley, New York.
- Noe, Raymond A. Employee Training Development. McGraw Hill Publishing: New York, USA, 2008, 4th ed.
- Rosse, J. & Hulin, C. Adaptation to Work: An Analysis of Employee Health, Withdrawal and Change. Organizational Behavior and Human Decision Processes, 1985.
- Rosse, J. & Miller, H. Absence and other employee behaviors. In P. Goodman, R. Atkin and Associates, Absenteeism: New Approaches to Understanding Measuring, and
- Managing Employee Absence. Jossey-Bass: San Francisco, 1984.
- Rosse, J. Understanding Employee Withdrawal from Work. Lexington Books: Lexington, MA, 1991.
- Thomson, Rosemary. People Management. Universities Press Limited: India, 1999.
Journals
- Arnold, J & Davey, KM 1999, ‘Graduates’ Work Experiences as Predictors of Organisational Commitment, Intention to Leave, and Turnover: Which Experiences Really Matter?’, Applied Psychology: An International Review, vol 48, no. 2, pp. 211-238.
- Blau, GJ & Boal, KB 1987, ‘Conceptualizing How Job Involvement and Organizational Commitment Affect Turnover and Absenteeism’, Academy of Managernet Review, vol 12, no. 2, pp. 288-300.
- Boxall P., Macky K. & Ramussen E. Labour Turnover and Retention in New Zealand; the Causes and Consequences of Leaving and Staying with Employers. Asia Pacific Journal of Human Resources, vol. 41, 2003.
- Griffeth R. W., Hom P. W. & Gaertner S. A Meta Analysis of Antecedents and Correlates of Employee Turnover: Update Moderator Tests ; and Research Implications for the Next Millennium. Journal of Management; vol. 26, 2000.
- Guthrie, JP 2001, ‘High-Involvement Work Practices, Turnover, And Productivity: Evidence From New Zealand’, Academy of Management Journal , vol 44, no. 1, pp. 180-190.
- Hanisch, K. & Hulin, C. & Roznowski (1998) The Importance of Individuals’ Repertoires of Behaviors: The Scientific Appropriateness for Studying Multiple Behaviours and General Attitudes. Journal of Organizational Behaviour, 1998.
- Hellman, CM 1997, ‘Job Satisfaction and Intent to Leave ‘, Journal of Social Psychology, vol 137, no. 6, pp. 677-689.
- IDS. Improving Staff Retention. IDS HR Studies No. 765, 2004.
- Irvine, DM & Evans, MG, 1995, ‘Job satisfaction and turnover among nurses: integrating research findings across studies’, Nursing Research, vol 44, p. 246 – 253.
- Lum L., Kervin J., Clark K., Reid F. & Sirola W. Explaining Nursing Turnover Intent: Job Satisfaction, Pay Satisfaction or Organizational Commitment. Journal of Organizational Behavior, 1998.
- Martin C. Explaining Labour Turnover: Empirical Evidence from UK Establishments. Labour, vol. 17.
- Maurer, DE 1985, ‘Analyzing Personnel Rotation in the Navy’, Management Science, vol 31, no. 2, pp. 284-292
- Mitchell, TR, Holtom, BC, Lee, TW, Sablynski, CJ & Erez, M 2001, ‘Why people stay: Using job embeddedness to predict voluntary turnover’, Academy of Management Journal , vol 44, p. 1102–1121.
- Mobley, WH 1977, ‘Intermediate linkages in the relationship between job satisfaction and employee turnover ‘, Journal of Applied Psychology, vol 62, p. 237–240.
- Mobley W. H., Griffeth R. W., Hand, H.H. & Meglino, B. M.. Review and Conceptual Analysis of the Employee Turnover Process. Psychological Bulletin, vol. 86, 1979.
- Parnell, JA & Crandall, W 2003, ‘Propensity for Participative Decision-Making, Job Satisfaction, Organizational Commitment, Organizational Citizenship Behavior, and Intentions to Leave Among Egyption Managers’, Multinational Business Review , vol 11, no. 1, pp. 45-65.
- Pearson, AE 1966, ‘Sales Power Through Planned Careers ‘, Harvard Business Review, vol 44, no. 1, pp. 105-116.
- Pelled, L. & Xin, K. Down and Out: The Investigation of the Relationship between Mood and Employee Withdrawal Behavior. Journal of Management, 1999.
- Smith, F. Work Attitudes as Predictors of Specific Day Attendance. Journal of Applied Psychology, 1977.
- Tang, T.L.P., Kim J.W & Tang D.S.H. Does Attitude toward Money Moderate the Relationship between Intrinsic Job Satisfaction and Voluntary Turnover? Human Relations, vol. 53, 2000.
- Winterton, J 2004, ‘A conceptual model of labour turnover and retention’, Human Resource Development International, vol 7, no. 3, pp. 371-390.
- Zimmerman, RD 2008, ‘Understanding The Impact Of Personality Traits On Individuals’ Turnover Decisions: A Meta-Analytic Path Model’, Personnel Psychology , vol 61, no. 2, pp. 309-348.
Websites
- Abraham Maslow Theory of Motivation.
- Convenience Sample.
- Co-Worker and Workplace Relationships.
- Employee Turnover Costs are Greater than One Might Think. Web.
- Employee Turnover Remains Regional Businesses Invisible Enemy Despite Global Crisis.
- High Cost of Employee Turnover.
- Job Satisfaction: Strategies to Make Work More Gratifying. Web.
- Managing Others at Work – The Business Psychologist. Web.
- Maslow’s Hierarchy of Needs.
- Need of Employee Retention, Importance of Retention Plans.
- Primary Data Collection Methods.
- Qualitative Research – Wikipedia, the Free Encyclopedia. Web.
- Questionnaire Design. Web.
- Quantitative Research – Wikipedia, the Free Encyclopedia. Web.
- Questionnaire Design.
- Sampling. Web.
- UAE Firms Grapple with High Staff Turnover Cost.
- United Arab Emirates – Wikipedia, the Free Encyclopedia.
- Work Relationships.