Abstract
This thesis examines the emergence, theoretical and practical value of Islamic market indices. The first two goals rely on straightforward secondary research that initially highlights the conceptual simplicity of stock market indexes for investors, the financial press and other stakeholders like government.
For the pious individual and institutional investor, Islamic market indexes permit once-removed participation in Shari’ah-compliant baskets of stocks. The theoretical value of an Islamic market index therefore lies in assuring the faithful that they avoid proscribed products (e.g. pork processing, weaponry), services (gaming and sleazy entertainment), and usurious practices.
The pragmatic and investment potential of Islamic market indexes parallels that for virtually any optimal stock market portfolio. These include growth and stability or safety based on geographical and industrial diversification. Secondary research reveals that, though Islamic market indexes are a comparatively novel for dating back only to 1999, the spectrum of worthwhile choices has broadened very rapidly indeed.
The second facet of practical utility focuses is provided by empirical analysis of performance since mid-2007, when speculation on derivatives based on an overheated U.S. housing mortgage market finally entered a correction and subsequently plunged trans-Atlantic markets into the longest recession since the Great Depression of 1929 and the 1930s. The results of empirical analysis suggests that the Islamic indexes did suffer some slight losses, but not as much as the conventional indexes. Overall, one concludes that Islamic indexes have generally delivered a good track record with lower volatility than other, non-compliant indexes over the last eleven credit-crisis challenged quarters.
Introduction
History of Indexing
Stock market indexes summarize movements in the stock market but the former developed centuries after markets came into being. The London Stock Exchange, for example, commenced informally in a coffeehouse with handwritten lists of stocks and commodity prices as far back as 1698. The English colonists who peopled America brought the knowledge of stock companies and debt paper with them, an invaluable background when both companies and the colonial government needed to raise funds. Not till 1792, however, did the New York-based stockbrokers move indoors from chaotic curbside trading to establish the New York Stock Exchange (Money-Zine.com 1).
Nine more decades would pass before the first index, precursor to today’s slew of Dow Jones market indexes, saw the light of day. The name derives from Charles Dow and Edward Jones, publisher of the Customer’s Afternoon Letter (precursor to today’s Wall Street Journal) and statistician-colleague, respectively. In 1884, the two partners devised a single trending number, called the Dow Jones Averages (Kuo 1; CME Group Index Services 1).
While conceding that the DJIA gives a quick read on the overall trend of the market, the fact is that the Dow Jones series of indexes has proved dynamic, responsive to the investment climate of each era. For instance, that first DJ Averages index of 1884 comprised just the dollar price averages of 11 shares, heavily weighted towards railroad shares (nine versus just two manufacturing firms) because these were
the attractive investments in the post-Reconstruction era. By 1896, however, the luster of railroads had faded and the first Dow Jones Industrial Average was constructed from an even dozen stocks (CME Group Index Services LLC 1):
Table 1: The Composition of the First Dow Jones Industrial Average (1896) and the Eventual Successors in Interest.
*Removed from the Dow Jones Industrial Average in 1899.
**Removed from the Dow Jones Industrial Average in 1916.
After replacing the companies as described above, Dow Jones increased the number of benchmark stocks to 30 in 1928. This number remained fixed till the present although the composition of selected companies and the divisor used on the sum of the component prices changes over time.
Table 2: Dow Jones Industrial Average Benchmarks and How Long It Took to Attain Those.
In contemporary times, for example, quantum leaps in information and communication technology (ICT) have created new areas of growth in companies that design hardware, write software or exploit the power of e-commerce to advantage. This means any index of publicly-traded stocks has to account for such gigantically successful companies as Microsoft, Salesforce.com, Amazon.com, Oracle, SAP of Germany, and Apple Computer (with its successful forays into MP3 players, mobile phones and tablet PC’s).
As well, summing and averaging share prices in dollars is vulnerable to share price inflation as dividends are reinvested, owing to the increasing cost of capital or simple market sentiment. Hence, it can be quite misleading to compare long-term trends in this and any other stock market index (see, for example, Table 2 above).
At the close of the market on June 25, 2010, the DJIA “basket” of 30 industrials is therefore broken out as shown in Table 3 below. In keeping with the aforementioned importance of the ICT industry, one notes the presence of such redoubtable leaders as Microsoft, Verizon, Cisco Systems, Hewlett-Packard, IBM and AT&T.
Table 3: The Present Composition of the Dow-Jones Industrial Average (2010).
The British counterpart to the original Dow Jones index is the Financial Times 30, also constructed so as to track fairly closely the general performance of industrial stocks in the UK. The FT 30 came into being, however, forty years late, in 1935.
The New York Stock Exchange (NYSE), which the DJIA tracked, was by no means the only equities market in America. There was the American Stock Exchange (Amex), originating around the California Gold Rush of 1849, also based in New York and a bourse for companies that could not meet the stricter listing standards of the NYSE. If initially weighted towards mining stocks, the Amex is presently skewed towards derivatives and stock options. An even later arrival (1971) is NASDAQ, acronym for the National Association of Securities Dealers Automated Quotation. Given a very efficient computer-aided trading operation right from the start, NASDAQ has attracted even market leaders that would previously have preferred the NYSE. At the height of the recovery from the 2001 dot-com collapse, trading volume at NASDAQ exceeded the NYSE’s for the first time ever (Money-Zine.com 1).
In contemporary times, market analysts and investors therefore pay inordinate attention not only to the Dow Jones indexes, but also the FT 30, the S&P 500 Index, and the Russell 2000 Index.
The Proliferation of Indexes Today
As of June 21, 2010, there were at least 402 known stock market indices worldwide. Origin, along with investor interest and activity, is concentrated in Europe and the United States, though there are pockets of activity in such financial hubs as Taipei and Singapore in East Asia (World-Stock-Exchanges.net 1). Table 4 (overleaf) shows that the more established and prominent indices – FTSE (Financial Times of London), Standard & Poor’s, Dow Jones, and Russell – count among themselves 25 global and regional indices.
Having antedated the UK counterpart, the Financial Times 30 (FT 30) by nearly four decades and being able to call on a larger, more sophisticated investor pool, the United States is the most active with fully 75 stock market indices (see Table 5 overleaf).
Table 4: Global and Regional Stock Market Indices (Source: World-Stock-Exchanges.net).
Table 5: Stock Market Indices in the Industrialized Nations (Source: World-Stock-Exchanges.net).
The rest of the world is hardly less vibrant. The middle-income (on a per-capita basis) and developing nations count among themselves 144 stock market indices. Index specialization is especially noteworthy in the Philippines, Hong Kong, Thailand (where the FTSE has one devoted to those operating under Shariah law), Indonesia (boasting the Jakarta Islamic Index), Brazil, and Singapore (Table 6 below).
Table 6: Stock Market Indices in the Middle-Income and Less-Developed Nations (Source: World-Stock-Exchanges.net).
History of Islamic Indexing
Two approaches are available for classifying Islamic stock market indexes. The first is the restrictive option of an index that tracks the stock market in a nation where Islam is the official religion and that confines itself solely to stocks and bonds fully compliant with Shariah law. On this basis, the Dubai Financial Market claims to be the very first to be Shariah-compliant, with the launch of the DFM General Index (DFMGI) in December 2006 (Dubai Financial Market para 3). The DFGMI can claim this because, six years after the Dubai Exchange was launched, no less than 99% of issues listed in the exchange are Shariah-compliant. For those not compliant, the DFM claims that commissions and other earnings are diverted to Zakat-like purposes: charity and social welfare beneficiaries.
On the other hand, the Dow Jones Islamic Market index (DJIM) was launched earlier, in 1999. While ceremonially unveiled in, and also operating out of Bahrain, the international character of the DJIM is evidenced by the fact that the company has aggressively marketed licenses in non-MENA (Middle East and North Africa region, principally Islamic) countries such as to the U.S.-based Javelin Investment Management for the purposes of attracting the presumably devout class of investor, estimated at around seven million in America alone.
The legitimacy of the DJIM rests on:
- An independent Shariah Supervisory Board that ensures compliance with Standard 21 of the Auditing & Accounting Organization of Islamic Financial Institutions (Clement & Wilson 21).
- Being global to the extent of selecting securities from the 44-country, 95% market coverage provided by the Dow Jones World Index while avoiding companies engaged in financial services(i.e. banks and insurance firms that charge interest on loans), “degenerate” entertainment (e.g. casinos and manufacturers of gaming paraphernalia), tobacco, weaponry and defense (CME Group Index Services, 2010b, para 2).
- Weeding out, based on financial ratios, those companies where the debt-equity ratio does not exceed 33%, accounts-receivables-to-total assets ratio is below 45%, and Interest income is below 5 percent of gross revenue (Clement & Wilson 21; Hakim & Rashidian 4).
In general, to be acceptable under Islamic principles, the index should contain only a set of stocks with no connection at all to gambling, alcohol distilling and dispensing, anything related to hog raising and pork processing, interest-bearing credit, financial services, defense/weapons, entertainment and other proscribed unethical activities. A firm heavily in debt is also considered in violation of the proscription against usury. The benchmarks for such violation are specified as financial ratios one-third or greater for: debt over prior 12-month average market capitalization; liquid assets (cash and interest-bearing securities) divided by the same divisor; and accounts receivables over average market capitalization for the previous 12 months (Hakim & Rashidian 2).
In the summer of 2009, Dow Jones launched an electronically traded fund (ETF) based on the aforementioned Islamic criteria. This was the Javelin Dow Jones Islamic Market International Index Fund (JVS) on the NYSE. JVS was touted as the precursor of more such ETF’s under the Javelin Exchange Traded Shares (JETS) product line. Like the mainstream DJIM, JVS legitimacy rests on portfolio oversight by a board of Islamic scholars and on avoiding the alcohol, tobacco, pork, entertainment, and interest-earning enterprise sectors. Diversification within the Dow Jones umbrella of indexes is achieved with a JVS portfolio emphasizing oil/energy, mining and basic materials, health care, and technology while being global to the extent of trading in no fewer than 18 currencies (Hakim & Rashidian 2; CME Group Index Services 2010b).
Given the risks of being found in violation of Quranic precepts on dent, interest and “undue” profits (see “Islamic Investment Principles” below), it stands to reason the pious Muslims would to invest in market indexes that offer the safety of being twice-removed from investment decisions. Since 1999, happily, the DJIM have evolved into a veritable parade of 100 different indexes that give Islamic investors the added flexibility of choice by market (e.g. the U.K. only), region (e.g. pan-Europe only), and down to the industry class. And every single one is said to be subject to the scrutiny of an independent Shari’ah Supervisory Board (CME Group Index Services 2010b).
Like the mainstream DJIA, the DJIM dynamically responds to changing business conditions, the competitive character of business, and the emergence of new market makers based on technological, cost-efficiency or other marketing advantage. Early this year, for instance, the Dow Jones Indexes announced numerous changes in the composition of no fewer than ten global and market indexes:
“In the Dow Jones Islamic Market World Index, 121 components will be added while 47 components will be deleted. That increases the number of components in the index to 2,417 from 2,343.
In the Dow Jones Islamic Market Asia/Pacific Index, with 68 additions and 23 deletions, the number of components in the index will increase to 1,092 from 1,047. In the Dow Jones Islamic Market Europe Index, 18 components will be added, while six components will be deleted. That increases the number of components in the index to 395 from 383. In the Dow Jones Islamic Market Americas Index, the number of components will increase to 784 from 775, with 22 additions and 13 deletions. In the Dow Jones Islamic Market MENA Index, 20 components will be added, while eight components will be deleted. That increases the number of components in the index to 163 from 151.
In the Dow Jones Islamic Market BRIC Equal Weighted Index, 23 components will be added, while two components will be deleted. That increases the number of components in the index to 81 from 60.
In the Dow Jones Islamic Market China Offshore Index, six components will be added and one component will be deleted. That increases the number of components in the index to 25 from 20. In the Dow Jones Islamic Market Hong Kong Index, with 17 additions and four deletions, the number of components will increase to 103 from 90. In the Dow Jones Islamic Market India Index, one component will be added and one component will be deleted. The number of components in the index will remain at 178. In the Dow Jones Islamic Market Turkey Index, three components will be added and no component will be deleted. The number of components in the index increases to 30 from 27.” (Dow Jones Indexes paras. 1-5)
Today, 15 domestic indices are active in the ten Islamic countries that extend from oil-rich Nigeria and Morocco in Western Africa, Palestine, Turkey, the United Arab Emirates, the Kingdom of Saudi Arabia (KSA) and east to Oman and Pakistan (Table 7 overleaf).
Table 7: The Islamic Stock Market Indices.
While 85% of the population declare themselves Muslim, Indonesia is not an Islamic state and is therefore reckoned in the Table 7 listing (above) of middle-income and developing markets. After all, just one of the 18 indices published in Jakarta is specifically Islamic or Shari’ah-compliant. The others are quite simply atypical of the Islamic propensity for sparse dealings in equities and bond markets.
Neighboring Malaysia professes Islamic teachings too and is more serious about making Shariah-compliant market indexes available for practicing Muslims. For all that an even lower 60 percent of the population profess to be Muslim and religious freedom is constitutionally guaranteed, Malaysia may as well be classed an Islamic state for: pronouncing Mohammedanism the official religion, for considering all ethnic Malays Muslim, and having a system of Shari’ah courts that cannot be overruled by civil courts on matters of marriage, “apostasy”/religious conversion, inheritance and child custody. Nonetheless, the local bourse evidently straddles the secular-religious divide. Just seven in eight stocks, amounting to two-thirds of market capitalization, comply with Muslim religious tenets. Still, Bursa Malaysia proclaims that:
We are the world’s only exchange with three comprehensive and transparent Shari’ah screening processes: FTSE Group, Yasaar Ltd and the SC’s Shari’ah Advisory Council (SAC). These screening processes that look at both qualitative and quantitative measures help us meet local requirements and align us with international standards. The FTSE Hijrah Shari’ah index (FBM Hijrah Shari’ah) and the FTSE Bursa Malaysia EMAS Shari’ah index (FBM EMAS Shari’ah) provide a broad benchmark for Shari’ah-compliant investment. These indices are designed for investors who wish to invest in Shari’ah-compliant stocks that are consistent with Shari’ah principles. (para 3)
The Rationale for Stock Market Indices
The purpose of an index is to give investors lacking the time to intensively study developments in the stock market from day to day a quick sense of activity in the marketplace. Essentially, an investor who prefers long positions may wish to be alerted that the market is trending up. Conversely, another who enjoys profits from selling short needs an early indicator that the market is “softening” (flat or trending down) so as to take a closer look at industrial sectors or even stocks of interest and check whether these are also headed down. And then there is aggressive investor capable of switching positions and riding the market whichever way it goes. For all three types, an index serves as a trigger for closer scrutiny of favored stocks and a bellwether of how the general run of fellow investors behaved the previous trading day.
Following the lead of America’s Customer’s Afternoon Newsletter that was first published in the 1880s and became the Wall Street Journal, contemporary journalists rely on daily changes in the popular market indices to show how the “market” of investors demonstrates rising or declining confidence in response to economic, political, war, and miscellaneous international developments. To an extent, this is necessary since the usual indicators of economic performance – gross domestic and national product, retail sales, employment rates, price inflation, housing starts, fiscal and trade deficits, inventories at the producer and retailer levels, and interest rates, to name just a handful – take time to compile, weight, estimate, and report. But the combined pressures of daily deadlines, peer competition, all-news or all-business cable channels, and the instant gratification provided by the Internet make for both poor journalism and poorly-informed editorializing on what it all means. This is amply demonstrated by the current recession where the tendency is for every little uptick in the New York Stock Exchange or the Dow Jones Industrial Average to be hailed as the first swallows in the spring of economic recovery. Over and over again, however, the following days or weeks bring on “market corrections” that reflect great uncertainty about the state of the American economy.
Recap
Stock market indexes lagged the creation of stock markets on both sides of the Atlantic by many decades. The Dow Jones Industrial Average, for instance, came into being around 70 years after the New York Stock Exchange (NYSE) had made the transition from curbside trading to a trading floor in the same address where it stands today. For all that the London Stock Exchange itself had antedated the NYSE by a century, the first UK-based index was itself a latecomer and was published just before the Great Depression of the last century.
Indexes have proliferated since then because these serve at least four major functions. To government, the media and the general public, the short-term behavior of a stock market index is a handy (if often illusory) guide to the direction the economy is taking. Second, the managers of listed companies obtain a handy benchmark for whether their firms outperform or underperform the market average. Third, an investor can take aggressive long, short or dynamic positions against index trends as temperament dictates. Fourth, indexes themselves become the basis for marketing financial instruments such as derivatives.
Islamic market indices serve the requirements of both domestic and immigrant Muslim investors who wish to be pious about observing the spirit and letter of Shari’ah law. Three requirements are common to all those that claim to be Shari’ah-compliant. First is ethical guidance, either obedience to domestic law in the case of Muslim nations or guided by a board of Islamic scholars for those established in Western, more secular societies. Secondly, an Islamic index should contain only stocks with no connection at all to gambling, alcohol distilling and dispensing, anything related to hog raising and pork processing, interest-bearing credit, financial services, defense/weapons, entertainment and other activities proscribed by the Quran. Third, the Quranic proscription against usury means that firms heavily in debt (and hence, paying substantial interest) or earning profits from charging interest on loans (mainstream banks and financial institutions) are also considered in violation of the ban on usury.
Islamic indexes are a really quite recent development. The pioneering Dow Jones Islamic Markets index is important to this analysis both for being the first of its kind (established 1999) and having developed to the extent of offering pious investors ancillary indexes keyed to, for example, high-growth industries, high-potential geographic regions or individual markets. In turn, the Dubai Financial Markets (DFM) followed in mid-decade as the first Islamic index native to a Muslim nation. Today, there are at least 15 domestic Islamic indexes 15 domestic indices are active in the expected geographic arc that runs from Western Africa to Pakistan. Islamic indexes also exist in countries with substantial Muslim populations (e.g. Indonesia) and completely secular financial hubs like Hong Kong.
Literature Review
Index Funds as Investment Alternative
Index funds are a fairly recent development although the first, Vanguard, was introduced in 1976. It was the bull market of the 1990s, however, that gave rise to many indices (see Tables 4 to 6 above). Granting that an investor is already satisfied with his portfolio mix in point of growth and stability, Malkiel (10-11) and Sharpe (1) separately contend that investing in index funds or electronically-traded funds (both being a type of passive investment management strategy) work because:
- Over the long run, returns performance will be the same as the market average. However, index investing requires fewer transactions and hence, reduces investment costs. In short, passive investing and the intent to stay with the market for the medium term returns savings that add to portfolio bottom line.
- The “efficient market hypothesis” notwithstanding, the contention that equilibrium prices already account for all available information does not preclude an index that outperforms the market.
- Index and ETF investing minimizes the problem of motivating a fund manager to continually balance buy-sell-hold decisions vis-à-vis the risk-return tolerance of the investor.
- The depressed and volatile state of the domestic market may, the authors argue, in fact be conducive to passive and stable investment strategies such as index funds placements.
- Finally, one implication of the capital asset pricing model is that, under equilibrium and other minor conditions, a “riskless” asset comprising the market as a whole is suitably stable.
Extreme Portfolio Diversification with Stock Market Indexes
Such considerations pave the way for participation in the many broad-scale indices now available, such as the Wilshire 5000 for U.S. assets, the Financial Times’ FTSE All-Share tracker (equivalent to 98% by value of public companies in the UK) or its top 100 counterpart, the FTSE 100 (Kuo 1).
Having assented to participation in indexes, the ancillary question becomes: why bother going beyond domestic indices and participate in global or regional indexes? Certainly, there is no lack of these either, as shown in Table 4 (page 7). As counterpart to the Dow Jones Industrial Average 30, there is the BBC Global 30 in the UK to which the category pioneer responded with the Dow Jones Global Titans 50. Russell offers the most diversified portfolio under one fund, the Russell Global 10,000. Under the “Mondo Visione” brand, the FTSE offers a portfolio of exchanges in all regions of the world. Similarly, there is no lack of indices for those preferring to concentrate passive placements solely in Europe (e.g. the S & P Europe 350) or the bright growth prospects of emerging markets (FTSE Asean for Southeast Asia, S&P Latin America 40).
The entire rationale for investing offshore can be summed up in one word “globalization” and the prospects for superior returns offered by developing markets. The second half of the twentieth century ended the era of mercantile colonization but the multinational corporation had essentially taken up the tasks of resource exploitation and marketing the manufactured goods of the West to the newly independent nations. Despite the best of intentions and partly because of the low-intensity conflicts spawned by the Cold War, economic development did not come easy for these new nations. In contemporary times, therefore, many an American and European business outsources non-core work to the less-developed countries that have the twin advantages of a well-educated workforce and lower costs of living. Combined with cyclically high prices for natural resources (e.g. crude oil from OPEC countries, gold and diamonds from Africa, copper from Zimbabwe and the Philippines), it is obvious that there is a multitude of growth opportunities globally that contrast with sluggish prospects for recession-hobbled North America and Europe.
Quite apart from placement in index funds, the high-net-worth investor can, in fact, benefit the host nations with foreign direct investment. After all, most extraction and manufacturing industries in less-developed countries remain mired in outmoded technologies and inefficient practices.
Finally, globalization makes itself most evident in the matter of interrelated interests. Traditionally, energy and industrial technology transfer propelled international trade and cooperation. Today, the full impact of information on the Internet can be felt in even more rapid knowledge transfer and greater commonality of attitudes, such as those around climate change.
Islamic Investible Funds
The proliferation of Shari’ah-compliant funds responds to the relative lack of worthwhile investment vehicles in contemporary times and the enormous pool of investible funds held by Muslim Arabs and Africans under the OPEC umbrella. The attractiveness of the BRIC nations emerged only in this decade, soon after the “Thai disease” spilled over to the once-vibrant economies of East Asia in 1996-7, the collapse of the trans-Atlantic equities markets alongside the bursting of America’s dot-com bubble in 2000-01, and the second recession of this decade brought on by speculation in non-prime mortgage derivatives. At the same time, the OPEC nations had engineered embargoes and ceaseless price increases since 1973 on the pretexts of protesting U.S. support for the existence of Israel and responding to “unsustainable petroleum demand” by the Western world. As this decade ends, consequently, Islamic financial institutions reportedly hold over $230 billion (and possibly as much as $1 trillion) of investible surpluses (Hakim & Rashidian 3; Asian Development Bank, qtd. in Skuk 4).
Islamic Investments and Principles
Being “Shari’ah-compliant” rests on keeping faith with certain strictures based on the Quran. First, the principles of divine ownership of all property and of sharing with those in need leads to an injunction against “unequal exchanges or unfair advantages in trade” (Glenn 184). This is interpreted to mean that the financially well-off must not exact exorbitant prices nor levy interest on those they do business with. A second implication of egalitarianism is “riba”: one party to a transaction should not be made to bear risks of financial loss out of proportion to potential returns (Kuran 600). This applies to insurance since insurers confront the risk of outrageous losses when balanced against the potential profit made from every single collection of insurance premiums.
Since it is central to Islamic finance that money has no intrinsic value per se, the faithful are forbidden from earning interest on lending or other monetary transactions. Earnings can be had solely from socially productive processes such as investment in assets (manufacturing equipment, real estate), domestic commerce and foreign trade. To be Shari’ah-compliant, hence, an Islamic fund must ensure that the investment pool earns solely “halal” (spiritually acceptable) profits. Furthermore, the Islamic faithful cannot in good conscience accept the promise of a fixed return based on the amount invested or a “no loss” guarantee on the principal because both of these bespeak an overweening obsession with return for money invested. Rather, an index fund placement is “halal” if the investor can be said to earn in proportion to his share of the total fund. As in the previously-cited examples “…how do index and fund providers translate these ethical ideas into practical investments? The MSCI Islamic Series, for example, is based on a normal MSCI index of shares but with equity screens applied to weed out all the non-compliant shares. They exclude securities using two types of criteria: business activity and financial ratios. The screens involve excluding any company that derives more than 5 per cent of its revenue (cumulatively) from…activities like gambling, alcohol and pork processing.” (Sukuk Holdings 1)
Under the principle of “riba”, it also becomes unseemly to structure a business as a limited-liability enterprise since such a business model forces suppliers and customers to bear a greater proportion of the risk than company shareholders do.
Followed to the letter of the law, such strictures encouraged equal distribution of inheritance, no matter that it is limited to male heirs, rather than the emphasis on primogeniture practiced in, say, Europe. As a result, concentration of wealth is slower. Another implication is that Muslims were extremely reluctant to patronize banks and insurance companies. The mere act of complete bookkeeping, so vital to Western management, was bogged down in inertia owing to the prospect that religious authorities might find the business in violation of Quran prohibitions on undue debt, interest or margins (Glenn 184; Kuran 600).
In the area of index-linked funds, the equivalent of keeping faith with Mohammedan precepts meant portfolios that excluded firms engaged in distilling or retailing alcohol, gaming establishments, those laden with disproportionate debt, unethical management, and in all other ways, not “halal” (Hakim & Rashidian 2).
Since the Gulf stock markets are neither large nor diversified enough to absorb the great volumes of investible funds that increase from 10 to 15 percent annually owing to buoyant oil prices, pious Muslims looking for Shari’ah-observant investment vehicles have had to look overseas, the West in particular. London has been the leading beneficiary in this respect, since the City boasts no fewer than five Islamic-compliant banks (e.g. the Islamic Bank of Britain, also listed in the UK exchange), “halal” financial services, and even the Shari’ah-compliant “Sukuk” bond listed early in 2010 on the London Stock Exchange.
Returning a profit or providing trade credit is by no means contrary to Muslim scriptures. Rather, Shari’ah-compliant funds management means earning a fair share of satisfying returns, if that is what a top-class expatriate rental or a productivity-enhancing investment in office equipment deserves, by way of example. And all the better if it can be shown that a loan, bond float or index investment yields a social benefit, particularly in advancing more equitable distribution of wealth.
Recent examples of investment offers to Quran-conscious private investors succeeded not in point of complexity but flexibility. One bond offering became immediately acceptable because it stood to benefit Children’s Mutual, a UK-based financial service positioned against child trust accounts. ETF Securities succeeded with a commodity funds offer by reverting to the ancient practice of giving the buyer physical possession of any precious metals bought, unheard of in this day and age but thereby salving the investors’ consciences about profiting from pure speculation on commodity futures. March 2010 saw the introduction of yet another UK innovation, the Family Shari’ah Fund with the declared objective of cultivating “…stable long-term capital appreciation across a market cycle through a diversified pool of investments” including money-market instruments, leasing and fixed-income sukuks – real estate, private equity and structures replicating hedge funds returns – plus equities.” (Sukuk Holdings Ltd. para 5).
When it became evident early on that the Dow Jones foray into a Shari’ah-compliant index had proved a success, competition for a fair share of the index-tracking and ETF space became keen. FTSE was not one year behind. A Deutsche Bank DBS fund tracking the main S & P 500 followed, as did MSCI, Barclay’s iShares, and many a half-hearted offering in East Asian bourses.
Competition has extended to catering to religious convictions in different ways. For example, MSCI indexes are careful not to offend by avoiding all those involved in irreverent, Western-type music (a prohibition that extends from the record labels to the radio networks that play them), hotels (because of their catering to singers, musicians and slackness about registering unmarried couples), film and television (including cable companies and legitimate theater). The Deutsche DBX/S&P offering, for its part, is careful to weed out precious metal offerings by commodity funds if these are transacted as deferred-cash, not to take actual possession of, say, gold and silver. In turn, the iShares ETF has emphasized unusual positions in alternative assets, property, infrastructure companies operating in developing nations, taking positions on U.S. ETF’s, global assets and emergent markets with three different funds keyed to the Metals Service Center Institute (MSCI) listings. Again, the signal success of Barclay’s invited aggressively-priced alternatives from Deutsche DBX.
From a business viewpoint, this packaging of Shariah-compatible indexes and ETF’s bears benefits and drawbacks. Veering away from banks has cushioned the damage that ensued from U.S. bank failures on “Black October” (October 2008) and rippled across the oceans to correspondent banks and investors in Europe, Japan, Singapore, and as we see later, in the GCC. Secondly, the health care sector has become prominent in compliant portfolios. Given stable performance during the worst of the domestic recession and buoyant prospects ahead as the U.S. population continues to age and be subject to degenerative diseases. This can be considered an excellent defensive holding. Thirdly, the ethical composition of compliant indexes and ETF’s has begun to attract even Christian socially-responsible investors (SRI). The two religious sectors share, after all, a distinct misgiving about the ethics of banking and this has undoubtedly been reinforced by the recent experience with the mortgaged homes of the lower-middle classes being repossessed. If anything, Christian SRI’s ut avoiding companies that fabricate weapons, ammunition and bombs.
The major drawback – owing to the greater portfolio shares accorded oil, energy and mineral resources – is greater risk from cyclical price corrections and geopolitical developments, such as those pitting Iran against the United Nations and the Group of 8 today. As it happens, nearly half of the emerging markets ETF of IShares fall in this vulnerable category. Other drawbacks have to do with the presently-embryonic size of most ETF’s (with all that implies for continuity) and with depending on a panel of “experts” interpreting often-unclear and hoary religious texts (Sukuk Holdings 1-2). Down through the centuries, unhappily, Islam has been riven by enough differences of opinion to cause internecine strife and bloodshed.
Recap
This section explains the evident strength of Islamic market indexes owing, first of all, to the prior existence of index funds beginning in the mid-1970s. When many more index and electronically-traded funds emerged during the bull market of the 1990s, both investors and traders realized the pragmatic benefit of a more passive investment strategy that reduces transaction frequency and costs. As well, index funds outperformed the market often enough to give grounds for optimism that one vehicle could deliver superior growth. Finally, acceptance of the capital asset pricing model leads to belief in the stability of a single asset that comprises the market as a whole and is therefore “riskless”.
Demand-side analysis reveals the impact of the great accumulation of OPEC capital that took place since the unprecedented petroleum price increases that commenced in 1973. The historical peak of nearly $140 per barrel reached in 2008 (concededly falling to half and rebounding yet again) illustrates as nothing can the great torrents of royalty income that the OPEC countries receive. Even with the most ambitious industrialization plans, domestic capacity to absorb is usually limited. Protecting foreign currency reserves from inflation in future means deploying as much as possible in the most diverse portfolios possible while carefully adhering to Islamic precepts.
In the eleven years since the DJIM came on the market, mobilization of OPEC capital has been greatly aided by the great diversity of stock market indexes, both ordinary and Shari’ah-compliant, that have emerged. Domestic fund managers have a wealth of choices that span the globe (e.g. the Russell Global 10,000, the FTSE “Mondo Visione” vehicle), regional indexes and single markets.
Fortunately, there has also been no shortage of compliant indexes and portfolios that adhere to Islamic precepts about “riba” (egalitarianism), “halal” or spiritually acceptable profits, and fixed-income sukuks so that there is no appearance of speculative greed.
Methodology
Introduction
This section addresses the performance criteria against which Islamic market indexes are evaluated. Ordinary fundamentals of portfolio and index returns are first investigated. Given the reality of choice available to the Islamic fund manager contemplating Islamic indexes and the lingering problems of debt and recessionary effects that impact the Gulf nations, the analysis also covers performance against mainstream, secular market indexes and a comparison with the grave recessionary slumps into which virtually all stock markets worldwide fell since mid-2007.
The Fundamentals of Index Performance and Assessment
There are any number of ways to methodically assess the performance of stocks and the portfolios referred to as indices. Given the explicit objective of this study, secular and co-integration analysis are discussed.
Compounded money return or the rate thereof is, of course, the most basic consideration in analyzing the performance of any stock, portfolio or index. For the purpose of this analysis, it helps that the available data for both secular and Shariah-oriented funds are already expressed in index numbers, albeit with varying starting points. In fact, starting points are more crucial than they appear at first glance since analysts are familiar with the reality that the rate of return varies with the starting point. Two other considerations impact the calculation of rates of return. The first is the tax status of the investor, whether he is liable to taxes in both country of residence and the legal domicile of the index fund, and in either case, whether he qualifies for tax-exempt or deferred treatment. Secondly, money return may be stated in nominal or real terms, the latter meaning corrected for some measure of inflation or other.
The analysis subject of this study is medium-term in scope, covering the latter half of this decade or from 2006 to 2010. Longer-run investments should factor in long-term secular cycles, commonly referred to in the financial press as “bull” or “bear” sentiment cycles. Given the aforementioned caveat about correcting the performance of value-based indices for inflation, it stands to reason that analysis is based primarily on price/earnings (P/E) ratios. On this basis, investors most certainly know about the bear markets that came at the onset of the Great Depression (1929 to 1932) and the secondary slump that occurred from 1937 to 1941. Less familiar, however, is the historical fact that the latter half of the 1960s till about 1981 represented a 16-year bear market. And if the 18 years that followed comprised a sustained bull market, it also bears recalling that P/E ratios have generally been poor since the turn of the century.
Yet a third set of index measures examine “significant swings”, the actual range of annual dispersions. It is easy to be lulled into complacency when told that the long-run average annual change in a stock market (and therefore the indexes that summarize it) amounts to a compounded rate of just 5 percent. This seriously underestimates the volatility of market since examining single year-on-year change leads one to the conclusion that there is a greater-than-even chance that annual change will range from -16% to +16%.
“Distorted averages” brings home another lesson long forgotten from high school Algebra: when compounded rates of return contain negative numbers anywhere in the sequence, they more than cancel out the corresponding positive number in the series. Starting with $10,000 in year one, an appreciation of 15% in year 2 and a decline of 15% in year 3 is by no means neutral to the bottom line. The investor is $225 poorer for forgetting the disproportionate impact of negative growth rates, which is what happens when an index retreats. When market volatility is not a factor, on the other hand, an index that climbs from 1000 points to 1521 on the strength of a compounded rate of return of 15% three years in a row is better than volatility with average returns of 15%.
Despite the common wisdom that inflation is always good for P/E ratios, a review of historical data suggests that analysts and “savvy” investors ignore the alternative, that deflation also happens. When the U.S. Federal Reserve and Department of the Treasury rely on monetarist theory to counteract deflation (as has been happening since the second half of 2007) with lower interest rates, P/E ratios actually respond positively. It is therefore better, on the basis of empirical proof, to posit that enterprise, stock and index yields are likely to be better when price stability reigns.
Part of the statement that introduces the next section concedes that market and index performance respond in linear fashion to the state of the economy, usually taking gross domestic product as the headline indicator. This is so ingrained in conventional analysis that the reverse is also well-publicized: the confidence (or lack of it) revealed by popular stock market indices must reveal the direction the economy is taking when official monthly or quarterly reports on economic indicators are not yet ready. An analysis of average GDP, market returns and P/E ratios by decade during the last century suggests that economic growth is by no means the primary force behind market and index returns. True, growth boosts earnings (the denominator in the P/E ratio) but the data suggests that long P/E cycles correlate better with index returns. The caveat, however, is that there is an element of autocorrelation in such an analysis.
Other evidence suggests that the kind of passive management encouraged by indices (recall the aforementioned advantage of savings on transaction fees augmenting returns from indexes or ETF’s) works better in a bull market. Riding such a cycle means leaving profits reinvested and tolerating an increasing portfolio share for the equities to which the index is linked. In a bearish market such as has prevailed since 2000, a more aggressive stance characterized by frequent rebalancing may be called for. Incremental transaction costs may well be offset by superior earnings that come from moving placements from one asset class that seems to be losing steam to another that is due for an upside cycle.
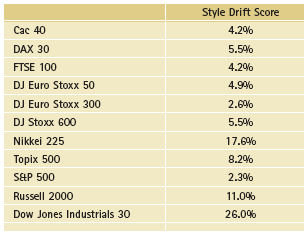
There are quite literally dozens of other indicators and approaches to analyzing market and index performance. Among these are Average True Range (ATR), Bollinger Bands, Directional Movement Indicator, Moving Average Convergence/Divergence, Volume, Momentum, Relative Strength Index, Slow/Fast Stochastic, Simple Moving Average, Exponential Moving Average, Weighted Moving Average, etc. It is, however, worth closing this section with a further caveat about being more attentive to the composition of market indexes and ETF’s. One analysis examined the stability or variability of the investment styles that underlie market indices. That equity choices for an index can be optimized with respect to size (e.g. (large or small cap) and preferred style (growth or value) is a familiar enough concept, one moreover that materially explains anticipated or actual portfolio returns. Sector choices – e.g. energy, Shari’ah-compliant finance and commodity trading, health care, “halal” food and beverages, information technology – are also important for taking an aggressive or defensive stance given the current business cycle. But it is not enough to study size, sector and style once before participating in an index or ETF. After all, the DJIA 30, by way of just one example, underwent four changes in composition during 2008-09. When a score is calculated for stability or variability of an index over time, the resulting “style drift score” (see Table 8 above) reveals marked differences among even the top market indices. In short, it pays for an investor to be vigilant about portfolio changes in the indices he participates in because these impact expected returns (e-Master paras 4-10; EDHEC Business School-Risk Institute paras2-4).
Relative Performance and Mainstream Indexes
All quantitative analyses aside, one concedes that the DJIA reflects more than just the performance of the 30 benchmark American “industrials” in the same way that the Wilshire 5000 index mirrors collective performance of thousands of domestic businesses, or the DJIM moves solely according to the collective financial performance of Shari’ah-compliant enterprises. Certainly, Berman and McCracken contend, index results also discount present and expected economic performance, domestic politics, geopolitical developments that impinge (or not) on business results, and acts of God and the common enemy (natural disasters, terrorism, even regional wars) that are, by definition, difficult to anticipate with any accuracy (1).
Given the multitude of possible influences and striving to control for such independent and intervening variables, one answer to the objective of this study can be provided by comparing the recent performance of the Dow Jones Islamic Market Index (DJIMI) and the Wilshire 5000 Index (W5000). Both are constructed around American equities. Recall that the DJIMI is the Islamic subsidiary of the Dow Jones family of indices that offers pious Muslims a Shariah-compliant financial instrument with an equity basket that specifically avoids involvement in gambling, alcohol sales, unacceptable entertainment and venues, large debt carry or otherwise unethical management. The W5000, on the other hand, covers a “universe” of 5,000 businesses, three-fourths of which would fail Shari’ah edicts.
Since the DJIMII is effectively a proxy for the kind of index limitations under which Dubai’s “Dubai Financial Market Co.” index fund operates, comparing the DJIMII with the unfettered W5000 should effectively answer two study objectives:
- Is there a difference in the performance of unrestricted and Shari’ah-compliant indexes?
- Is the DJIMII markedly less diversified than the W5000?
- If so, how did crimped diversification affect return and risk?
- How correlated are the two indices and what is the nature of their relationship?
This time series analysis covers the period July 2006 to June 25, 2010, employing the beginning-of-month closing price for both indexes. The variables in the analysis comprise compounded daily returns (based on natural log price difference, LOG Pt/Pt-1), interest rates, and yields for 90-day Treasury bills as announced in weekly auctions. The latter represents a risk-free investment when cash is preferred to equities and bonds. The econometric tools of choice include maximum likelihood equations for co integration analysis, a multivariate autoregressive model (to account for both short- and long-term movements of the Islamic Index), and stochastic analysis of both indexes (as modeled on Hakim & Rashidian 4-5).
Spillover from the US-Led Recession/Recessionary Effects
The present recession that commenced in America in the summer of 2007 spilled over to other nations, though in variable fashion (see Chapter 4). The central question in this study is the extent to which the liquidity crisis and ripple effects to gross domestic product impacted on Islamic indexes, whether domiciled in the United States or the Gulf nations.
Since the available analysis pairs consist of index values (i.e. not forcing one to compare movements stated in different currencies and thus having to account for exchange rates that also vary over time) taken over equally-spaced time intervals (having opted to focus on monthly in this paper), the applicable tools are correlation and time series analysis. Given furthermore the expectation that the data will be monotonous for consistently decreasing once the impact of the recession is evident, the primary analysis tool might well be calculating a linear function.
The presence of substantial error or “random noise” – owing to the aforementioned slew of multiple influences and independent variables – may require as supplementary steps smoothing or the calculation of logarithmic, exponential, and polynomial functions. In practice, smoothing resorts to the moving average method, calculating means or medians that combine each data point with a specified number of preceding and/or succeeding points. Unless stock market behavior evinces wild swings from one month to another (the measurement interval in this study), there will likely be no need for such outlier handlers as “distance weighted least squares smoothing”, “negative exponentially weighted smoothing” or “bicubic splines.”
Recap
This section lays the groundwork for the succeeding comparison of Islamic and secular market indexes by defining the range of analytical tools that apply. In brief, these consist of secular and co-integration analysis, compounded money return, price/earnings (P/E) ratios (to help adjust for the performance of value-based indices for inflation), being watchful about the actual range of annual dispersions, accounting for the combination of positive and negative annual returns when reporting short-term averages, and linear regression based on gross domestic product because market and index performance respond in linear fashion to the state of the economy. As well, econometric tools of choice include maximum likelihood equations for co integration analysis, a multivariate autoregressive model (to account for both short- and long-term movements of the Islamic Index), and stochastic analysis of the index pair subject of this analysis.
Impact of the US-led Recession of 2008-2010
The Construction of Stock Market Indices
Prior to assessing the spillover effects of the US housing-led recession, we give due consideration to index composition, weighting and periodic adjustment according to business realities.
Being largely based on equities, most indexes are based on large companies that are either listed on stock exchange boards or traded over the counter. As stated before, 30 of these make up the benchmark Dow Jones Industrial Average 30. The number reported is a scaled average of the prices at which the component stocks opened, peaked, and closed the previous trading day. (“Scaled average” is a weighted average when the data array is either very numerous, expressed in log scales, or in the case of equity stocks, vary somewhat during a trading period.) For simplicity, this analysis employs solely the closing prices at the beginning of the month from July 2006 (precisely a year before the U.S. slid into recession) to the latest period (June 1 or 25, 2010). The Dow Jones Company wraps the headline number in some mystique by proclaiming that “…the sum of the component share prices divided by a divisor, which changes whenever one of the component stocks has a stock split or stock dividend, so as to generate a consistent value for the index” (Sullivan & Sheffrin 290).
Table 9: Weighted Composition of the DJIA 30.
As shown by the example of the latest trading day as of this writing, IBM carries the single largest weight in the DJIA 30, not just because it is a business behemoth but because its stock price is the highest among the thirty companies. Second rank in terms of contribution to the movement of the DJIA, are such conglomerates as Chevron (energy), 3M (chemicals), Boeing (aerospace), McDonald’s (food service), and United Technologies (aerospace and building products). The assigned weights reflect the importance of industrial sectors to overall economic activity since Caterpillar (heavy equipment), for example, is valued by the market negligibly lower than Boeing, Chevron, McDonald’s and United Tech but the latter group evidently contribute more to gross domestic product.
Calculation is further refined by adding or removing components as their performance, stability or standing in industrial activity wax or wane. Each change necessitates a re-estimation of component weights so that the DJIA number remains fairly stable.
Early in 2008, for example, Altria Group (essentially the former Philip Morris USA that had diversified into smokeless tobacco, cigars, pipe tobacco, financial services, and vineyards) and Honeywell (valves, thermostats, air cleaners, fans, heaters, other ventilation products) were replaced by Bank of America and Chevron. Here, it is worth noting that Chevron had previously been part of the DJIA from 1985 to 2003. In 2008, as the OPEC-engineered price of crude oil climbed past $150 a barrel, the share price of Chevron correspondingly climbed to more than three times where it stood just five years earlier. Dow Jones speculates that had Chevron been part of the DJIA in 2003-08, the index might well have peaked at 15,000 rather than the 14,000 seen in September 2008 (see Figure 1 below).
During the worst of the recession, the giant banking conglomerates worst hit also lost their place in the DJIA. In September, a month before the government abandoned one banking combined and stepped in to save others, market sentiment had already turned against American International Group (AIG). Dow Jones replaced AIG with Kraft Foods. By mid-2009, the awful miasma in the financial sector had also begun to hurt Citigroup. Detroit’s Big Three also found themselves going hat in hand to Washington, hoping for Federal bailouts of their gargantuan losses. Accordingly, The Travelers Companies and Cisco Systems supplanted Citigroup and industry leader GM.
For its part, the Financial Times 30 (FT 30, distinct from the FTSE 30) comprises the most actively-traded issues and such UK industry leaders as British Telecommunications (LSE: BT.A), Tesco (domestic retail chain leader and second in the world after Wal-Mart), the long-established Imperial Chemical Industries (LSE: ICI) and Electric and Musical Industries Ltd (LSE: EMI, better known as the record label group and producer as well of music playback equipment). In contrast to the Dow, the FT 30 average is calculated simply by adding the component share prices on the last trading day/period without any weights. The calculation method is termed “adjustment-based” for being based on stock price changes from the previous trading day at closing. Hence, the FT 30 index is arrived at in the form:
T_Ind = Y_Ind x 30√( tod_1/yes_1 x tod_2/yes_2 x……. x tod_30/yes_30 )
where:
This creates some inconsistencies when used as a benchmark for other institutional and personal portfolios. Another difference vis-à-vis the FTSE 30 is that the Financial Times Statistical Editor bears the sole responsibility for calculating the FT30 while London Stock Exchange committee jointly calculates the FTSE 30.
Other notable differences include the fact that the FTSE 30 employs market capitalization (and is weighted accordingly) just as the DJIA does. The FT 30 has a more stable trend line since the Statistical Editor prefers to introduce replacements only when component companies collapse or merge with another. After all, thirty equities means it is sensitive to one or two having had an outstanding day while the number is large enough to average out upside or downside momentum. In practice, only three FT 30 constituents needed changing over the first three years of this decade, by way of example. Moreover, the manual calculation method available in 1935, when the FT 30 was launched, as well as the British practice of announcing index levels every quarter or so limited the size of the index. On the other hand, the FTSE 30 and FTSE 100 (the largest UK companies by market cap) are much more dynamic in reflecting business performance, importance to the economy and favorable or adverse developments. In just one quarter, the FTSE 100 might experience up to ten changes. On the whole, it is therefore conceivable that the FT 30 is a useful benchmark for the passive-management minded investor while the FT 100 likely appeals to investors that actively monitor their portfolio.
When constituents need to be replaced, the criteria for inclusion in the FT 30 reveal a degree of bias toward income over growth. The new entrant must not only represent but also lead one of the important sectors in the UK economy (while prudently limiting the companies from the largest sectors so that the diversity of industrial, service and commercial sectors is preserved). The stock should be broadly held and trading reasonably active. UK-based or –originated firms are preferred, as are those fairly well insulated from overseas price pressures. In practice, this means that a replacement company has most likely been a component of the FTSE 100 to merit consideration for the FT 30.
As in America, the evolving nature of the economy naturally positions investors relying on index-linked funds to take advantage of vibrant, new growth sectors. Heavy industry (e.g. the textile industry so important to Britain in the 19th century) have gradually been displaced by the service trades and coalmines vanished when nationalized. Conversely, the privatization of British Telecom and British Gas ushered their entry. The discovery of the North Sea oil field paved the way for the first energy stock, British Petroleum, in 1977. And the finance sector gained recognition at last with the entry of National Westminster Bank at the end of 1984.
The screening criteria for the Dow Jones Islamic Markets Index have already been discussed. The DJ Group has also spun off the Islamic Market International Titans 100 as a dollar-denominated, “free-float, market-capitalization weighted and each component’s weight…capped at 10% of the index to avoid overweight of one single stock. The index composition is reviewed annually in June. The index is also reviewed on an ongoing basis to account for corporate actions such as mergers, de-listings or bankruptcies” (CME Group Index Services 2010b para 4).
The Impact of the Present Recession
In 2004, the United States had just begun to recover from the collapse of the “dot-com” bubble that prostrated the economy in 2001. Reckoned in 2005 dollars (see Table 10 below), real gross domestic product (GDP) had recovered to an annualized rate of 3.6 percent when speculation in residential mortgages triggered another slump for which there is no end in sight yet.
Table 10: Gross Domestic Product, Percent Change From Preceding Period.
The pace of economic activity slowed from 2005 to 2007, first to 3.1 percent year-on-year, lower still to 2.7% and 2.1%. On a quarterly basis, the danger signs were already evident in the Spring and Summer of 2006 when the pace of economic growth plummeted to 1% or less. The usual holiday quarter spending masked the pace of decline at the end of 2006. But by the fourth quarter of 2007 and all of 2008, it was official: at least six months of continuous decline meant the country was in a recession. Another pick-up in holiday spending at the end of 2009 rescued retailers from the doldrums but GDP “growth” remained very low at between 2.2% to 2.7% in the preceding and following quarters. Official Washington blustered that the recovery was on but unemployment figures told a different story. Month by month, the pace of unemployment and lay-off’s accelerated. February 2008 saw 63,000 jobs lost, a five-year record. The monthly bloodletting nearly tripled to 156,000 employees let go In September that year and tripled yet again at a monthly rate of more than half a million just two months later. Up to December, fully 2.6 million jobs were lost. The toll grew worse, with the number doubling to 5.1 million unemployed counted from the start of the recession.
This month (June 2010), the Bureau of Labor Statistics cheerfully announced that 431,000 jobs had been added to the economy in May while admitting that 411,000 were temporary hires for the national census survey. Unemployment officially remained at no fewer than 15 million persons.
The head of the U.S. Federal Reserve admitted recently that recovery, when it does come, would be long and painful. Unemployment and lay-off’s may have been a major factor but shell-shocked consumer confidence is undoubtedly key to the fact that private consumption expenditures fell for the first time in two decades. This recession has clearly wrecked havoc, leading some to call it the worst since the Great Depression of 1929-32.
The housing bubble and its collapse affected a much wider segment of the population than did the overheated speculation in e-commerce (the famous “dot-coms”) of 2000 and 2001. Earlier in the decade, most of those who lost their investments in Internet-based ventures were venture capitalists and some imprudent banks. In the present case, the sustained rise in residential prices and institutional eagerness to get a fair share of the apparently-infinite subprime-mortgage market rippled throughout the entire banking sector and even attracted an astounding torrent of funds from overseas.
In the ten years ending in 2006, average prices for new residences more than doubled. Between 1982 and 2001, median residential prices stood at around 3 times median income. In 2004, the overheated market became evident when the home-price-to-income ratio climbed to 4.0; two years later, this had risen even further to 4.6. Homeowners responded by taking on more debt, either to refinance at better interest rates or obtaining second mortgages to finance such things as travel, leisure or education. As long as home prices remained high, this was fine. However, median incomes were not rising to keep pace with new debt loads. By the time banks confronted the reality of very risky, subprime mortgage takers unable to service their loads, the long bull market in middle- and upper-middle class housing also ended. Residential prices fell and homeowners now found themselves servicing mortgages substantially greater than the present market value of their residences. At the same time, unemployment loomed and the middle-aged saw both pension funds and individual retirement accounts eroded by a stock market in decline (see Table 11 below). Consequently, personal consumption expenditures retreated and stayed there for the time being.
Being unable to collect their total exposure to both market segments of the market, banks faced a liquidity crisis that seriously hampered their capacity to accommodate vital loans to manufacturers, including the credit lines and import/export financing that are the lifeblood of business. Interbank lending dried up since banks were uncertain about the amount of high-risk, subprime mortgages and related securities their peers had on their books. In just two years, from 2004 to 2006, U.S. interest rates climbed rapidly from 1% to 5.4%. Between rising interest and lower property values, homeowners found the cost of servicing mortgages disproportionate and burdensome. Consequently, defaults on mortgages climbed as never before.
The first harbinger of institutional collapse came as early as April 2007, when subprime mortgage specialist New Century Financial filed for bankruptcy and let go half its workforce. By July, the investment bank Bear Sterns shocked investors in two of its hedge funds by admitting that the all the money had essentially evaporated. The following month, French counterpart BNP Paribas disclosed much the same thing, albeit in obtuse fashion. The European Central Bank started to inject fresh funds, as did the central banks of the United States, Canada, and Japan. The Bank of England followed suit in September. In October 2007, three of the world’s largest financial institutions (Union Bank of Switzerland, Citigroup and Merrill Lynch) announced an aggregate $51 billion in losses or exposure to subprime securities. By early 2008, the epidemic had publicly spread to those companies that ensured bonds, including the now “toxic” MBS and CDO. JP Morgan absorbed Bear Sterns for just 1.3 cents on the dollar.
Along with the collapse of Bear Sterns came the end of the pure-investment bank. This was the price of the U.S. government absorbing “toxic assets” (the high-risk subprime mortgages and associated securities) to the tune of at least $700 billion. From July to December 2008, rescues were mounted for Fannie Mae, Freddie Mac, Citigroup, AIG and Detroit’s Big Three carmakers. Lehman Brothers was allowed to collapse, mortgage lender Washington Mutual closed its doors, and Bank of America absorbed Merrill Lynch. Across the Atlantic, much the same was happening. In Iceland, all three leading banks collapsed.
Loans for purchasing new cars also dried up, degrading dealer sales of domestic and foreign car makers alike. Unable to sustain revenue inflows, the car assemblers had to retrench, lay off employees, and even go into bankruptcy. Among them, banks, car makers and home construction/furnishing have significant multiplier effects on the economy. Thus, the disaster that befell them rippled throughout the nation.
The other phenomenon that marked the current recession was downright foolhardy speculation in options and derivatives underlain by fundamentally weak subprime mortgages. At one point during the housing bubble, it was estimated that as much as $70 trillion in foreign funds (chiefly of the fixed-income variety) joined the feeding frenzy for a share of mortgage-backed securities (MBS) and collateralized debt obligations (CDO). After all, the market value of homes as collateral was high and the returns on subprime mortgages certainly better, in the eyes of fixed-income funds, than U.S. government Treasury bills.
When the value of foreign fund placements essentially evaporated, a liquidity crisis spilled over across the Atlantic and nations that had eagerly aspired for financial hub status in boom times. Banks in Germany, France, the UK, Belgium and even as far afield as Australia and tiny Iceland feared collapse and appealed to their governments for quick and massive injections of cash to help them survive. The Federal Reserve and European Central Bank both dropped key interest rates to record lows in a vain effort to spur liquidity. The UK government had to provide £400 billion fresh cash in return for preferred shares in the eight largest banks and building societies.
But the disasters that befell even the biggest U.S. banks remained fresh in the thinking of those that survived and these held back on reviving interbank lending. Much was made of “stimulus funds” in the hundreds of billions of dollars on both sides of the Atlantic, mindless of what these would do to deficits far into the future. The UK’s Northern Rock bank suffered such a loss of confidence that a run resulted and the bank was nationalized, just as Bear Sterns was.
The shrunken American economy also depleted foreign trade. As a result, countries like Japan and Singapore that depended on trade with the U.S. also slipped into recession. Other trading partners, e.g. China and the Philippines, slowed down. As a consequence of the crippling liquidity and trade effects, many countries fell into recession in 2008, mere months after the economic malaise became official for the U.S. at the end of 2007.
Even before the bank rescues mounted in the U.S. in September and October of 2008, the signals of a deteriorating economy had already eroded investor confidence in the DJIA, the UK’s FTSE 100 and Japan’s Nikkei index (see Figure 1 alongside).
The DJIA is an imperfect barometer of the business climate. The index was late to reflect the ongoing recession. But when adverse developments occurred within weeks of each other and clarified the depth of the sub-prime mortgage trap into which America had fallen, the benchmark index dropped precipitously until it hit a low equal to about half its peak value.
Even when GDP had already started to fall during the summer quarter of 2007, the Dow Jones Industrial Average continued to reach record (closing) highs of 14,164.53 on October 9 and an intra-day peak of 14,198.10 on the 11th. At that, the DJIA had grown rapidly from around 11,000 a scant twenty months earlier, a phenomenon explained on the basis of a robust ICT and technology sector, anticipated corporate takeovers, inflation being under control, and consequently little incentive for the Federal Reserve to raise key interest rates (an important cost of doing business).
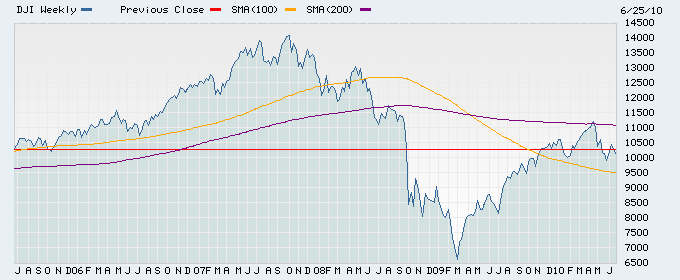
By November that year, the DJIA began a long slide, in tandem with deteriorating GDP, that culminated only in February 2009. In September 2008, the axe was about to fall on many of the most established names in Wall Street. This started with Lehman Brothers and its Chapter 11 filing. At the same time, OPEC set a new benchmark price for crude oil at a historical $150 per barrel. In response, this Dow index shed 500 points in a single day of trading (Sept. 15) and therefore remained more than 3,000 points below the historic peak of October 2007. The bank closings, rescues and national-izations that ensued later in the month and in October 2008 precipitated the Emergency Economic Stabilization Act of 2008 to the tune of (officially) $700 billion. This spate of catastrophes dragged the DJIA even lower. In one particularly disastrous trading session (November 2008), the DJIA lost more points than at any other time in its history, swung the other way in record fashion and closed at 7,552.29, the lowest since the recession of 2001. As the year ended, the DJIA recovered somewhat, to around 9,000, but even this had not been seen since the Great Depression.
Table 11: DJIA Monthly Performance, July 2006 to June 2010.
In early 2009, the politically-inspired proclamations of a “light at the end of the tunnel” proved decidedly hollow in the face of reality. GDP remained negative for two more quarters. Combined with a banking sector still crippled by illiquidity and the first signs of an electorate doubting the ability of the new administration to stem the tide, grim economic fundamentals sliced fully one-fifth of the DJIA value in just 6 weeks and drove the index to a new intra-day low of 6,470, not seen since Spring of 1997. Later in the year, however, GDP seemed to be stabilizing and this helped the Dow break the benchmark level of 10,000 again in November.
As the period under review ends, one sees that a passive investor who had remained with the index after the high in mid-2007 would have lost 40% of the value of his portfolio. Officially, if one were to believe the St. Louis Federal Reserve, the nation and the rest of the Group of 8 was already firmly on the road to recovery. But the Dow was not so easily persuaded. March 2010 saw a rebound to close on the 10,800 level and even reached 11,200 a month later. In May, the Dow swung like a pendulum again, recording its worst intra-day loss to fall below 9,900; the subsequent rebound to 10,400 was cancelled out when the DJIA sank below 9,800 on June 7, 2010. Plainly, a still-moribund housing market, new economic and debt crises erupting in Portugal, Spain and Greece, the news that Chinese banks were now asking for government dole-outs, and the continued overhang of the Dubai World/Nakheel crises gave investors pause that the worst was not yet over.
Comparison with past recessions invites continued uncertainty. When the Dow crashed during the Great Depression, the DJ 30 lost no less than 86% of value and still trended downward 840 days (four years) later. During the recession triggered by the OPEC-engineered oil shock of 1973, the S & P 500 lost half its value over a two-year period but rebounded soon thereafter. The same index took three years to hit bottom, shedding half of aggregate value yet again, during the 2000-2001 recession triggered by the technology sector and “dot-com bubble”. Nor did the S & P 500 ever recover to its highs of two-and-a-half years previously. In the current recession, the S & P 500 saw aggregate value slashed by over half but the bottom was apparently reached after just over a year. There is no telling whether the current upswing, recovering about 12% from the trough, will continue or become unsettled yet again.
Comparison Between the Conventional and Islamic Indexes
Another general market index, much broader because it captures the movement of the 5,000 largest US businesses and therefore absolutely unrestricted when it comes to Shari’ah principles is the Wilshire 5000 (Yahoo Finance 1). The index is also published by Dow Jones.
Table 12: The Wilshire 5000 Index, July 1, 2006 to June 25, 2010 (Source: Yahoo Finance).
Like the DJIA 30, the W5000 did not immediately reflect the slowdown in the economy. The latter was still reaching for highs of just under 16,000 in October 2007, when the current recession was already a fact of life for at least one quarter. The W5000 paralleled the DJIA in falling more than a thousand points by March 2008, staging a marginal recovery in the next two months, and subsequently free-falling to less than half its peak value in February of 2009, the same month the DJIA hit rock bottom. The W5000 had taken fifteen months to move from peak to trough. At this time, the index seems well on the way up, attaining a 62% recovery from its worst level but still 23% off its peak at the start of the recession.
Table 13: JETS Dow Jones Islamic Market. International Index Fund (JVS).
Before the current recession started the Dow Jones Islamic Market International Index Fund (DJIMII, also Jets or JVS for short) moved along a narrow band between 2,666 and 2,678, showed every sign of testing the 3,000 ceiling and proved amazingly countercyclical many months into the recession. In May 2007, the DJIMII had broken through the next level to reach 3,095. For five more months, this Shariah-compliant index moved in tandem with the better-known DJIA and the W5000 to peak at 3,591. Thereafter, it diverged from the two other indices for some time. The DJIA and the W5000 went on a more or less uninterrupted freefall to reach bottom 17 months later, in early 2009. In contrast, the DJIMII moved sideways and reached a new peak of 3,731 in June 2008 before yielding to market momentum and slipping below the 2,000 level (1,785 points or a 52% drop in value compared to its peak, much as the two other indices did) on March 2009. Subsequently, the Islamic index demonstrated real resilience in returning to 2,974 in April 2010 without any wild oscillations along the way.
Table 14: Past-Year Performance of the Dubai Financial Market Co. Index Fund (Source: Zawya 1).
Where an Islamic fund domiciled in the Middle East and Shariah-compliant is concerned, the sole accessible data for Dubai Financial Market Co. goes back just one year. “Dubai Financial Market General Index is a capitalization weighted price index comprising stocks of listed companies, whose primary listings debuted on DFM on or after January 1st, 2004. The base value of the index is 1000 as at January 1st 2004” (Bloomberg 1)
The available data nonetheless reveals the effect of overheated expansion that finally faced up to reality when the emirate requested creditor-banks, most foreign, for a moratorium on the borrowings of government subsidiaries Dubai World and Nakheel. For sometime, Dubai had spread itself thin in an effort to be the tourist, transport, and financial hub of the Gulf. The world’s longest, computer-controlled mass transit system was already on its way to completion, golf courses and resort hotels had been constructed, Nakheel built an ambitious hotel complex offshore that resembled palm trees from the air, and there had been no lack of concerts and sports events that could attract the well-heeled. A year after the property bubble in Dubai had burst and scant months after topping off the tallest building in the world (Dubai World’s Burj Khalifa), the crisis of confidence threw fresh doubts on the stability of incipient recovery in many of the world’s economies.
Shares in the Dubai Financial Market Co., the index fund for the local stock market had opened with an offer price of 1,000 dirhams in January 2004. Table 14 above shows that the index had climbed to a peak of 2.68 points on October 14, 2009 and strayed no lower than 2.50 until late in the month. Some foreknowledge may be evident in the fact that the index opened in November at just 2.14 and closed no higher than 2.38 the rest of the month. By then, the debt re-scheduling involving at least $36 billion was announced unilaterally. In the ensuing months, the index dropped as low as 1.41.
In the absence of comparable data for domestic Islamic-nation market indexes, the JETS Dow Jones Islamic Market International Index Fund (DJIMII/JVS) is presented here as the proxy measure for an Islamic Index that is as international in scope as the Dow Jones Industrial Average 30 or the Wilshire Index. We first test the relationship between the DJIMII and the more established DJIA 30.
Table 15: Summary Statistics: JVS vs. DJIA 30.
This scrutiny of measures of central tendency and dispersion helps one see if the twin data sets are fairly stable. For the period July 2006 through June 2010, the mean and median for the JVS stood at just under 2,900 index points. This is understandably far lower than obtains for the DJIA 30 since the latter has had more than a century of stock price inflation behind it. Similarly, the ranges are far wider for the Dow Jones Industrials.
Table 16: Correlation Between DJIA and JVS.
Notwithstanding the great disparity in index values, the calculation for Pearson’s r yields a high correlation value of 0.84. This is high for “real-world” data, given that the maximum value is 1 when two data sets move simultaneously.
Proceeding to compare the DJIMII to the unrestricted Wilshire 5000:
Table 17: Summary Statistics for the Wilshire 5000 and the JVS.
Again one finds a large disparity in the measures of central tendency and dispersion principally due to the fact that the W5000 bears index values that range between 7,474 and 15,673 index points for the period under review. However, the telling fact is that both time series are equally cohesive since their standard errors are within 2.6% of their respective means while ±1 standard deviation (up and down from the mean) is the same at roughly 36%.
Table 18: Correlation between W5000 and JVS.
Similarly, the calculated value for Pearson’s r stands at 0.82, nearly the same as that found for the DJIA 30-JVS pair. There is a positive and fairly close relationship between the two indexes.
Table 19: Variables Included in Regression Calculation.
We next test the hypothesis that the unrestricted indexes DJIA 30 and Wilshire 5000 have an effect on the Shariah-compliant DJIMII. For this, we employ a multiple regression model where the Islamic index is the dependent variable and the unrestricted indexes the independent variables (Table 19 reveals the model output that shows which variables were included in the regression run. “Method” shows as “Enter”, meaning that this preliminary model does not resort to stepwise regression: entering the independent variables (IV) one at a time to see how each succeeding IV improves model fit.
Table 20: Regression Model summary.
Table 20 above yields the first evidence that employing the unfettered indices to predict what happens to an Islamic index is a sound idea. The relationship is not perfect but the R value of 0.843 reveals a high correlation between the real-world values of the Islamic index and the predicted values employing solely the independent variables. Next, the R2 (R-Square) result suggests that the regression model employing both DJIA 30 and Wilshire 5000 predicts nearly three-fourths of the movement in the DJIMII Islamic index. This is an eminently good result. Adjusted R2 is nearly as high, suggesting that the two explanatory variables are by no means extraneous.
Going by the breakdown of the total model variance into those explained by the regression variables and those unaccounted for, Table 21 (overleaf) suggests the two IV’s are good choices for explaining more than twice the variance that other variables unaccounted for might (e.g. random voter sentiment, interest rates, political issues, etc.). In statistical terms, the latter is referred to as the all-encompassing residual or “error term.”
Table 21: Result for ANOVA Portion of Regression Model.
The “df” column in Table 21 stands for “degrees of freedom”. This is really just the number of variables in the regression equation less one. The number affects how large the F value must be to be to be statistically significant. In this case, the F value of 55.29 is so high it is associated with a significance statistic p < 0.001. Since the ANOVA tests the null hypothesis that all model coefficients equals zero and have no effect on each other, the derived p value means there is less than one chance in 1,000 trial runs with similar index data that the computed coefficients occurred by random variation alone. In short, the two unfettered stock market indexes do have an influence on the Islamic index.
Table 22: The Model Coefficients.
a. Dependent Variable: Islamic Index
Finally, table 22 in the previous page quantifies the model equation itself. Substituting the values into the hypothesized linear regression model, one gets:
Y = a + b1X1 + b2X2
Where Y = the predicted value of the Islamic index, a = the intercept or the level of Y when all IV’s amount to zero, b1 = the slope or extent of influence exercised by the X1, Dow Jones 30, and b2 = the influence exerted by X2, the Wilshire 5000 index. Substituting, the calculated linear function is:
Islamic index value = 133.42 + 1.37 (DJIA 30) – 0.53 (W5000)
This means that from a base value of about 133.42, the DJIMII should rise by 1.4 index points for every point rise in the Dow Jones 30 but decline by half a point whenever the Wilshire 5000 index moves up by one index point.
Table 23: Descriptive Statistics.
Since there was a great deal of uncertainty around equity holdings during the period under review, it stands to reason that 90-day T-bills proved more attractive than either the W5000 or the Dow Jones Islamic fund index. The annualized standard deviation is a measure of risk volatility. Naturally, T-bill risk is virtually zero and the DJIMII is slightly less risky than the Wilshire 5000. Such an evaluation is confirmed by the risk per unit of return (the Sharp ratio): an Islamic fund turns out to be competitive with T-bills in being less volatile than the widely dispersed W5000 basket of equities, which bears about 64% more risk (Hakim and Rashidian 5).
Table 24: Tests for Unit Roots.
Table 24 reveals the results of the augmented D. Fuller root test. This test of stochastic properties suggests that the Dow Jones Islamic fund is just as unpredictable, i.e. behaves with just as much random volatility as the rates of return for the Wilshire 5000 and T-bills.
Table 25: Tests for Cointegration.
Next, we employ co integration to augment the original linear regression analysis because the latter has been shown to produce spurious correlation owing to the assumption that either one or both time series are stationary as to levels. Co integration is most useful for integrated-process time series that contain a unit root, e.g. the “random walk” typical of stock market (and therefore, also index) trends. But when unit roots render coupled time series non-stationary, the situation can be reversed linear transformation of differencing, e.g. xt − xt−1 = ∆xt. Investigating co integration among the three time series with the full information maximum likelihood procedure of bi- and tri-variate modeling, one would express the functions as:
Trivariate: {DJIMI, W5000, Tbill}
Bivariate: {DJIMI, W5000}, {W5000, Tbill}, {DJIMI, Tbill}
Settling on a lag profile of 28 trading days, and testing the null hypothesis that co integration is absent, Table 25 suggests that there is a single and statistically significant (p < 0.05 because the likelihood ratio 37.3 exceeds the required hurdle of 34.9%) for the trivariate case. For the bivariate cases, only the pairwise test between the Wilshire 5000 and T-bill interest rates exhibit a long-term link. That the DJIMII and interest rates bear no stochastic link with each other is explained by the rigid screening of equities according to non-economic criteria. Recall, as well, the Shari’ah-based proscription against companies earning more than 5 percent of revenue from interest rates. It stands to reason then that companies taking advantage of T-bills to maximize returns on cash reserves would never be selected for an Islamic index.
Table 26: VECM and Test of Causality.
Co integration among all three time series under review means that there must be causality. Given the overarching objective of this study – to investigate whether movement of the Islamic index can be explained by the two other non-compliant indices – one tests for causality and the result is shown in Table 26. Causality is presumed when the present level of ΔW5000 or ΔDJIA30 effectively predicts ΔDJIMII, albeit with some lag value built in. Then we are back to the familiar question of whether a lagged value of the two other indices is a strong enough predictor for the present value of the Islamic index. Estimating the proper vector error-correction model (VECM) in the form:
Δ (DJIMI) = a0 + a1 L Δ (DJIMI) + a2 L Δ (W5000) + a3 L Δ (Tbill) + a4 L EC + ε1
Where L = lag operator, EC = error correction term, ε = the residual or disturbance term.
The VECM result affirms that, for the chosen lag term, neither interest rates nor the W5000 explain movements in the Islamic index with any degree of statistical precision/significance.
Results
Shariah Indices have performed better than their conventional counterparts throughout the credit crisis. Over the last eleven credit-crisis challenged quarters, the MSCI World Islamic Index has delivered a good track-record with lower volatility than the MSCI World Index. However, it is not just this out performance in volatile times that speaks positively for Shariah Investing but its performance across a full market cycle. Moving into the third quarter of 2009, the assumption was the alpha that Shariah Indices have built up over the credit crisis would begin to give way as markets and financials in particular moved into recovery. August and September saw equity markets across the world rally and perform strongly. Across these months we saw Shariah Indices underperform their conventional counterparts. However, single months of the conventional indices rallying have not dampened the strong absolute performance of the Shariah Indices. Considering the MSCI World Islamic Index versus the MSCI World Index back to January 2004 (see Figure 1), we see that as of the end of September 2009, the Islamic Index still strongly outperformed but also that it has performed consistently well through a bull and bear market.
MSCI World Index vs. MSCI World Islamic Index 01/01/2004 to 30/09/2009
As a result, we saw the MSCI Islamic Indices underperformed on average their traditional MSCI counterparts in August 2009. August saw the MSCI World Islamic Index return 0.72% and the MSCI World Index return 1.93% for the month in US Dollar terms. In September the MSCI World Islamic Index edged ahead of the conventional as a higher level of volatility returned to the markets with investors retracting slightly away from financial stocks amid fears that they had rallied too far too fast. Additionally the broad expectations of recovery have bolstered the Shariah preferred sectors such as manufacturing and health care. September saw the MSCI World Islamic Index return 6.03% and the MSCI World Index return 5.82% for the month in US Dollar terms.
Over the Longer Term Shariah is Still Ahead
The MSCI World Islamic Index is still posting strong absolute performance. Whilst the conventional index has edged forward and year-to-date has returned 19.95% compared to the Shariah return of 16.82% in US Dollar terms as of end September 2009, this switch in leadership has only come about in the last two quarters. Over a longer time period, 1 January 2004 to 30 September 2009, the MSCI World Islamic has significantly outperformed the MSCI World by over 15%. This goes to show that the Shariah investment approach is not just one for the credit crisis, as some critics have tried to dismiss, but also has merit through a strong bull market, especially a period in which the financials sector performed strongly, albeit fell strongly in the end.
Conclusion
“The beauty of Islamic banking and the reason it can be used as a replacement for the current market is that you only promise what you own. Islamic banks are not protected if the economy goes down — they suffer — but you don’t lose your shirt,” said Majed al-Refaie, who heads Bahrain-based Unicorn Investment Bank.
First, it should be noted that Islamic indexes were less affected by the crisis than traditional banks. This is because Islamic banks do not buy financial papers based on debts, let alone usurious debts. So, they are far from being affected by bad debts; there is no possibility that they might be affected by the traditional institutions that were led to bankruptcy. However, one also has to note that the Islamic banks that dealt with traditional banks through goods murabahah (Islamic partnership) have in their budgets billions of dollars worth of debts to be paid by both international and regional traditional banks.
Still, the Islamic banks that had invested large amounts of money in global stock markets have also been affected by the crisis, owing to the collapse of these markets. The clients of these banks have been affected as well. They lost large sums in stock investment funds. It should also be noted that it was fortunate that these funds had been far from the stocks of the traditional financial sector and other sectors more influenced by the crisis.
There is deep-seated confidence in the correctness of Islamic finance in terms of its adherence to funding by sales, leases, and partnerships, and in terms of its avoidance of loans of all types, given that they are a method of finance that takes finance away from the real market of production and exchange. Likewise, there is ingrained confidence in the principle of rejection of circulation or securitization of debts. These are the most important guarantees that a financial system will not slip into a crisis.
There is a need for reviewing the systems of financial markets in Muslim countries, with the aim of limiting financial speculations by laying down restrictions on their different types and also by banning the transactions that do not involve real investment. It is to be known that the systems applied in some Arab and Muslim markets do not allow many derivatives, which is one of the most important causes of the crisis.
It is necessary to revise many views and opinions, especially those practices falsely labeled “Islamic,” such as the so-called short-term sale, derivatives and dealings on the same day, markets of caution, mudawalat (speculations) via the Internet using currency, and so forth. These practices facilitate the prevalence of the mentality of quick profit and encourage — albeit implicitly — the spirit of selfishness and financial speculations that do not increase production or create any added value.
Principles of Islamic finance should be presented to the world as part and parcel of the true image of Islam, whose message is directed to all humankind — a mercy for the worlds. These principles are not specific to Muslims; they are principles of Islam, which is a universal religion. In fact, throughout the ages, these principles have always been known and practiced in all communities in their exchanges and transactions, though some financial dealings and speculations have marred them. Above all, these Islamic principles are required by the scientific, logical analyses of economic and financial systems and by the principles of human rights, notably the right to reaping the fruits of one’s own property and the right to protection against encroachment upon the personal property of those benefiting from funding. This is the meaning of justice and elimination of oppression. It is the meaning that is constantly stressed by all the rulings and branches of Islamic Shariah.
Recommendation
Employing two statistical approaches has yielded contrasting findings. The regression function suggests that an Islamic index responds with alacrity to a select basket of thirty American equities but is likely to move in inverse fashion to movements in an index with a very large number of equities and no screening for Shari’ah compliance. Without presupposing that the Wilshire 5000 is more representative of confidence (or lack thereof) in American industry at large, one may concede the possibility that the selective coverage of the DJIA 30 parallels the growth-income balancing act required to construct an equally selective Islamic index. Equally likely is the hypothesis – given the recent removals of Altria Group (essentially the tobacco business of Philip Morris USA plus a diversification into wines), AIG, and Citigroup – unwittingly aligned the DJIA 30 with the socially-responsible bias of Shari’ah-compliant investors and indexes. At the same time, the return of Chevron to the headliner Dow Jones roster surely matches the affinity of the Gulf Arab mind for viewing energy businesses favorably.
References
All Star Investor. JVS: First Islamic ETF Comes to Market. 2009. Web.
Berman, Dennis K. and Jeffrey McCracken. “CME Buys 90% of Dow Jones Indexes”. 2010. The Wall Street Journal. Web.
Bloomberg. DFM General Index. 2010. Web.
Browning, E.S. “Travelers, Cisco Replace Citi, GM in Dow”. 2009. Wall Street Journal (Dow Jones & Company). Web.
Bursa Malaysia Berhad. Islamic Markets. 2010. Web.
CME Group Index Services, LLC. “Dow Jones Indexes.” Dow Jones Indexes. 2010a. Web.
CME Group Index Services, LLC. “Dow Jones Indexes Launches Dow Jones Islamic Market International Titans 100 Index.” Dow Jones Indexes. 2010b. Web.
Dow Jones Indexes. “Dow Jones Islamic Market Indexes Index Review Results: 1st Quarter 2010.” 2010. Zawya. Web.
Dow Jones Industrial Average. “Index Data, Past Five Years.” 2010. Dow Jones Indexes. Web.
Dubai Financial Market. “World’s First Islamic Market.” 2008. MondoVisione: Worldwide Exchange Intelligence. Web.
EDHEC Business School-Risk Institute. Assessing the Quality of Stock Market Indices: Requirements for Asset Allocation and Performance Measurement. 2006. Web.
e-Master Trade. Neural Network Technical Indicators Forecasting. Undated. 2010. Web.
Glenn, H. Patrick. Legal Traditions of the World. London: Oxford University Press, 2007.
Hakim, Sam and Manochehr Rashidian. “Risk & Return of Islamic Stock Market Indexes.” 2007. Economic Research Forum. Web.
Henry, Clement and Rodney Wilson. The Politics of Islamic Finance. Edinburgh: Edinburgh University Press, 2004.
Kuo, David. “The First Stock Market Index.” 2006. News and Analyses: The Motley Fool. Web.
Kuran, Timur. “The Logic of Financial Westernization in the Middle East.” Journal of Economic Behavior and Organization, 56 (2005): 600-605.
Malkiel, Burton G. A Random Walk Down Wall Street. New York: Norton, 1996.
Money-Zine.com. “Stock Market History.” 2008. Web.
Sharpe, William F. “Indexed Investing: A Prosaic Way to Beat the Average Investor.” 2002. Presented at the Spring President’s Forum, Monterey Institute of International Studies. Web.
Sukuk Holdings Ltd. What are Islamic Funds? 2010. Web.
Sullivan, Arthur and Steven M. Sheffrin. Economics: Principles in Action. Upper Saddle River, New Jersey: Pearson Prentice Hall, 2003.
World-Stock-Exchanges.net. “List of World Stock Market Indices.” Stock Exchanges. 2010. MarketWatch. Web.
Yahoo Finance. DJ Wilshire 5000 Tot (^DWC). 2010. Web.