Introduction
The model developed by Robert Solow1 (1956) aimed to estimate economic growth in terms of cross-country perspective. However, the paper by Solow written in 1956 does not discuss the pattern of growth across countries using the neoclassical growth model. Kieran McQuinn and Karl Whelan2 indicate that the Solow model predicts that the output per labor is a function of the degree of efficiency of technology. Therefore, the Solow model has two parts. First, the economy converges to a value of capital-output ratio such that the economy, capital, and output grow at a constant rate. Second, Solow assumes that the technological efficiency that determines the steady path of growth of the economy is exogenous. In other literature, as by Mankiw, Romer, and Weil3 (1992, referred as MRW henceforth) interpreted Solow’s exogenous technology as total factor productivity (TFP), which was assumed to grow at same exogenous rate across countries. Therefore, from MRW it was deduced that any alteration in TFP was due to country-specific factors. However, the assumption of MRW was not satisfactory because this would imply that any change in the output per worker would change with capital intensity. This contradicts the fundamental idea of Solow model that progress in technology actually leads to higher output per worker. Another problem identifiable in this approach is that the data suggests that there has been a substantial difference in different countries in TFP growth rate therefore leading to change in output per worker in almost all countries4. Further, other studies have predicted that Solow model does not fit certain dimensions of the data; however, the supporters of the model have rejected the argument by stating that these misfits were mainly due to the adaptation of the erroneous assumption taken by MRW about exogenous technology5.
Clearly, the debate on the success of Solow model in explaining cross-country growth is open for re-interpretation and further research. In this paper Solow model is tested to understand its effectiveness in explaining its success in explaining growth across countries. Therefore, the paper will undertake empirical applicability of the Solow model and test its applicability in both single country and cross-country empirical dataset. Further, the paper will also attempt to test the augmented growth model developed by MRW and then extend these mode to form a third model with an additional variable.
Motivation
The motivation for the study is to understand to determine the scope of Solow model in determining economic growth. Therefore, the first step would be to ascertain the scope of growth of the economy in the assumed presence of labour augmenting technology progress in the economy. This study would allow us to ascertain the perceived utility of the Solow model in predicting economic growth and help to ascertain means to augment the model by introducing other factors that may affect economic growth. Another reason for undertaking the study is to judge the growth rate of the developed countries vis-a-vis countries that are not developed in order to understand if the model is equally helpful in predicting economic growth in both the cases. Further other variables like education, human capital, investment in R&D, workers in R&D, national debt, etc. to understand the effect it has towards economic growth.
Research Objective
The debate over the validity of the Solow model had erupted since the 1980s with a group of economists who came up various theories in close connection to the neoclassical model and tried to explain the disparity in economic growth across nations. There has been various attempts to explain or disown the Solow model but to a great extent the model has been successful in explaining the growth disparities between countries where thereby indicating at the factors the trigger economic growth. However, the disparities and criticism of the model generates the need to re-test the model empirically from different perspectives in order to ascertain the effective degree of success of the model in explaining economic growth. Therefore, the present study attempts to test the basic Solow model on OECD countries. Then move on the induce other variables like human capital, technology, and then test them in accordance to the endogenous growth models in order to ascertain if the latter are more successful in explaining economic growth. Further Solow model will be tested for variations in its predictability in different regions of the world. For this purpose, the study will consider the model’s predictions for OECD and non-OECD countries. The research questions that will be tested in the present paper are –
- How effective is Solow model in predicting economic growth and what factors determined by the model are more important?
- What factors have not been included in the model that may become an important indicator of economic growth? What happens to the results of the model when some variables are controlled?
- Do Solow model predict the growth rate for different countries around the world?
Review of Literature
The Solow Model
The main predictions provided in the Solow model is that over time there will be convergence of GDP per capita for all economies with same growth in investment and labour force. The assumption that a diminishing marginal productivity of capital leads to a process of economic growth and eventually helps to reach a steady state wherein per capita output, capital, and consumption has a constant rate of growth that is equal to the exogenously determined rate of technological growth. This led to the evolution of the convergence theory that can be understood in two ways. First, in terms of income, countries with similar technological and preference factors will move towards same level of per capita income. Second, Solow considered technology as a public good, that is shared equally, and therefore, leads to a steady state of growth.
A few problems of the model as indicated by literature is that the model converges the economic growth in per capita output to zero at a constant state6. Further, in order to ensure a steady state of growth exogenous technological change was imbibed in the model. However, empirical studies failed to support Solow model as a higher rate of investment increased growth in developing countries, but according to the theoretical model, higher investment would increase output but not growth rate7.
The literature on economic growth is split into two areas – first supports the neoclassical assumption that technological change is endogenous while the other section believes that the technological change in growth is exogenous. This review of literature discusses endogenous growth model that had been revolutionized since 1990s8. One of the inherent conclusions of the Solow model is that “technological progress is at least partially endogenous to the economy.”9 In case of cross-country convergence, it is important to consider the changes in technological convergence that occurs in countries and difference in growth rate of technology and technology imbibed growth. In this respect it must be mentioned that deriving function by running a regression in the cross-sectional data of comparative national accounts does not provide expected or desired model. By taking average growth, rate as the dependent variable and several political and economic factors as the independent influencers of growth are erroneous10. Therefore, it is important to understand that change in technology is endogenous. It must be noted that increase in technology results from increased investment in R&D, but it is not simple to ascertain the production of technology from the input and output. Technology increase cannot simply determine the increase in investment in R&D, but also by the number of people dedicated towards R&D in a country. Therefore, just
Population growth is not enough to determine the difference in growth rate in cross sectional data. Romer (1990) considers technology as endogenous and is determined through decision-making process of profit making agents. According to this line of research, corporate have a vested interest in investing in R&D in order to gain monopoly power in the industry. As patents are time limited to protect innovations, they are further used for further research. This limits the firm’s capacity to capture the full rent of a monopolist as the innovations are invested in knowledge spill over.
The case of technological innovation provides firms monopoly power is an important aspect of endogenous growth theory and therefore open new question for cross-country economic growth study. First, an increase in innovation and better technology will lead to increasing returns to scale. On the other hand, a close to monopoly rent increases the consumption cost for many consumers while the cost of R&D is not dependent on the size of the economy. Further, the impetus of higher profit motivates firms to invest more for research and hence induces economic growth. Therefore, it can be deduced that with higher investment in technology, there will be a higher growth higher growth rate in the long-run. This section provides a brief overview of including technology as an endogenous factor to the development of the growth theory with endogenous technological advancement. Therefore, there has been major criticism from the endogenous growth theorists of the exogenous technology assumption of the neo-classicists.
Convergence Literature
Even though many endogenous theorists have criticised the exogenous nature of technology in the neoclassical model, there are many researches that have tested the convergence theory suggested by Solow and have augmented the model based on exogenous technology assumption.
Literature on neoclassical economic growth is full with debates over the predictions that a diminishing marginal productivity of capital leads to a process of economic growth and eventually helps to reach a steady state wherein per capita output, capital, and consumption has a constant rate of growth that is equal to the exogenously determined rate of technological growth. This led to the evolution of the convergence theory that can be understood in two ways. First, in terms of income, countries with similar technological and preference factors will move towards same level of per capita income. Second, Solow considered technology as a public good, that is shared equally, and therefore, leads to a steady state of growth.
Solow model was augmented by inclusion of other variables like human capital and physical capital11, trade and investment12, etc. MRW used Solow model to identify and explain differences in output per worker in different countries. Their study results showed that it would be early to negate the importance of Solow model as it has great potential, but it must be modified to accommodate human capital. Barro and Sala I Martin13 have examined growth characteristics of different states in the US to examine the convergence hypothesis of output per worker that had been predicted in the basic Solow model. Their study concluded that the steady state of growth in the states were characterised by the production functions of the states. Barro proposed the concept of “conditional convergence”14 and showed that the correlation between the initial income level and growth rate was negative for a large sample of cross-country data. Later it found its foundation in later works of MRW and Barro and Sala i Martin (henceforth mentioned as BS) that emphasized that the Solow model did not imply that all countries will reach the same level of income per capita. They interpreted the neoclassical models in different way and extended its interpretation by stating that countries would eventually reach its steady state of growth. Therefore, in order to conduct a cross-country data analysis it is important to control for their steady state of growth in order to attain similar convergence.
According to Solow, the steady state of the level of income of the country was determined by the growth rate of saving and workers that is considered exogenous. In addition, certain other parameters of technological change were included. In MRW study, the researchers controlled the steady state of income levels in order to infuse the savings and population growth rate in the regression. On the other hand, BS included optimal saving model of the neoclassical model and created a proxy for the underlying variables of preference and technology, and assumed uniformity in cross-sectional data. However, the BS study did not create controls for the differences in the steady state.
The literature review shows that there are various differences among economists regarding the applicability of the Solow model. On one side of the debate are a group of researchers, who believe that the exogenous example taken by Solow is valid and the model has empirical relevance, but require certain modifications. On the other hand of the debate are economists, who consider technology as an endogenous factor and therefore want it to be determined by the change in investment and income of the economy.
The Model
Basic Solow Model
Solow Model
The review of literature first provides a brief description of the textbook model of growth by Solow. Solow growth model (also known as neoclassical or exogenous model) has been used as a base line theory for interpreting cross-country growth pattern. This section presents a brief explanation of the model developed by Solow.
The model is developed around the production function with constant return to scale, capital and labour being substitutable, and diminishing marginal productivity. For simplification and pertaining to more recent research in the area, Cobb-Douglas production function is used:
(1) Y = AtKtαLt1-α
In the above equation, K is the community’s stock of capital and L is labour, and A is exogenous technology change that increases productivity of labour15. An implicit assumption of the model is based on consumption function wherein whatever is not consumed is saved and invested. The fraction of the total output that is saved, s, is termed as sY(K,L) that is assumed to be exogenous. Therefore, net investment made by the economy is the rate of increase in this capital stock that is just an accumulation of amalgamated commodity. Net investment therefore can be mentioned as increase in the stock of capital that is sY.
(2) Ḱ t = sY t – δK t
Here K is the stock of capital. Therefore, with an increase in the stock of capital over time increases the savings.
Capital output ratio can be defined as
(3) X t =![]() .
.
Therefore, the per capita output i.e. output per labour can be expressed as:
(4)![]() = A
= A![]() .
.
This is demonstrated in McQuinn and Whelan16. Growth rate of technology and the total number of labours are assumed to be g and n respectively. Therefore, the equations can be combined to form the capital output ratio as
(5) Ẋt = λ(X* – Xt),
Where
(6) λ =(1-α)(g + n + δ).
Therefore from the above equations X* can be rewritten as
(7) X* =![]()
The above equations following recent researches in growth models, provides a simplified explanation and prediction for Solow model in the long as well as short run. The convergence o the capital–output ratio occurs over period at the rate λ to the equilibrium level of s i.e. the investment rate, the technological growth rate g, the growth rate of labour i.e. n, and the depreciation rate δ. In other words, this implies that as the economy reaches its capital output ratio, the output per worker will increase at a rate of g. Further labour is considered to increase at a rate of n and technology at a rate of n. Therefore Lt and At is shown as L(t) = L(0)ent and A(t) – A(0)egt.
The main advantage derived of equation 4 is that capital output ratio is independent of the level of At. This is a better method of decomposition of output per worker as in this case the capital per worker is not positively dependent on At in long-run thus reducing the problem of detangling the long-run effect technology and non technology related factors.
In order to establish a link between capital-output ratio and output per worker, the best method is to take a log of the former that will probably display a simple convergence. There by taking a log of Ẋt/Xt to be xt then we get,
(8) ẋt =![]() = λ) ≈ λ(x* -xt)
= λ) ≈ λ(x* -xt)
This provides a simplistic character for output per worker. Further taking the log of equation 4 we get
(9) yt = at +![]() xt.
xt.
The output per worker is defined as the level of output per worker that is consistent with the capital output ratio of at the equilibrium level:
(10) yt = a t +![]() x*
x*
Therefore, from equation 8 the output per worker can be expressed as
(11) ẏt = g + λ(![]() – y t)
– y t)
Here λ is the rate of convergence of capital output ratio is also known as the “conditional” convergence rate of output per worker. Therefore, at λ the output per worker gap is closed towards its steady level. According to Solow model, growth is determined by two components – technological progress and the difference between ![]() y t. However, the changes in capital output ratio is determined only by the changes in λ.
y t. However, the changes in capital output ratio is determined only by the changes in λ.
The textbook Solow model of growth predicts that the output per worker is dependent on the rate of growth of technology, savings rate, rate of growth of workforce, capital output ratio, and the rate of convergence. Therefore the basic Solow model predicts that as there is higher savings rate, there will be positive growth of output per worker, which is corrected by exogenous technological progress and depreciation rate, and if there is a high growth of labour force, then it will have a negative effect on output per worker. Therefore, the basic model as derived in equation 11, i.e. ẏt = g + λ(![]() – y t), where ẏt is the logarithmic value of output per worker. The central prediction that will be tested in the paper is that capital output ratio and output per worker is positively related to savings rate but negatively related to population growth.
– y t), where ẏt is the logarithmic value of output per worker. The central prediction that will be tested in the paper is that capital output ratio and output per worker is positively related to savings rate but negatively related to population growth.
Methodology
The overall research methodology is segregated into three sections. The first will test the basic Solow model. Second, other variables will be included in the model like human capital, investment, aid, foreign debt, etc.
Testing basic Solow Model
Given the basic Solow model, the question that naturally arises is if the model supports empirical data. Does Solow’s predictions related to the standard of living. Therefore, the empirical test of Solow model will aim to understand if the real income per capita is higher in countries with higher savings rate and lower in countries with lower savings rate.
In order to test Solow model across countries it is necessary to introduce a factor that accounts for the changes in technological knowhow between countries. If wrong assumptions are taken regarding the technological changes in a country, the model will fail to deliver desired result, and lead to rejection of the model. This problem was first identified by MRW and a method to counter this problem was suggested.
MRW argued that Solow model did not give full attention to the long run output per worker and differences in technology across countries. Therefore, they assumed that deviations from a steady state of growth for countries are actually random, and therefore, their model studied the long run predictions of the basic model by assessing the differences between output per worker and the predicted steady state. MRW took the assumption that g and δ is assumed to be constant across various countries. Further, as g reflects the advancement of knowledge, it is not country specific, and therefore, can be considered as fixed17. Further, as there are no available data to help the calculation of country specific depreciation, it is best to hold it constant.
Following MRW a country specific shock, ε, is introduced in A(0), ln A(0) – a + ε, where a is a constant18. Thus, considering MRW’s assumption that At is not correlated to investment share of GDP and rate of population growth, then the subsequent prediction of Solow model is Therefore the log value of per capita income at any given time is
(13) ln(![]() ) = a +
) = a +![]() ln(si) –
ln(si) –![]() ln (ni +gi+ δi) + εi
ln (ni +gi+ δi) + εi
The equation 13 is derived by taking a log of equation 4 and then assuming that the economy of the country is at a steady state. The values of si and ni were simply calculated by their averages and taking the value of g+δ = 0.0519. The above equation presents the basic empirical condition for the basic Solow model to be tested on empirical data. Further assumptions taken for the study, following MRW, are s and n are independent of ε thus implying savings rate and rate of population growth are not dependent on country specific factors. Therefore, the findings of MRW suggested that the rate of change of output with respect to investment share of GDP and population growth was much higher than that demonstrated by the basic Solow model.
Other Variables in Basic Model
In this section, other variables are infused in the model in order to understand its effect on growth rate. First, human capital will be included in the model following MRW such that changes in human capital can be ascertained. Second, Levine and Renelt20 suggest that economic policy has a strong influence on the long-run per capita growth rate. Levine and Renelt suggest that fiscal policies, monetary policies, other political-stability indexes have a strong effect on economic growth.
Data
The analysis section is divided into two sections – first will test the basic and the augmented model on a single country data and check the predictions of the Solow model and see how other variables added to the model bring about changes in the model. The second section will apply the basic model on cross-country data and will check how the convergence can better be explained by inclusion of the other variables i.e. human capital and innovation stock. In this section, the variables are introduced in the model one at a time in order to see the maximum extent of its effect on convergence rate. At last, the amalgamated effect of the variables is considered.
The data for the research is collected from high-income OECD countries from the World Bank databank. The data for the study is extracted from OECD database, and information on education and school enrolment is derived from World Bank database. To test the effectiveness of Solow model the basic neoclassical growth model regression is run on one of the OECD countries i.e. Japan. Then, the model is extended in order to incorporate other variables. The data that is studied for the present study is from 1980 to 2009. The dataset that is extracted for the empirical study of Solow model are real income, government, and private consumption level, investment, and investment following MRW21.
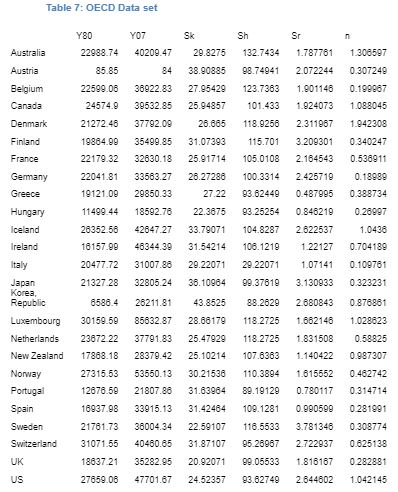
The data collected for the factors in the model are explained as follows. The paper follows MRW dataset and extracts data on real national account. The dataset that are studied are real income, government and private consumption, investment, and population22. The paper measures n as the average rate of growth of the population that has attained working age and working age is defined over 15 to 64 years23. The measurement of s is done as the average proportion of real investment, that includes both private and government investment, in real GDP. Further, Y/L is derived as the GDP in the 2007 divided by the working age population in the same year. The data that is extracted from the database are – population, GDP per capita at constant prices (CGDP), and real GDP per adult.
Data Analysis
Testing Basic Solow Model
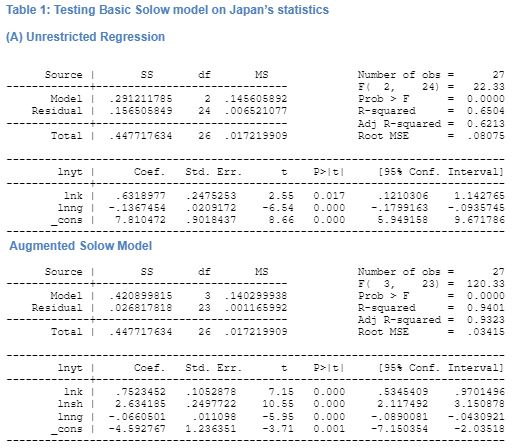
The Solow model is tested on one of the countries from the OECD data in order to understand the effectiveness of the model. To test the basic Solow model, equation 13 is used and the data extracted in tested on the Japan. First, an estimate for equation 13 is done without imposing the constraint. This is done in order to see the basic model and its effectiveness in predicting growth. Following MRW, the value of g+δ was assumed 0.05 that is expected to have little significant change to the estimate. Table 1 in the appendix shows that results of the regression without imposing a constraint. The result shows that the total number of observations is 27 i.e. from 1980 to 2007. The data shows that R2 for the regression is found to be 0.0757 and the coefficient for the log (n+g+δ) is found to be 5.44. From the regression, it is clear that the coefficient for population growth and savings are as demonstrate for the study in MRW. The data shows that both the variables have expected signs as predicted in the Solow model. Further, these results are highly significant for the results in Japan. Further, the restrictions restriction that had been imposed on ln(n + g +δ) are found to be equal. The R2 for the regression is 0.175. The regression shows that the claims of the Solow model that technological change amounts for the maximum of the changes in growth. The analysis shows that for Japan, the test of the model shows that with increase in savings there will be a lowering of the output per worker. This finding confirms the prediction of the Solow model. In addition, the growth of population is found to have a positive effect on the output per worker. Further, the regression analysis shows that the change in technology is positive, thus indicating that with increase in investment in technology there will be an increase in the growth of the country, a claim that had been reiterated from the Solow model. The value of α that has been derived from the regression is 0.643 that is slightly higher than that of MRW.
The findings of the regression demonstrate that the strongest variables that affect growth per output in the Solow model are growth of population, change in technology, and savings. The magnitude of the coefficient of these three variables is high indicating that with an increase in the savings by 1, there will be a fall in growth by 0.506. Therefore, the most robust variables that affect the economic growth according to the Solow model are investment as a share of GDP, population growth, growth of workable adults i.e. the people within the age group of 15to 64 years, and change in technology.
The testing of the basic Solow model demonstrates that the model is to a great extent useful in demonstrating the growth of the economy. However, there are other variables that the model takes to be assumed that may be included in the model to demonstrate its effect on the output growth. This is done in the next section.
Adding other variables to the basic Solow Model
This section adds other possible variables to the Solow model to understand how it affects the output growth of the country. In this case, the paper will take the data of Japan, and consider including a few other variables related to total labour, education, R&D expenditure etc. This section enumerates the variables that will be introduced in the basic Solow model and the algebraic justification for the same.
Human Capital Stock
the inclusion of human capital in the Solow model was first developed by MRW. They inserted another factor human capital that was dependent on education availability and access to literacy tot eh adult population of the country. Adult literacy rate that has been included as a proxy in the Solow model does not include the investment that the governemtn makes in human capital, nor does it include the qualification of the population. Rather, they account for the school enrolment ratio. According to MRW, “Including human capital can potentially alter either the theoretical modelling or the empirical analysis of economic growth.”24 Therefore, the calculation of human capital empirically can also alter the cross country differences in convergence as believed by MRW. Therefore using MRW’s augmented Solow model, and by inclusion of human capital as the third variable in the measurement of growth, the production function that is attained is
(14) Y(t) =![]() )1-α–β,
)1-α–β,
where H is the human stock of capital that in included in the Solow model, and letting all other variables remain as the earlier equation. Following the model developed by MRW, the effect inclusion of human capital will have on output per worker is
(15) ln[![]() ] = ln A(0) + gt –
] = ln A(0) + gt –![]() ln(n +g + δ) +
ln(n +g + δ) +![]() ln (sk) +
ln (sk) +![]() ln(sh).
ln(sh).
Here sk and sh are the fraction of income invested in physical capital and human capital respectively. The MRW model sticks to the Solow model assumption of the coefficients in equation (15). Α in this model too is the share of physical capital in income and therefore, according to MRW it is expected to be one third25.
R&D and Innovation
The next variable that can be included in the Solow model is knowledge stock. This can be calculated from the number of researchers in the country or the number of patents filed in the country in a particular year, or through the share of R&D expenditure in GDP or total R&D expenditure of a country will also indicate the research focus of the country. R&D definitely has a spill over effect on the economic growth of the country. Economists supporting endogenous growth model insist that mainly private firms to increase their monopoly power in the industry, incur R&D expenditure. This in turn helps the firms to increase the price of their product, thereby extracting higher rents, which in turn increases the GDP through the value added method. An increase in GDP will definitely increase the growth rate of the country. Following this logic, a variable measure for R&D can definitely be included in the Solow model. However, one problem that persists is which factor should be included as the closest measure of innovation and R&D. Therefore, accumulated expenditure on total number of patents released in the particular year can give a potent variable for R&D and innovation stock. Therefore, including this in the Solow model gives us the following equation
(16) Y(t) =![]() )1-α–β,
)1-α–β,
where R is the total number of researchers for a particular time. Assuming that the rate of change in expenditure in R&D to be sr, the augmented Solow function thus found is
(17) ln[![]() ] = ln A(0) + gt –
] = ln A(0) + gt –![]() ln(n +g + δ) +
ln(n +g + δ) +![]() ln (sk) +
ln (sk) +![]() ln(sh) +
ln(sh) +![]() ln(sr).
ln(sr).
Therefore, by including R&D and innovation stock, the output per worker equation becomes as the equation in (17).
Given these two inclusions in the Solow model, we test the effect it has on the convergence on the Japanese economic growth prediction using the augmented Solow model.
Results
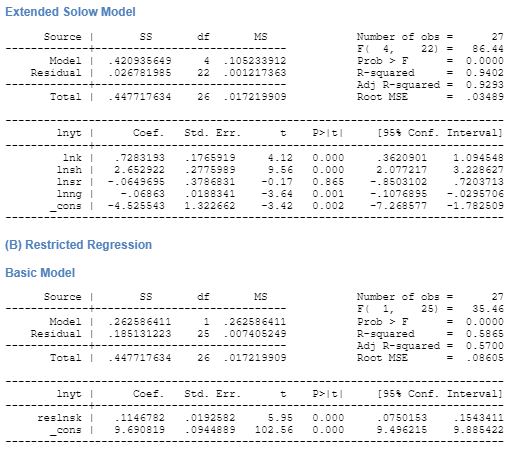
The additional independent variables that have been included in the Solow model and the resultant equation that is derived is shown in equation (17). The basic model tested on Japans’ national income statistics from 1980 to 2007 shows that the model has 65 percent chance of predicting that physical capital stock has a negative effect on the economic growth. This result is statically significant at 5 percent. Population growth is found to have a positive effect on Japan’s economic growth. The extended model includes two more variables i.e. R&D and innovation stock and human capital stock. The regression of output per worker is run on independent factors demonstrated in equation (17). This regression too keeps the behaviour of saving ratio same as in the basic model except for a marginal decline in the coefficient of savings ratio. The effect of population growth and technology are found to be positive. Human capital stock is found to have a positive impact on the growth of output for Japan and the result is statically significant. This finding demonstrates that there has not been sufficient increase in expenditure on education to the number of enrolments in schools. Therefore, this suggests that as there would be high enrolment to secondary schools, and as there would be a decline in the per capita expenditure on education, it will adversely affect the growth of the economy. The absolute value of the coefficient for human capital stock is found to be 2.6 indicating a very strong correlation between human capital stock development and output growth in the economy. Further, the augmented regresses ion has an R2 value of 0.932 indicating a high possibility of the augmented model to explain economic growth of a country.
The second variable infused in the basic model was physical capital stock. Given this variable, with higher expenditure on physical capital stock, output per capita would growth in Japan. This finding suggests that with higher investment in enhancing the physical capital of the economy i.e. in infrastructures, etc. there would be an increase in the economic growth of the country.
The third variable that had been added to the basic model was R&D and innovation. This demonstrates the amount of expenditure per researcher done in the country and how it affects the growth of the economy. The results of the regression analysis demonstrate that there exists a negative relationship between innovation and R&D stock and economic growth but the result is not statistically significant.
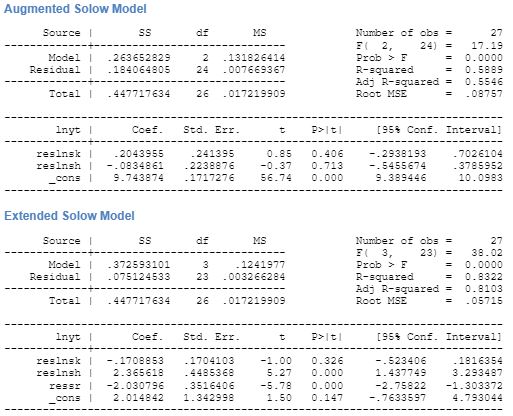
The restricted regression as demonstrates that in the basic model, the effect of increase in capital stock has a positive effect on growth. The regression of the restricted model has 57 percent chances of coming true. With inclusion of the human capital stock in the basic model, the restricted regression gives a negative relation between human capital stock and growth. However, the augmented model reduces the effectiveness of the model marginally by 3 percent. With inclusion of R&D expense, the effect it has on growth is negative and the results are statistically significant. In this case, the effect of human capital on growth is also positive. However, in case of the restricted regression with both the human capital stock and R&D in the basic model increases the effectiveness of the model by 30 percent making the adjusted R2 to be 0.81. This therefore demonstrates that an extended Solow model with human capital stock and R&D expense has a better probability of explaining growth than the textbook basic model.
Cross-Country Analysis
In this section, the Solow model is tested on cross-country data. The data for the study is extracted from OECD database, and information on education and school enrolment is derived from World Bank database. This section will test the Solow model in three ways – basic Solow model, augmented Solow model, and an extended version of the Solow model.
Cross-Country Analysis of the Basic Model
For the cross-country analysis, following MRW, the basic model is tested with and without a constraint. The test is done on 25 OECD countries that has been categorised as high-income OECD countries by the World Bank. This data is considered for cross-country analysis as the regression analysis for this particular dataset fails the test conducted by MRW (however, our dataset is not restricted to 22 OECD countries as followed by MRW). The independent variables that are considered for the basic model are – (1) natural log of real GDP per workable aged persons that is defined to be from 15 years to 64 years in 1980 and 2007 (lnYt), (2) log of real GDP at 1980 price (inY0), (3) average of annual ratio of real domestic investment to real GDP (sk), (4) and the average annual population growth from 1980-2007 is computed. For the augmented model introduced by MRW with inclusion of physical capital stock and human capital stock the additional variables that are considered are the percentage working age population in school that is calculated from the data on percentage of enrolment in secondary school (sh).
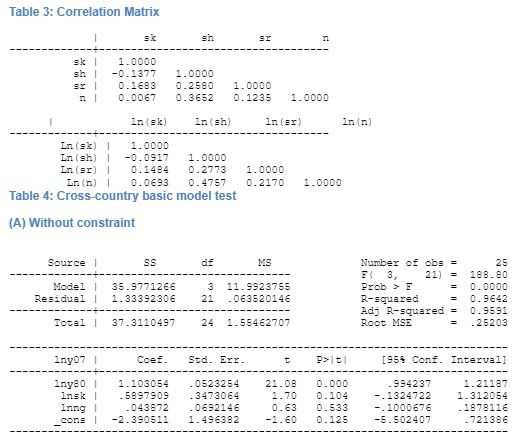
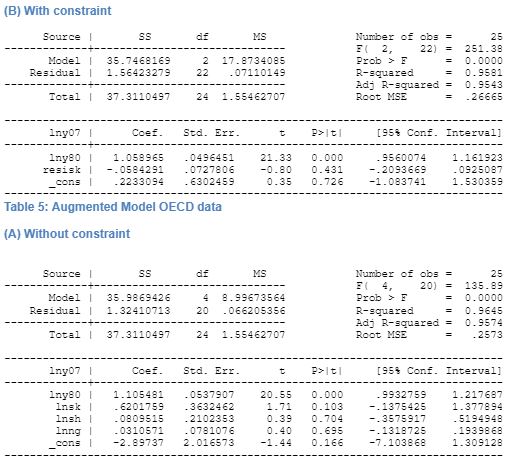
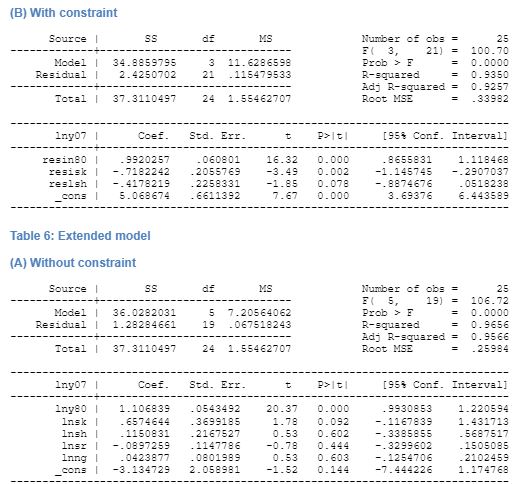
The models are constructed using unconstrained and constrained model. The constraint is determined by summation of coefficients of the log of investment share to GDP should equal to the coefficient of log of sum of growth of population, depreciation, and exogenous productivity of labour. Further, the growth of labour productivity and depreciation rate to be 0.05 following MRW. The correlation between the independent variables presented in table 3 and demonstrates the collinearity among them. The regression result for the three steps is presented in the appendix.
The performance of the Solow basic model for OECD countries is very good as adjusted R2 is found to be 0.95. The effect of the physical capital on GDP growth is found to be statistically significant at 95 percent confidence interval. Further, the capital elasticity is found to be considerably high and has a positive relation to growth of GDP, thus indicating a higher rate of physical capital accumulation would increase the growth in the country. Previous research testing the Solow model by MRW found that physical capital stock had a significant effect on GDP. Therefore, our finding is supported by previous research in basic model. This research supports previous findings as the regression results shows statistically significant effect of physical capital on GDP. Further, population growth is found to have a positive relation with growth, however, this findings is not statistically significant. Our finding supports the findings of MRW in terms of physical capital stock and we believe that it has a strong effect on GDP growth. However, the coefficient for capital stock is much lower than that of MRW.
In case of conditional convergence of the Solow model demonstrates that capital again has a statistically significant effect on output per worker. The research has a high degree of possibility as R2 is found to be 0.95. Our findings are consistent with the findings of MRW for basic Solow model. For OECD countries, MRW found that in case of unrestricted regression, investment had a significant effect on growth, a result that confirms our finding. However, there is a change in the magnitude of the coefficient, which is probably due to updating of the dataset. The effect of population growth had a negative effect on GDP growth according to MRW findings. But in case of our analysis, the sign of the coefficient is found to be positive. This supports the claim of Solow that with increase in population keeping technology and depreciation constant across countries, would increase the GDP with increase in population. The case of restricted regression by MRW demonstrates that in case of OECD countries, investment had a significantly positive effect on GDP growth. Our findings show a significantly high chance of the prediction of the regression to come true as adjusted R2 is found to be 0.95. The capital stock and technology and population growth has a negative coefficient. Our findings are different from the findings of MRW that showed that R2 was very low, indicating a non-significant regression. However, the results that our research has found are statistically significant.
The augmented model demonstrated that the inclusion of human capital stock in the basic model when regressed gave an adjusted R2 of 0.95. The study showed that human capital did not have a significant effect on the growth of GDP. This result was unlike the finding of other researches, especially that of MRW. Further, in case of the restricted regression, the results showed a negative coefficient of restricted human capital. However, the result was not statistically significant. The SCHOOL variable included by MRW in his augmented model actually represented an opportunity cost foregone by the adult population undertaking studies and keeping away from the labour force. Therefore, in case of OECD countries where the education is substantially subsidized, the effect of enrolment of the adult people to secondary school reduced the number of people in the workforce therefore reduced the growth of the economy in the short run. Thus, the conditional convergence demonstrates that with increase in the share of pupil in secondary education, there is an expected fall in the GDP growth. Our research, human capital has a statistically significant effect on growth, but carries a negative coefficient, unlike MRW findings. Thus, per capita investment in human capital is found to be statically insignificant, thus, and its coefficient value is found to be substantially smaller than that found in segmented Solow model of MRW.
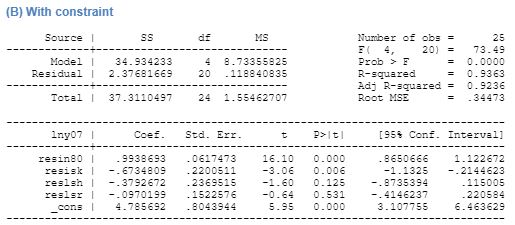
On inclusion of R&D variable in the unconditional augmented Solow model shows that R&D expenditure has a negative effect on growth and the result is statistically significant. The overall regression has an adjusted R2 of 0.95 indicating high change of convergence to the predicted result. The effect of capital stock is positive ad significant. Human capital is found to be significant and positive effect on growth. Further expenditure on R&D with the aim of increasing innovation and research is found to have a negative effect on the growth rate, and the result is statically significant. In case of restricted regression, the expenditure on R&D has a negative effect on growth and the result is found to be statically insignificant. Other variables like human capital and capital stock too has a negative relation to growth but is significant. This regression too has a high-adjusted probability of its predictions to become true.
Given this analysis, can we ascertain the degree of success of Solow model in predicting growth? The data analysis shows that Solow model is a valid tool for understand growth in an economy. The regression using the basic Solow model provided a highly probable result with R2 being more than 95 percent in both cases of conditional and unconditional regression. The regression results demonstrated that investment has a high degree of effect on the economic growth of the economy, and so did population growth.
Limitations
The data analysis was restricted to the OECD countries that have a typically high income. As the World Bank has classified OECD countries as high income attaining countries, the paper did not test the effectiveness of the Solow model on less developed economies (LDC) or developing countries. In case of the latter two cases, the effect of the variables will be much reduced, as there would be other pressing variables like foreign aid, poverty, inequality, political upheaval, etc. that would affect the growth of the economies. Further, in case of developed countries, especially the emerging economies like China, Brazil, and India, the rate of growth is enormous, and a large part of it is due to the increase foreign direct investment in the countries. Therefore, the Solow model must be tested on less developed economies in order to understand the effectiveness of the model in predicting growth. The limitation of this paper is because it failed to capture the effectiveness in these countries. Further, the paper also failed to capture the extended variables that would have made interesting study like socio-political conditions, health status, poverty, FDI, and aid in measuring their effect on growth. Therefore, the lack of scope in both the database as well as the variables chosen for extending the basic model bears serious limitation to the research.
Conclusion
The testing of the basic model of Solow demonstrates that the model is successful in predicting growth. Both the tests on the model using single country data i.e. of Japan and cross-country OECD data shows that the Solow model has a high relevance and possibility of predicting growth. The model has shown results as predicted by the original model to demonstrate the significance of Solow’s basic neoclassical growth model. However, the findings of the study do not completely support the findings of the augmented model of MRW, as the variables of human capital have been found to have insignificant effect on growth. For OECD data, our analysis reinforces the textbook model of Solow. However, it raises certain questions regarding MRW model. Further, on a note of extension, our study demonstrates the potential of inclusion of R&D expenditure as a significant variable in growth as it is expected to increase the effectiveness of the technology and therefore, increase production and growth. The inclusion of R&D actually helps in explaining the variation in the growth of the countries in OECD.
References
Barro, R and Sala i Martin, X, Economic Growth and Convergence across the United States, Working Paper No 3419. Cambridge, MA: National Bureau of Economic Research , 1990.
Barro, R, Economic Growth in a Cross Section of Countries, Working Paper No. 3120, Cambridge, MA: NBER, 1989.
Levine, R and Renelt, D, “A Sensitivity Analysis of Cross-Country Growth Regressions”, The American Economic Review, vol. 82, no. 4, 1992, pp. 942-963.
Mankiw, NG, Romer, D and Weil, D, “A Contribution to the Empirics of Economic Growth.” Quarterly Journal of Economics, vol. 107, 1992, pp. 407-437.
McQuinn, K and Whelan, K, “Solow (1956) as a Model of Cross-Country Growth Dynamics”, Oxford Review of Economic Policy. vol. 23, no.1, 2007, pp. 3-14.
OECD Stat Extract, OECD, 2010. Web.
Renelt, David, Economic growth: a review of the theoretical and empirical literature, World Bank Publications, 1991.
Romer, PM, “Endogenous Technological Change.” The Journal of Political Economy, vol. 98, no. 5 ,1990, pp. S71-S102.
Solow, RM, “A Contribution to the Theory fo Economic Growth”, The Quaterly Journal of Economics, Vol. 70, no. 1, 1956, pp. 65-94.
—. “Perspectives on Growth Theory ”, The Journal of Economic Perspectives, vol. 8, no. 1, 1994, pp. 45-54.
Appendix
Footnotes
- RM Solow, “A Contribution to the Theory of Economic Growth”, The Quarterly Journal of Economics, Vol. 70, no. 1, 1956, pp. 65-94.
- K McQuinn and W Karl, “Solow (1956) as a Model of Cross-Country Growth Dynamics”, Oxford Review of Economic Policy, vol. 23, no.1, 2007, pp. 3-14.
- NG Mankiw, , D Romer and D Weil, “A Contribution to the Empirics of Economic Growth”, Quarterly Journal of Economics, vol. 107, 1992, pp. 407-437.
- McQuinn and Karl, pp. 6.
- McQuinn and Karl, pp. 6.
- D Renelt, Economic growth: a review of the theoretical and empirical literature. World Bank Publications, 1991, p. 2.
- Renelt, p.3.
- PM Romer, “Endogenous Technological Change.” The Journal of Political Economy, vol. 98, no. 5 1990, pp. S71-S102.
- RM Solow, “Perspectives on Growth Theory ”, The Journal of Economic Perspectives, vol. 8, no. 1. 1994, pp. 45-54, p. 48.
- RM Solow, “Perspectives on Growth Theory, p. 48.
- Mankiw, Romer and Weil, pp. 408.
- R Levine, and D Renelt, “A Sensitivity Analysis of Cross-Country Growth Regressions.” The American Economic Review, vol. 82, no. 4, 1992, pp. 942-963.
- R Barro and X Sala i Martin, Economic Growth and Convergence across the United States, Working Paper No 3419, Cambridge, MA: National Bureau of Economic Research , 1990.
- R Barro, Economic Growth in a Cross Section of Countries, Working Paper No. 3120, Cambridge, MA: National Bureau of Economic Research, 1989.
- McQuinn and Karl, pp. 6.
- McQuinn and Karl, pp. 7.
- Mankiw, Romer and Weil, pp. 410.
- Mankiw, Romer and Weil, pp. 411.
- Mankiw, Romer and Weil, pp. 411
- Levine and Renelt, pp. 943.
- Mankiw, Romer and Weil, pp. 412.
- Mankiw, Romer and Weil, pp. 412.
- According to OECD definition of labour force, working age poopualtion is defined as all people above the age of 15 years. The data on working age popualtion is derived from OECD labour force statistics.
- Mankiw, Romer and Weil, pp. 415.
- Mankiw, Romer and Weil, pp. 417.