Introduction
Research aim: The aim of the research is to determine and assess the most important risk governance determinants that contribute to the project success.
Objectives of the research:
- To review the existing risk governance frameworks and develop/adopt relevant risk governance framework for Dubai public sector context.
- To review and extract the most risk governance determinants.
- To seek opinion of Auditors and Risk Managers on the importance of the extracted risk governance determinants.
- To use statistical methods to determine the importance of risk governance determinants and to confirm the association between risk governance and project success.
Research questions:
- What are the existing determinants of risks governance in public sector?
- What are determinants of project success?
- What are the audit function task in managing the risks in the public organisations?
- What is the association between risk governance and project success?
Research hypotheses:
There is no significant difference in rating the importance of the determinants of risk governance:
- Determinants of risk governance are positively related to projects success
- Determinants of risk governance are negatively related to occurrence of negative events of projects
The relationship between the determinants of risk governance and project success are moderated by the Internal Audit Function.
Literature review I: Risk Governance
Introduction
This chapter critically reviews existing literature in the area of risk governance and related frameworks in the private and public sectors. It presents various views and perspectives on risk governance definitions and frameworks, culminating in the development of a maturity model for risk governance in public investment projects. It concludes with a summary of the main issues and research gaps identified from the literature and the emerging research questions that will guide the present research.
Risk has invariably existed in society for a long time; however, its growing complexity has led to the evolution of risk management strategies to control its effects. The capacity to understand the development of risk and manage risk is a critical ingredient for the success of organizations and society. In recent years, the government’s role and efforts in risk regulation and management have intensified. Public sector organizations manage and control risks at multiple integrated levels through policy, legislation, regulatory tools/regimes, feedback loops, and rules (van Asselt & Renn 2011). The different levels represent dynamic subsystems in the public sector that provide interfaces for interaction between the public and state actors. Therefore, effective management of risks relies on the interactions, learning processes, and communication among the various stakeholders acting at the federal or local level.
Risk can be difficult to frame in definitive terms. Its definition is marked by a diversity of perspectives and principles for its detection, evaluation, and management (van Asselt & Renn 2011). In spite of the diverse definitions, the risk remains a key consideration in public and public-sector projects. van Asselt and Renn (2011) distinguish between simple and systemic risk. While simple risks have clear causes or effects and involve minimal uncertainty levels, systemic risks are complex and are shrouded in uncertainty/ambiguity. In fact, one of the risk definitions often used is the one given by the International Organisation for Standardisation, i.e., the risk is “the effect of uncertainty on objectives” (ISO 2015, p. 13).
Therefore, uncertainty is a key component of risk. Uncertainty often results from complexity. The complex social issues and multiplicity of stakeholders in the public-sector context increase uncertainty. The concept of uncertainty means that risk does not conform to the known principles of causation. Firm-specific uncertainties may be related to R&D, employee/managerial behavior (strikes), or operations – labor and input supply (Hopkin 2012). In the public sector, uncertainty may come from state policies related to expropriation and nationalization as well as conflicting stakeholder values and interests. Social and economic policies can also increase uncertainty and risk levels in a country.
The introduction of the concept of risk governance in organizations was meant to support structures for predicting and managing systemic risks that are characterized by high-level complexity, ambiguity, and uncertainty. In the private and public sectors, a myriad of regulatory, social, and organizational pressures influences risks. Risk governance frameworks give a blueprint on how to identify, assess, and manage risks to realize organizational objectives. This literature review involves a synthesis of the existing risk governance frameworks in a bid to develop a maturity model applicable to public sector organizations or projects. It begins with a review of risk and uncertainty definition followed by risk governance definitions and a descriptive analysis of various frameworks. A summative assessment of the main issues and research gaps identified from the literature is provided in the summary section.
Risk and Uncertainty and project risk managment
Theorists have attempted to define risk and to develop working models for risk management since the 1950s (Prpic, 2016). Economist Frank Knight, the founder of the Chicago School is often credited with this effort (Besner & Hobbs, 2012).
However, defining risk and what it really entails has been a challenging task. For example, Holton (2010) points out that risk theorists such as Knight and Markowitz have not provided a clear definition of risk, and this ambiguity has continued since the 1950s. Besner and Hobbs (2012) for example, point out that Knight considered a risk to be an event that could have an impact that can be quantified and measured, whereas uncertainty itself is the source of the risk, reflecting an objective interpretation of risk. On the other hand, Holton (2010) argues that Markowitz focused on the subjective aspect of interpreting risk by basing it on the judgment of decision-makers in assessing the likelihood of risk and the resulting variation in expected outcomes.
Alternatively, Sciotte and Bougault (2008) define risk as an identifiable event with negative consequences, while Hubbard (2009) defines it as the chance of an unfortunate event multiplied by the cost that results if such an event occurred, which effectively means that risk is equivalent to the expected loss arising from an event, but such a definition is clearly focused on the financial cost of the outcomes that arise in the event that the risk materializes.
The risk may also be defined as the chance of the occurrence of an uncertain event that is associated with outcomes that could be either positive or negative (Reding, 2013). Traditionally, the risk was limited to negative outcomes whereas positive outcomes or opportunities were not treated within the context of risk management (Ward & Champan, 2013).
Although risk assessment is often biased toward negative outcomes, the fact is that events with negative outcomes can impose a loss on a project and events with positive outcomes, if missed, can also result in lost opportunities (Wieczorerk-Kosmala, 2014). Additionally, the perception and measurement of risk are often based on perceptions and some degree of judgment, which makes it subjective, but it may also be quantified in objective ways (Simona-Iulia, 2014).
Dealing with risk is inevitable in any project, regardless of its size, and any attempt to manage risks requires understanding how risks are perceived and measured before they can be controlled or mitigated (Aaron, Clemons & Reddi, 2005). Hence, regardless of the context or the nature of a project or its size, risk management is a process that involves the identification, assessment, evaluation, and mitigation, and/or prevention of risks (Mazareanu, 2011).
Moreover, although it is not unusual for certain risks to receive more attention than others, it is generally agreed that risk management should be based on a holistic approach, a complex approach that involves understanding the interrelatedness between risks and their various impacts, but so far, the majority of approaches have focused on identifying risks separately and addressing their outcomes individually (Wu & Seco, 2009).
A project is often a complex undertaking that involves multiple stakeholders, numerous interrelated and unrelated processes, and different goals and objectives. It also requires the use of various inputs in these processes to accomplish a set of desired goals and objectives within a specific period of time (Hartono et.al., 2014). A project may also be defined as “a clear-cut investment activity with an explicit purpose and distinct beginning, duration, and end” (Charette, 1996, pp.112-113). The EC also defines a project as “a group of activities that must be realized in a logical sequence, in order to achieve a set of pre-established objectives, formulated by the client” (Zecheru, 2013, p.450). From economic and financial perspectives, moreover, Charette (1996) argues that a project in the course of doing business that involves the lowest opportunity cost and the most efficient way to achieve organizational goals and benefits while utilizing scarce resources.
In the context of project management, a project risk may be defined as any factor that affects the normal progress of the project or its feasibility (Teller, Kock & Gemunden, 2014). Likewise, a project risk may be defined as any predictable factor that may affect the project at any of its different stages of development (Sarker, 2013), and whether positively or negatively (Carvalho & Junior, 2013). Other definitions by project management associations define risk as “an uncertain event or act of circumstances which, should it occur, will have an effect on the achievement of objectives” or “a combination of the probability or frequency of occurrence of a defined threat or opportunity and the magnitude of the consequences of the occurrence” (Hubbard, 2009, pp.89-90).
Even in the simplest and smallest projects, controlling risks is often a complex task given the interrelatedness of inputs, processes, and outputs, whereas, in much larger projects, the prediction of risk is extremely complex to the point that it may be as reliable as “fortune-telling” (Charette, 1996, p.111). Accordingly, controlling project risks is in itself a complex process that requires robust management procedures (Gheroghe, 2012). These procedures fall under the concept of project risk management, that is, the process of identifying, evaluating, and analyzing risks, in addition to formulating measures that aim at mitigating and controlling risks surrounding a project. The process of risk management is not only limited to the design phase, but it is also required while the project is in progress and where it may face numerous uncertainties related to time limits and deadlines, financial shortages, and many other factors (Arias & Stern, 2011).
Another model for risk management that is relevant to project management is the Enterprise Risk Management Model which involves identifying risks, identifying causes, identifying controls, predicting likelihood and the magnitude of consequences, setting quantifiable ratings for each risk, making decisions to avoid or mitigate risks, and finally monitoring and reviewing execution to ensure that risk remains under control (Nocco & Stulz, 2006).
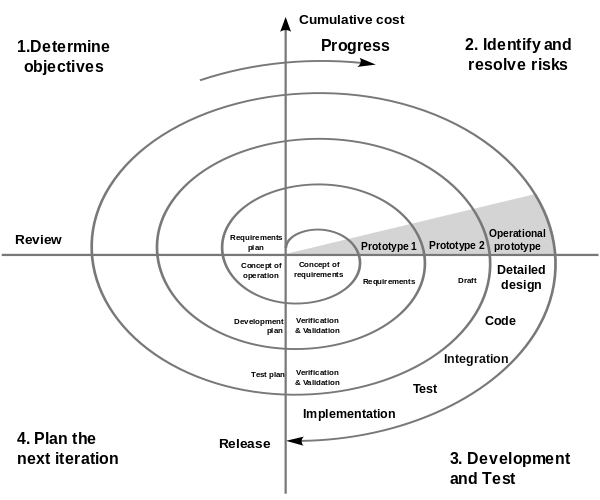
Boehm (1988) also proposed a risk management model for extremely large and complex software projects for government and defense industries. The model constitutes of four stages; determining project objectives and constraints; identifying risks, evaluating alternative courses of action, and resolving risk by taking the necessary decisions; implementing and verifying completion of steps with risk under control; and finally determining if risks remain at an acceptable level before proceeding to the next decision stage (Figure 1).
In implementing project risk management, managers have a variety of options to resort to in addressing potential risks. These may include risk mitigation decisions which involve either the reduction and/or elimination of risk; risk retention decisions which involve accepting the risk if the cost of its impact is tolerable or if the cost of retention or prevention is too high; risk transfer which involves the transfer of risk to other parties; and risk allocation which involves distributing the risk, possibly by sharing it with other partners such as entering into a joint venture (Berk, 2012).
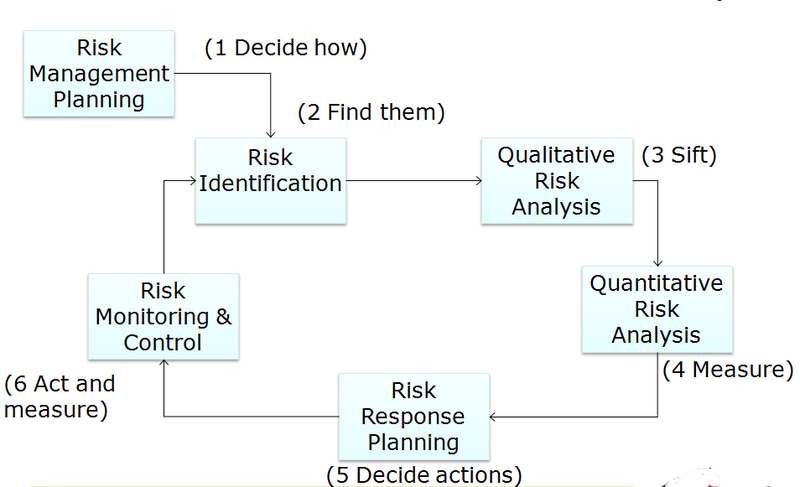
The concept of project risk management, therefore, is about developing a framework that entails measures to mitigate and/or prevent any possible threats that may obstruct project progress (Podean, Benta & Mirceana, 2010). Progressive definitions, however, perceive project risk management as the framework that provides management with the ability to avoid or mitigate negative risks and to take advantage of positive risks (Thamhain (2013). This concept is expressed in the standard project risk management process illustrated in Figure 2 (Prpic, 2016).
Project risk management has attracted significant attention from risk management scholars. However, with the growing complexity of projects, scholars have also increasingly paid attention to specific types of risk, especially those with substantial or detrimental impacts on projects (Powell, 2010). In the context of the massively growing size of projects all over the world and also in light of the global financial crisis, financial risk has specifically attracted unprecedented attention (Kerzner, 2013).
Governance and Risk Governance Definitions
The Standards of IIA define governance as “the combination of processes and structures implemented by the board to inform, direct, manage, and monitor the activities of the organization toward the achievement of its objectives.” (IIA, 2011)
OECD has introduced another definition which is “Corporate governance involves a set of relationships between a company’s management, its board, its shareholders. Corporate governance provides the structure through which the objectives of the company are set and the means of attaining those objectives and monitoring performances are determined.”(OECD, 2004) while OCEG defines governance as: “Governance is the culture, values, mission, structure, and layers of policies, processes, and measures by which organizations are directed and controlled. Governance, in this context, includes but is not limited to the activities of the board, for governance bodies at various levels throughout the organization also play a critical role. The tone that is set, followed, and communicated at the top is critical to success.”
A risk, in general terms, connotes the uncertainty or unexpected ‘adverse’ outcome of a situation or activity. The scholarly literature on risk governance explains the processes and frameworks for managing risks based on diverse definitions of risk governance. Klinke and Renn (2012) define risk governance as a comprehensive risk-handling process for addressing the “complexity, uncertainty, and ambiguity” aspects of risk (p. 274). It entails an evaluation of the totality of regulations, processes, and systems involved in the risk data collection, analysis, and risk-based decision-making. Therefore, it extends beyond the traditional risk analysis to include normative principles on how public and private actors can manage risks.
Renn, Klinke, and van Asselt’s (2011) definition of risk governance follows a technocratic approach. They define it as the organizational structure and policymaking process that guide or control the regulation or mitigation of risks at the group, societal, national, or global level (Renn, Klinke & van Asselt 2011). This definition is based on the shift from centralized decision-making to multi-level public administration that characterizes modern governments. In another article, van Asselt and Renn (2011), extending on the International Risk Governance Council’s [IRGC] definition, describe risk governance as the application of core principles/concepts of governance in risk-based decision-making extending beyond formal (probabilistic and regulatory models) to include informal processes. The definition is informed by the inadequacies of risk probability models in managing public risks. It includes formal and informal systems for dealing with complex, uncertain, and ambiguous risks. In this article, the concept of governance primarily relates to policy development by government actors. However, since various stakeholders are involved in the management of society, including non-governmental organizations and the private sector, the definition has been expanded to include a diversity of actors/roles.
The phrase risk governance is utilized in a prescriptive and a descriptive context. Decisions about risks involve diverse players, regulations, political systems, and organizational structures – aspects pertaining to governance. Risk decisions are the outcome of the interaction between many players. From a governance perspective, the societal factors that precipitate outcomes characterized as risks need to be analyzed for effective mitigation. For Flemig, Osborne, and Kinder (2015), risk governance is both a normative and prescriptive process. They define it as a hybrid of “an analytical frame and a normative model” that guides risk decisions (Flemig, Osborne & Kinder 2015, p. 16). This decision-based risk governance differs from the technocratic approach in the sense that it assigns the decision-making role entirely to politicians.
Brown and Osborne’s (2013) definition of risk governance follows a different approach. They define risk governance as transparent engagement with the “nature, perceptions, and contested benefits of a risk” in complex situations (Brown & Osborne 2013, p. 199). This means that all relevant stakeholders in the public service are involved in the decision-making process. This transparent approach has been adopted in the modern public sector to enhance accountability. In addition to the inclusive decision-making process, the risk environment is characterized by regulations and best practices to enhance accountability in the public sector. Therefore, Brown and Osborne’s (2013) definition fits within the transparent risk management approach adopted in democratic systems.
Clearly, an appropriate conceptualization of the concept of risk governance should encompass a global view of risks that emerge in public investment projects. It should go beyond the traditional concepts of risk management or analysis to include decision-making processes related to a particular project. In this regard, Brown and Osborne’s (2013) definition fits well within this description, as it points to decision-making processes in a complex environment, such as the public sector. From a descriptive perspective, an appropriate definition must capture the totality of stakeholders, standards, procedures, and processes involved in making risk decisions. Considering the fact that risk governance goes beyond simple descriptive management of public risks, a satisfactory definition should include the normative elements or rules on how to manage risks in the public sector. It should involve all actors working in a transparent decision-making process. The adopted definition for this paper is that of Brown and Osborne (2013) who define risk governance as genuine engagement with the “nature, perceptions, and contested benefits of a risk” in complex situations (p. 199). The authors point out that this definition fits well with the characteristics of the public-sector risks, i.e., complexity, ambiguity, and uncertainty.
Risk Governance Frameworks
Various epistemological premises and ideas contributed to the development of risk governance as a concept. While the positivistic/realist view relies on the assumption that risk is assessed based on some ‘real’ standard, while the social constructivist approach considers risk a “social process”, not as a distinct entity (Renn 2011, p. 71). These ideas helped advance the principles and frameworks for managing contemporary risks. The conceptual use of the term ‘risk governance’ emerged in recent literature exploring policy development in the public/private sectors (van Asselt & Renn 2011). It is used within the context of public/private governance or development that has roots in the political science field. In this context, ‘governance’ stresses the role of non-state actors in the management and organization of societal issues (van Asselt & Renn 2011). This approach challenges the classical policy perspectives that followed a hierarchical power model centered on the government.
In the governance view, collective binding decisions are produced in “complex multi-actor networks and processes” (Jonsson 2011, p. 126). This means that multiple social actors are involved in governance. Besides the state, the other social actors include nongovernmental organizations, private institutions, expert groups, etc. In this regard, the power/capacity to organize and manage society is shared among the different actors. Governance can be considered a descriptive and prescriptive term. The descriptive sense of governance relates to the complex interplays between various social actors, structures, and processes (Jonsson 2011). In contrast, the prescriptive definition relates to the model/framework for the management of societal issues. The normative use of governance emphasizes transparency, involvement, and accountability.
The normative-descriptive ideas also apply to risk governance. The word ‘governance’ is utilized in “a normative and descriptive sense” (van Asselt & Renn 2011). The argument here is that while the regulation/management of simple or systemic risk problems follows the governance framework, risk decisions emanate from interactions between stakeholder groups. The ‘governance’ view gives a framework for examining and describing the factors precipitating risks. However, the unpredictable nature of risks calls for multi-stakeholder collaboration to adequately address and manage them. In the collaborative frameworks, new risk management principles and approaches are proposed in line with the prescriptive/normative perspective (Renn 2011). Therefore, risk governance is a blend of an analytical framework and prescriptive exemplars.
The usage of the term ‘risk governance’ has its roots in the lessons learned from the TRUST NET undertaking, which developed a model that included collaborative processes in decision-making (Renn 2011). TRUSTNET was a European Union interdisciplinary network established to develop the criteria for determining best practices in the governance of hazards. It comprised 80 experts drawn from regulatory agencies in industrial and medical fields across Europe. The network developed the concept of risk governance and the first model. Later, this notion was used in literature as an alternative paradigm to the traditional concepts of risk analysis and management by advocating for multi-stakeholder roles, processes, and systems (van Asselt & Renn 2011). However, risk governance was originally used to mean an all-encompassing system of “risk identification, assessment, management, and communication” (van Asselt & Renn 2011, p. 433). This view is consistent with the IRGC’s definition of the notion of risk governance. The IRGC (2015) incorporates the governance principles of “transparency, effectiveness, accountability, equity, and fairness” into its definition of governance framework (p. 12). The aim is to create effective collective actions to mitigate the effects of emerging risks.
The purpose of sound risk governance is to reduce the unequal risk distribution between different public/private institutions or social groups through multi-actor processes. A risk governance practice also creates consistent and uniform approaches for similar risk assessment and management (Renn 2011). Unlike the traditional approach of risk analysis that focused on high-profile risks, risk governance gives adequate consideration of high-probability risks irrespective of their profiles. It also involves risk trade-offs through effective regulations and policies. The approach also takes into account public perceptions, resulting in high public trust in the system.
Brown and Osborn’s (2013) Framework
The risk governance frameworks provide an approach for the analysis and management of risks within the public service or the private sector. Brown and Osborne (2013) suggest a risk governance model for managing risks related to innovation in the public sector. The framework links three management approaches and three innovation types (Figure 1). The first type is evolutionary innovation, whereby institutions utilize new “skills or capacities” to meet specific user needs (Bernado 2016, p. 14). The second type is expansionary innovation, whereby the current skills/capabilities are used to meet expanding user needs. The last one is total innovation, in which new capabilities/skills are developed to address new user needs (Brown & Osborne 2013). The authors offer three risk governance approaches, namely, technocratic, decisionism, and transparent methodologies. The technocratic model is only applicable in evolutionary innovation. In contrast, the decisionism model provides a framework for evolutionary and expansionary innovation. The transparent risk governance model can accommodate all the three types of innovation.
Figure 1: Risk Governance Framework for Public Service Innovation
The IRGC’s Framework
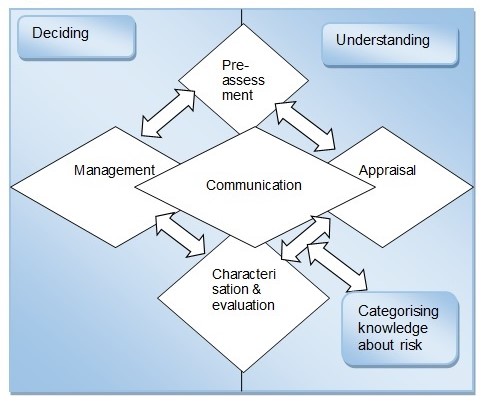
Another risk governance framework is the IRGC’s model that consists of five related phases. The phases include pre-assessment, appraisal, characterization and evaluation, management, and communication (Figure 2).
The model separates risk analysis from the understanding of risks. Risk appraisal is essential in understanding the nature of risks. In contrast, the implementation of risk decisions requires risk management. The framework begins with pre-assessment, whereby the risk is defined to facilitate its appraisal. The pre-assessment phase involves a set of questions that give the baseline data for risk assessment and mitigation.
More importantly, it reveals the factors that precipitate the risk and the associated opportunities (Bernado 2016). It also brings out the risk indicators and patterns that help inform the risk management approach. The governance shortfalls that occur during this phase include failure to detect risk signals, perceive their scope, and frame it appropriately.
The risk appraisal phase is where facts and assumptions are developed to make a determination if a situation portends a risk and how it should be handled. The appraisal involves scientific approaches, including estimating the probability of occurrence, and risk-benefit analysis based on stakeholder concerns (Bernado 2016). The process ensures that policymakers consider stakeholder concerns and interests when making decisions.
The next phase – characterization and evaluation – involves the consideration of societal values in decisions related to the acceptability or tolerability of the risk. At this stage, risk mitigation measures are identified for risks considered acceptable or tolerable (van Asselt & Renn 2011). However, if the risk is intolerable, the initiative is halted. The failure to address the issue of inclusivity, transparency, and societal values/needs, and timeframes precipitates risk governance problems.
The fourth phase is risk management. It entails the development and adoption of strategies or activities that help mitigate, avoid, or tolerate the identified risk. In this stage, multiple options are developed and the best one is selected for implementation. The risk management process entails the “generation, evaluation, and selection” of the best risk mitigation strategy (van Asselt & Renn 2011, p. 445).
It also entails evaluating the potential impacts of the selected risk mitigation option. The final phase of the IRGC framework is the communication of the risk management decision. Effective communication helps create awareness among stakeholders. It also enables them to understand the stakeholder role in risk governance (van Asselt & Renn 2011). The communication should inform the stakeholders/actors about their specific roles in managing the risk.
The IRGC’s framework has been adopted across multiple industries. In this model, an iterative process of communication cuts across the four phases. The IRGC framework is criticized for being one-dimensional. The model depicts risk governance as an additive process with distinct phases. However, researchers argue that the process is rather iterative, with steps like risk assessment and management not clearly delineated (Flemig, Osborne & Kinder 2015). Moreover, since various actors interact and influence each other, risk governance cannot follow a logical sequence.
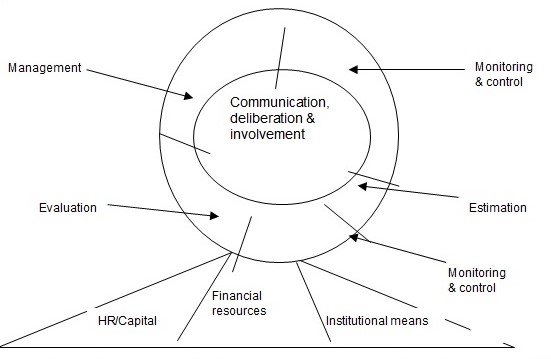
In the IRGC framework, risk communication remains the unifying factor of the five phases of the model. The IRGC expanded the new framework by introducing deliberation and engagement, suggesting a bipartisan process between the actors. Another significant aspect of the revised model is the emphasis on institutional capacity and resources. The organizational resources/capacities considered in the new model include finances, social capital, human resources, and technological capabilities (Flemig, Osborne & Kinder 2015). It also includes the consideration of the actor-network, political and regulatory culture, and the social climate.
The Modified IRGC Framework
Renn, Klinke, and van Asselt (2011) propose a modified IRGC framework that includes the normative and descriptive aspects of risk governance. The proposed model comprises five stages, i.e., “pre-estimation, interdisciplinary risk estimation, risk characterization, risk evaluation, and risk management” (p. 237). The modified framework is illustrated in Figure 3 below. The pre-estimation stage involves the testing of multiple problems as possible risks. It entails an exploration of societal/community and political agencies and the public to identify factors ‘framed’ as risks. The screening also explores the culturally constructed risk candidates. Therefore, the pre-estimation stage is a multi-stakeholder process that brings together government agencies, industry actors, consumers, and various interest groups.
The second stage, risk estimation, entails the scientific evaluation of risks through risk assessment and concern (societal issues) assessment (Renn 2011). Various approaches can be used in risk estimation. Examples include the probability of occurrence, the extent of damage, ubiquity, reversibility, etc. The third step, risk evaluation, involves the quantification of the societal effects of risk and its probability of occurrence. The risk profiles are evaluated based on their level of acceptability (Renn 2011). Low-risk situations or activities are considered highly acceptable. Risk management is applied to risks considered tolerable. It entails a suite of mitigation measures to reduce the adverse consequences of a risk. Risk communication/participation entails educating the masses through interactions to disseminate information related to the risks (Renn 2011). The aim is to build trust relationships in risk management through multi-actor inclusion.
The cyclic process of risk governance occurs in a logical sequence of five phases: pre-assessment, appraisal, characterization and evaluation, risk management, and communication (Roeser et al. 2012). The individual phases and their specific components are described below.
Pre-assessment Phase
The pre-assessment phase is the screening stage of the risk governance process. Here, the actors consider diverse issues related to a specific risk. In addition, the different stakeholders review the risk indicators and practices at this stage. The main components of the pre-assessment phase include “problem framing, early warning, pre-screening, and the determination of scientific conventions” (Roeser et al. 2012, p. 51). The purpose of risk framing is to explore the multi-actor perspectives and establish a common understanding of the risk issues. Based on an agreed risk frame, the signals or indicators of the risk/problem can be monitored.
Early warning helps identify indicators that confirm the existence of a risk. It entails an exploration of institutional capabilities for monitoring early warning signs of risk within an organization (Rossignol, Delvenne & Turcanu 2015). Pre-screening encompasses preliminary analysis of risk candidates and prioritizing them based on probabilistic models. It also entails identifying the appropriate evaluation and management route for each risk candidate. It is followed by a determination of the main “assumptions, conventions, and procedural rules” required for the assessment of the risk (Rossignol, Delvenne & Turcanu 2015, p. 137). The stakeholder emotions related to the risk issues are also considered in this step.
Risk Appraisal Phase
The purpose of risk appraisal is to create societal standards or scientific thresholds for risk. It also gives a knowledge base for identifying appropriate risk mitigation or containment approach. Its main components include risk assessment and concern assessment (Roeser et al. 2012). A risk assessment identifies the cause-effect relationship of risk as well as its probability of happening. It may involve risk identification and evaluation to estimate its severity. The objective of concern assessment is to explore the stakeholder’s anxieties and fears related to the risk (Roeser et al. 2012). It also illuminates the socioeconomic impacts of a risk-based on stakeholder perceptions.
Risk Characterisation/Evaluation Phase
This phase involves estimating how acceptable or tolerable a risk is to the stakeholders. Therefore, the two components of this phase are risk acceptability and tolerability. A risk problem considered acceptable has lower adverse impacts on health/environment than a highly unacceptable one (Karlsson, Gilek & Udovyk 2011). This means that the risk does not require mitigation efforts. On the other hand, a tolerable risk has significant trade-offs between benefits and adverse effects. As a result, specific mitigation measures are adopted to reduce the negative effects. Characterization helps generate an evidence base from the outcome of the risk appraisal phase. In contrast, evaluation involves consideration of extraneous factors relevant to the risk.
Risk Management Phase
The risk management phase involves the development and application of mitigation actions geared towards averting, diminishing, or retaining risks. It proceeds through a six-step process that culminates in an optimal option for risk management. The first component involves the formulation of an array of options for addressing the risk (Roeser et al. 2012). This initial step relies on the acceptability-reliability considerations relevant to the specific risk. The next step involves the evaluation of the options based on specified criteria, e.g., sustainability or cost-effectiveness (Karlsson, Gilek & Udovyk 2011). Thirdly, a value judgment based on the weights assigned to each criterion is applied to the options. Subsequently, the best option(s) is chosen for further consideration in the fourth step. The fourth and fifth steps cover the execution of the best risk management strategy and monitoring and evaluation of its impact on the reversibility of the risk.
Communication Phase
Risk communication is an ongoing activity during the risk governance process. Its aim is to enlighten non-participating stakeholders regarding the risk decisions emanating from the preceding phases (Roeser et al. 2012). Additionally, risk communication helps support informed choices by stakeholders based on the consideration of societal/individual interests, fears, values, and resources (Roeser et al. 2012). As a result, conflicting perspectives are managed to arrive at a consensus risk management strategy for the institution. Effective communication is also required between policymakers and experts/assessors to avoid bottlenecks related to communication lapses.
The OCC’s Risk Governance Framework
Another existing framework is the one proposed by the Office of the Comptroller of the Currency [OCC] for risk governance in the financial industry (Figure 4). This model is intended to help the board/management of banks to establish an institutional risk culture, promote compliance with the risk appetite, and create a risk management system for the identification, measurement, and control of risks (IFC 2012). The OCC’s framework comprises three additive steps – risk management system, risk appetite, and risk culture. It takes into consideration the various risk categories common in the financial sector. Examples include interest rate and price, which portend a significant risk to an institution’s financial performance.
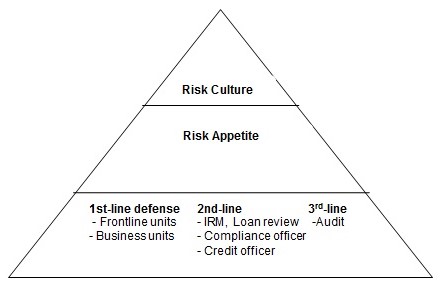
Banks use different risk governance models depending on the nature of their operations and corporate strategies. In banks, the board/management oversees the formulation, execution, and evaluation of a risk governance model through independent assessments. Subsequently, based on the outcomes of the assessment, some or all of the elements of the model are reviewed to enhance its efficacy. In this structure, the institution’s senior management does the role of maintaining the framework and managing factors related to the defined risk appetite (Polk 2014). It also regularly informs the board about the institution’s risk profile and potential risks. The specific components of this framework are described below.
Risk Culture
In the OCC’s framework, risk culture covers the institutional “values, attitudes, competencies, and behaviors” that define the bank’s risk governance practices and decisions (Polk 2014, p. 14). It is, therefore, a subset of the organizational culture. The board plays a critical role in creating a sound risk culture through enhanced risk awareness and communication of the acceptable risk levels to the staff. This ensures that the employees make decisions that conform to the defined risk appetite or acceptable risk thresholds. Besides the board, the bank’s senior management promotes a positive risk culture through staff incentives and sanctions for unacceptable behavior (Polk 2014). The management is required to identify and address risk-taking behavior or actions that go beyond the minimum thresholds.
Risk Appetite
In the OCC’s framework, risk appetite is considered an important element of sound risk governance. It entails the “aggregate level and types of risk”, which the board and the senior managers can assume to realize the institution’s strategic goals or objectives (Polk 2014, p. 13). However, a bank’s risk appetite must not exceed its capital or liquidity level. The establishment of a risk appetite involves concerted efforts from the board, senior managers, supervisors, and front-line staff. Furthermore, its execution requires effective interactions between the various stakeholders involved in the management system. Information about the bank’s risk appetite should be conveyed throughout the institution to ensure that risk decisions are aligned with the acceptable risk thresholds. The risk management and front-line units should track, evaluate, and report the risks based on the risk appetite policy.
Risk Management System
The third component of the OCC framework is the risk management system. It encompasses policies, processes, and staff involved in the identification, measurement, tracking, and management of risks (Polk 2014). The nature of a bank’s risk management system depends on the economic conditions that the organization operates in and the complexity of its organizational structure. It entails three defensive structures. The first defensive structure involves “the frontline units or business units that create risk” (p. 46). The frontline/business units are the primary risk-takers, and therefore, they must operate within the accepted risk appetite thresholds. The second defensive structure is the internal risk management (IRM) unit, which oversees the risk-taking activities of the frontline units (IIA 2013). The IRM also recognizes, measures, and tracks emerging risks and participates in risk decision-making in the bank (IIA 2013). Ordinarily, the IRM comprises the credit officer and/or credit review manager. The final defensive structure in this framework is the audit unit, which facilitates external validation. It implements internal controls to ensure effective risk governance within the institution.
The International Finance Corporation (2012) extends the OCC’s risk governance framework by including the concept of conflict of interest. The elimination of possible conflict of interest situations is essential for effective risk governance in the financial sector (IFC 2012). It entails separation of duties, independent management of activities, and adequate revenue control systems in the bank. Effective communication is also required in staff education, deliberations, and reporting of risks in financial institutions.
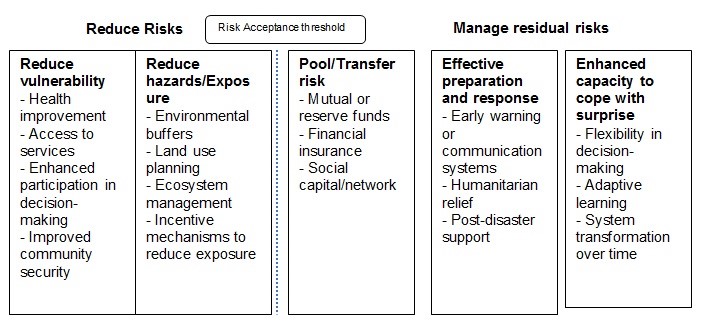
IPCC Risk Governance Model
The Intergovernmental Panel on Climate Change’s [IPCC] (2012) developed a model for managing risks related to natural disasters. The key components of this model include methods for reducing risks and for managing the residual risk related to environmental hazards. The reduction of risks focuses on minimizing vulnerability, hazards, and exposure (IPCC 2012). It also entails sharing or transferring the risk through mutual/reserve funds, financial insurance, and social capital.
In the public sector, risk vulnerability is reduced through society-level actions such as access to essential services, improvement in community security, and increased participation in decision-making. On the other hand, the reduction of the exposure levels to natural risks can be achieved through land use planning, incentive mechanisms, and ecosystem management, among others (IPCC 2012). The risk reduction phase of the IPCC framework also entails the pooling or transferring of risks. This requires interventions like reserve funds, insurance cover, and social networks.
The second phase of this framework comprises the management of residual risks/uncertainties. The natural risks are managed through effective preparation and response and the enhancement of the capacity to deal with surprises (Hooper 2014). In this regard, the government can manage residual risks by implementing early warning systems, post-disaster support, flexible decision-making systems, and adaptive learning, among others. The IPCC model is illustrated in figure 5 below.
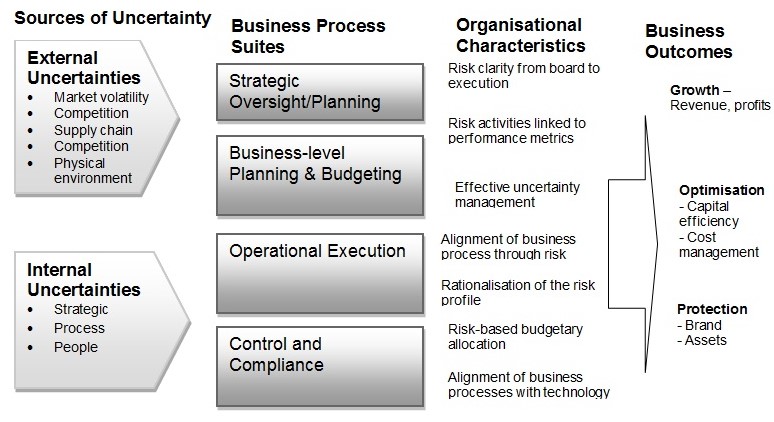
Risk-enabled performance management (REPM) Framework
Private sector organizations are shifting to a performance-based approach to the management of risks. Risk-enabled performance management (REPM) focuses on value creation by supporting robust decision-making and the identification of business opportunities while minimizing uncertainties or risks (Palermo 2011). Therefore, using the REPM framework (Figure 6), organizations can achieve risk-enabled performance as opposed to simple identification and measurement of risks. In this way, the firm can obtain additional value from its risk management initiatives – a benefit that may not possible when the focus is on risk avoidance or minimization alone. In the REPM framework, multiple business processes and components interact to create value for the organization. The main components of this framework include strategic oversight/planning, business-level planning, operational execution, and monitoring and compliance.
Strategic Oversight/Planning
This component focuses on a range of board or senior management-level activities that trigger the development of a risk-enabled organization. The strategic oversight function entails establishing risk governance “structure, roles, and responsibilities” of each individual within the organization (Palermo 2011, p. 9). This role is achieved through delegation and performance evaluation. It is also incumbent upon the executive leadership to specify the appropriate risk appetite for the organization. In this way, the capital allocation and investment decisions can be aligned with the acceptable risk thresholds. The oversight role also entails the identification of emerging risks and performance management to realize the value of the risks.
Business-level Planning
It encompasses the conversion of business strategies into plans and budgeting. The organization can use planning tools to analyze the “types and levels” of each risk inherent in a given investment (Palermo 2014, p. 328). In this way, the organization will create a basis for risk-based investment and budgeting.
Operational Execution
This step covers the implementation of strategic plans from the previous stage. The operational reviews should consider the identified risk limits and appetite in evaluating performance (Palermo 2014). The risk tolerances indicate how well the firm’s operations are aligned with the established risk appetite. Another dimension of operational execution is the re-evaluation of risks linked to operational activities. The aim is to minimize possible ‘surprises’ or uncontrollable events in organizational operations.
Monitoring and Compliance
This phase entails audit and compliance measures. It involves the alignment of the “monitoring processes with the risk profile” to detect redundancies and inadequacies in the monitoring function (Palermo 2014, p. 331). An in-depth evaluation of the risk profile and the deployed monitoring measures can reveal issues or problems that could precipitate costly risks. Thus, the approach reduces costs and improves the efficacy of risk surveillance. The REPM framework was shown to give a clear risk profile of a power plant and facilitate more efficient budgeting for risk mitigation programs.
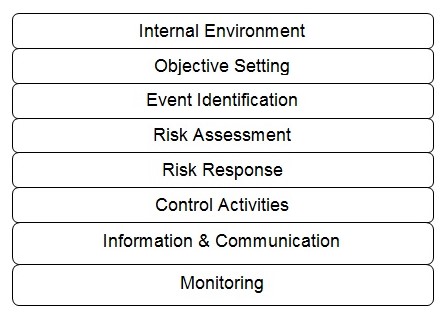
Enterprise Risk Management Framework
Enterprise risk management (ERM) supports the effective management of uncertainty in organizations. It entails a comprehensive model for the identification, measurement, prioritization, and management of risks that threaten business activities or operations (PWC 2015). The ERM framework involves the development of a portfolio view of risks based on organizational operations at all levels, including enterprise-level, division/subsidiary, and business-level processes. The senior management first explores the interrelationships among risks before formulating a portfolio view from a business unit level and entity level (PWC 2015). The ERM framework comprises eight interrelated components. They include internal environment, objective setting, event identification, risk assessment, risk response, control activities, information and communication, and monitoring (PWC 2015).
Internal Environment
A focus on the internal environment creates a risk management philosophy that leads to an increased recognition that both anticipated and unanticipated events may happen (Karim 2011). An internal environment focus also helps define the organizational risk culture and the actions that affect it.
Objective Setting
The formulation of business objectives should involve a risk strategy. Such an approach establishes an organization’s risk appetite, i.e., the board- and management-level view of the acceptable risk levels. Through objective setting, the management can align risk tolerance with the established risk appetite.
Event Identification
The event identification step helps distinguish risks from opportunities. Risks involve events that impede the attainment of the business objectives, while those with a positive effect constitute the opportunities for strategic action (PWC 2015). Event identification is critical in each decision level, when implementing a process or system changes, and for new projects. The initial risk identification process helps identify a risk profile for the organization. Thereafter, more risks are identified for inclusion in the risk profile, as the event identification step becomes a part of the organization’s culture.
Risk identification entails the identification of the incidents, whether internal or external, which could impede strategy. It also addresses the internal and external factors that affect an organization’s risk profile. The risks are grouped based on their sources for easier root-cause analysis and assignment of mitigation responses (Ng 2015). The major sources of risk include political influences, decision-making, human capital, natural events, and regulatory issues. The other sources of risk may be fraud, supplier factors, technology, and competitive pressures.
Risk Assessment
The assessment of the identified risks is the second step of the ERM framework. The assessment allows the management to formulate appropriate risk responses based on the likelihood/probability of occurrence and anticipated impact – using a risk rating scale (Ng 2015). The likelihood rating ranges from highly certain to unlikely to occur. In contrast, the risk impact rating focuses on the effects of each risk, including financial costs, missed operational milestones, regulatory breaches, failure to meet strategic objectives, and managerial staff turnover. A risk map is constructed from the results of the assessment.
Risk assessment gives a comprehensive picture of how potential risks may influence objectives. Therefore, the assessment focuses on the likelihood and impact and involves both qualitative and quantitative techniques. The risk is measured on an “inherent and residual basis”, taking into account the predefined time and objective horizons (Ng 2015, p. 14). The aim is to inform future actions or risk responses.
Risk Response
In this step, the entity identifies and develops responses to each identified risk. In this regard, the organization considers multiple options based on its “risk appetite, cost-benefit analysis of the risk, and the degree to which a response will reduce the risk impact or likelihood” (Domokos et al. 2015, p. 8). After an analysis of a suite of risk/response options, the organization selects and implements an optimal response to mitigate the risks. In this case, the organization’s inherent and residual risks are measured during the execution of the risk response to achieve the desired risk level. Inherent risks differ from residual ones in the sense that they occur prior to the execution of any risk control or response.
The response options include the portfolio of management actions aimed at controlling or preventing the risk. The management can choose to mitigate, exploit, accept, transfer, or avoid a risk. Risk mitigation encompasses actions taken to minimize the likelihood of occurrence or impact of a particular risk (PWC 2015). Mitigation activities may include budget controls, forecasts, enhancing accountability, staff motivation programs, and building appropriate skill sets (Andreeva, Ansell & Harrison 2014). Risk exploitation allows an entity to leverage on opportunities presented to grow through activities such as strategic alliances, business portfolio expansion, innovative product development, and organizational restructuring.
The management can also choose to accept the risk impact and probability of occurrence. Risk transfer, as a response option, involves activities meant to shift the loss/impact to other parties. It can be achieved through outsourcing, insurance coverage, and hedging (Andreeva, Ansell & Harrison 2014). Risk avoidance involves activities meant to prevent hazards from occurring. They may include ceasing operations, divestiture, or reducing the scale of operations.
Control Activities
This step involves an ongoing process of tracking and reviewing the risk profile and responses (Mathews & Kompas 2015). The aim is to ensure that the management of risks occurs as planned, determine the relevance of the risk responses being executed, and track the impact of the activities on the risk profile. In addition, the control activities can inform new response plans for emerging risks. Risk monitoring comprises diverse methodologies for review, assurance, and auditing risks. The assurance techniques involve post-implementation reviews, performance appraisals, and quality reviews, among others.
The measurement of a response option should involve its efficiency and effectiveness (Walker, Tweed & Whittle 2014). In this case, efficiency indicates the execution costs related to finance/budget and time. In contrast, effectiveness indicates the extent to which the responses minimize the risk impact or probability of occurrence (Walker, Tweed & Whittle 2014). To achieve a higher level of response efficiency and effectiveness, the control activities should be incorporated into the current business processes at all levels of the organization.
Information and Communication
This step involves reporting the risk in terms of its status and related responses. Various employees play different roles in the ERM process. The board plays a role in policy design and ERM framework development while the management oversees the implementation process. Having a risk reporting structure helps address issues that affect the response plan being executed. It helps staff responsible for various ERM activities to obtain pertinent information to effectively carry out their roles. The internal reporting process involves the operational staff, management team, senior leadership, and the board. In contrast, external reporting involves the communication of the risk profile and responses to the stakeholders.
Monitoring
The efficacy of the ERM elements is monitored regularly to determine the impact on the risk profile. The ERM monitoring may involve ongoing control activities or independent evaluations, such as audits and reviews.
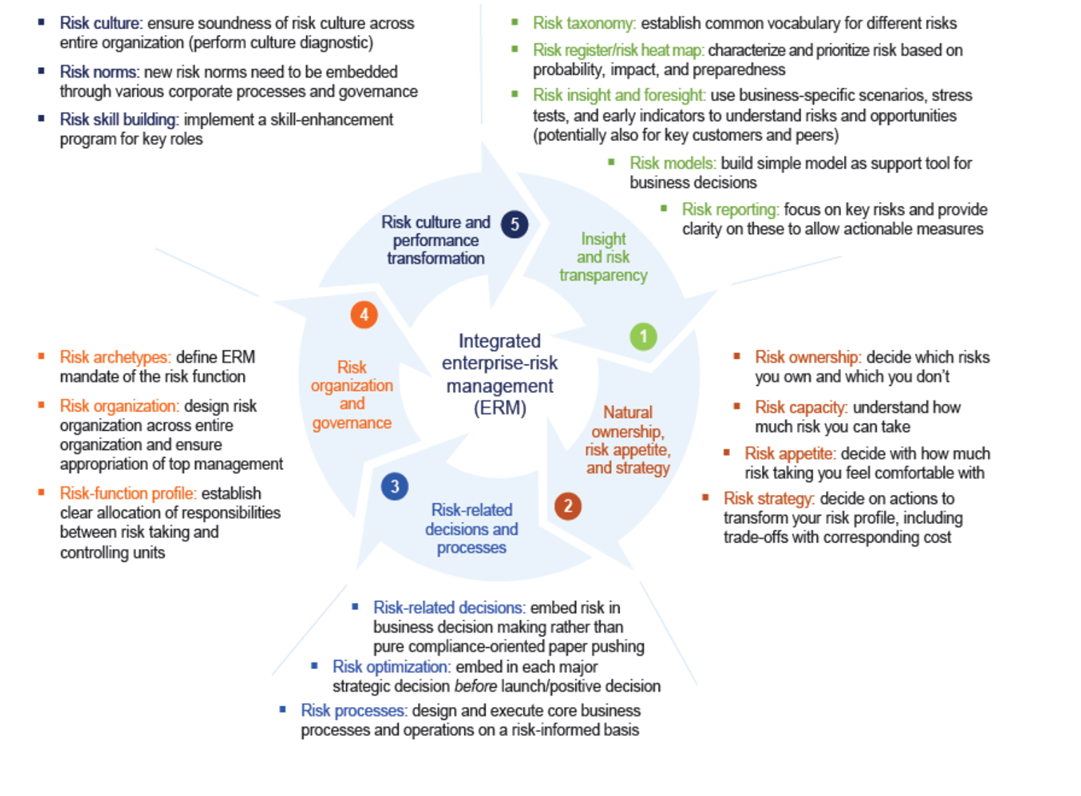
Integrated Enterprise-Risk Management Framework
The banking sector faces unique challenges that pose a threat to growth. The integrated enterprise-risk management (ERM) framework provides a new approach to risk in the banking industry, which is structured around five dimensions. It places the responsibility of developing the ERM capabilities at the hands of a firm’s board. The five core dimensions of the integrated ERM framework include “risk transparency and insight, risk appetite and strategy, risk-related business processes and decisions, risk organization and governance, and risk culture” (Brodeur et al. 2010, p. 1). The recommended actions in each of the five steps are described below.
Risk Transparency and Insight
Most firms have adopted risk identification processes for the early detection and prioritization of risk events. The companies produce annual risk reports cataloging the most significant risks and their likelihood of occurrence and impact. The only downside to this approach is that they omit company-wide risks, fail to reveal the causes of the risks and overlook the multiplicity aspect of risks (Lamarre & Pergler 2009). A robust risk identification mechanism should uncover the root causes. The main components of risk transparency and insight proposed under the integrated ERM framework are risk taxonomy, a prioritized risk heat map, risk insight and foresight, risk models, and risk reporting.
Risk taxonomy entails creating a common vocabulary for the risk types experienced or likely to occur (McNeil 2013). The rationale is to facilitate risk identification and classification for effective management and control. A prioritized risk heat map sorts the risks based on their potential impact, level of preparedness, and likelihood of occurrence (McNeil 2013). One recommended strategy for building a robust heat map is through adequate risk estimation that takes into consideration all the risk drivers. A good heat map can also be generated if a transparent and coherent approach is taken in naming and classifying risks across all the business units. In addition, besides likelihood and impact considerations, other variables – preparedness and lead-time –should be taken into account when constructing a risk heat map.
Another element of the first dimension of this framework is risk insight and foresight. It entails using scenario testing, indicators, and stress tests to explicate high-priority risks at the board level (McKinsey & Company 2013). Firms often use these methods to explore up to five risks that are significant to business operations. Constructing risk models can also provide a basis for business decisions for organizations. The subsequent step entails compiling insightful reports on key risks to illuminate the key actionable measures. Well-designed and integrated risk reports should highlight the board’s assessment of the risks, including the tradeoffs considered and the decisions made to facilitate consistent information flows across the organization (McKinsey & Company 2013).
Natural Ownership, Risk Appetite, and Strategy
This step entails deciding on the risks an organization owns, its risk capacity, risk appetite, and risk strategy. A firm’s risk appetite depends on its risk capacity, which describes a company’s ability to “withstand a risk when it materializes into actuality” while staying clear of undesirable effects or constraints (Brodeur & Pritsch 2008, p. 12). The determination of risk capacity depends on the type of risk and may involve Monte Carlo simulations or discrete scenarios that would then help predict future trends. The risk appetite indicates how many risks a firm will take based on its capacity (McNeil 2013). From its risk appetite, a company can determine the risks it can own. Risk ownership describes the risks a firm has the capacity to control and exploit in order to realize its competitive goals (McNeil 2013).
At the same time, a firm needs to define the risks it wants to mitigate, transfer out, or avoid at this point. Based on the risk appetite and ownership, a risk strategy for the company is formulated. The strategy represents a coherent message or affirmation of the risks that the company has decided to take or transfer. It is normally adopted in the organization’s strategic plan and communicated to the shareholders.
Risk-related Decisions and Processes
This step entails the integration of risk considerations related to strategic planning, resource allocation, and financing in risk-related decisions and processes (Brodeur et al. 2010). A firm’s strategic choices should reflect its risk appetite/capacity. Strategic planning considers the risk assumptions and uncovers the return/risk tradeoffs inherent in a project. Resource allocation gives key personnel the green light to take risks based on the established risk appetite. On the other hand, financing or hedging decisions by the board would depend on the defined risk capacity and potential impacts. In the banking sector, the quality of risk-related decisions/processes depends on how well the liquidity risk is managed in the organization (Brodeur et al. 2010). Therefore, in banks, risk-related decisions are aimed at managing and controlling liquidity risks.
This integrated ERM dimension encompasses three elements: risk-related decisions, risk optimization, and risk processes. Risk-related decisions entail the grounding of risk in all business decisions, as opposed to working to meet regulatory requirements. Similarly, risk optimization must also be embedded in all strategic decisions to achieve favorable return/risk tradeoffs. In addition, the core business operations of the firm must be risk-based to ensure risk-informed responses and actions across all levels of the organization.
Risk Organisation and Governance
The role of risk oversight belongs to a firm’s board. In the risk governance structure, the board collaborates with the line managers and risk officers on risk issues and ensures that the ERM program is optimized for the specific risks that the firm faces. The oversight role also includes the evaluation of risks through the board-risk committee interactions and dialogue (Pergler 2012). The aim is to remove bureaucratic processes that impede effective risk governance. An ERM organizational model may involve a risk officer reporting to the firm’s chief executive officer and leading teams tasked with the management of various risks affecting the organization.
The basic components of an ERM organizational model include risk archetypes, risk organization, and risk-function profile. Risk archetypes entail defining the mandate of an ERM function within the finance unit to introduce risk thinking in managerial processes (Beckers et al. 2013). Risk organization involves the design of enterprise-wide processes, including risk policies/guidelines and resource allocation. Creating a risk-function profile can help the risk team obtain traction in a firm’s business. It entails a clear allocation of duties and obligations of the risk-taking personnel and risk management unit.
Risk Culture and Performance Transformation
The final ERM dimension focuses on risk culture and performance. Risk culture emerges when decision-making behaviors that involve an evaluation of risk/benefit tradeoffs become the norm in the organization. It is defined as the “norms of behavior for individuals and groups within a company that determine the collective willingness to accept or take risks” (Brodeur et al. 2010, p. 5). Appropriate risk norms should be embedded within the organization through corporate-level processes and governance.
A cultural survey or diagnostic can help determine the flaws in a firm’s risk culture, necessitating the need for a change. Mikes (2011) provides four strategies for effecting a sustainable cultural change related to risk in an organization, namely, fostering conviction/understanding among employees through incident reviews, role modeling by supervisors, talent and risk skill development, and establishing formal structures/processes for performance appraisal and compensation. According to Mikes (2011), the process of achieving a high-level risk culture change encompasses four steps: diagnostic risk culture, target-risk norms articulation, development of multilayer initiatives, and ongoing monitoring of risk governance in the organization. Therefore, the risk culture journey culminates in positive risk norms being embedded in all organizational structures and processes.
Risk IT Framework
Public organizations and private enterprises face IT risk in addition to strategic, operational, and market risks, among others. Poor IT security in organizations increases the likelihood of business risks related to cyber threats. The management of such risks is critical to the success of an organization. The adoption of IT brings immense benefits to an entity; however, it also comes with risks.
Since IT lies at the heart of operational efficiency, IT risk is regarded like other enterprise risks that impede the achievement of strategic goals (Deloitte 2014). In most organizations, the management team does not handle IT risks but delegate this role to the IT department. The Risk IT framework (Figure 8) helps businesses integrate IT risk governance into the ERM to support risk-based decisions. The framework also highlights the nature of the risk as well as the organization’s risk appetite and tolerance to facilitate appropriate risk responses. Therefore, it supports risk-aware decisions by organizations.
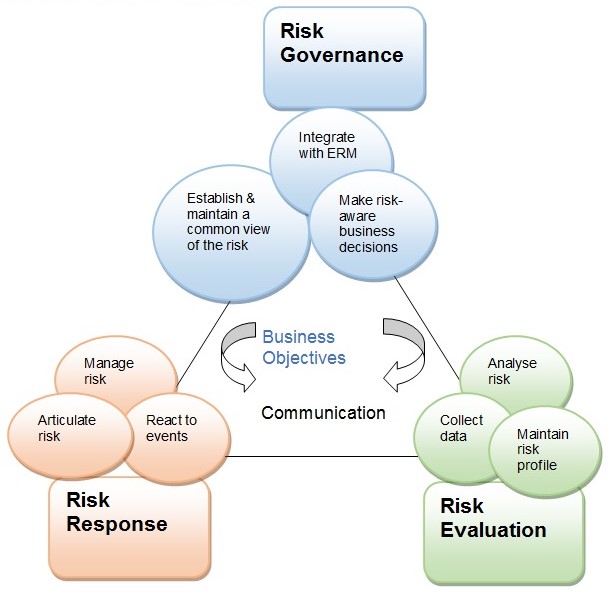
The Risk IT framework is founded on six core principles that support risk governance in organizations. The organization must continuously connect the risk responses to the business objectives, align the management of the risk to its ERM, balance the risk costs and benefits, enhance risk reporting, establish top leadership risk appetite, and incorporate these processes into the day-to-day business activities (Deloitte 2014). The Risk IT framework contains three components or domains, namely, risk governance, risk response, and risk evaluation (Svata & Fleishmann 2011).
Risk Governance
This risk IT domain ensures that risk management practices are integrated with the business processes for enhanced risk-based performance. Risk governance encompasses three processes, namely, integration with ERM, formulation of risk-based decisions, and establishment/maintenance of a common risk view (Svata & Fleishmann 2011). The goals of risk governance are to achieve acceptable risk appetite and tolerance, enhance role clarity in IT risk management, promote risk awareness, and establish a risk culture in the organization.
In the risk IT framework, risk appetite is defined as the “broad-based amount of risk” that an entity can accept in pursuing its mission (Svata & Fleishmann 2011, p. 51). In contrast, risk tolerance means the acceptable variation around organizational objectives (Svata & Fleishmann 2011). These two concepts help an organization establish a coherent view of the risk at all levels. However, they are subject to changes in technology, firm structures, and macro environment factors. Therefore, a firm should continually evaluate its risk portfolio to determine its risk appetite at different times. On the other hand, risk tolerance can be influenced by mitigation costs. Indeed, in some cases, the cost impact of mitigation can go beyond its resources, resulting in a higher risk tolerance (Svata & Fleishmann 2011). Thus, the cost-benefit trade-offs determine the risk levels that an enterprise is willing to tolerate.
The framework also defines the responsibilities of the people involved in IT risk governance. Various individuals are charged with the responsibility of managing IT risks. The board, chief executive officer, and chief risk officer as well as the personnel drawn from the enterprise risk committee play a role in risk governance. In contrast, accountability applies to individuals who allocate resources or authorize specific actions, e.g., the board. Besides establishing responsibilities and accountabilities, risk governance enhances risk awareness and communication in the organization. Risk awareness entails the recognition of risks for specific management action. In contrast, risk communication enhances the discussion around risks to increase the management’s understanding of its effects for appropriate responses. An open risk communication practice enhances risk awareness among stakeholders and increases transparency in risk governance.
Risk Evaluation
The goal of the risk evaluation component of the Risk IT framework is to identify, analyze, and provide “IT-related risks and opportunities” in the organization (Flemig, Osborne & Kinder 2015, p. 6). It entails three processes, namely, analyzing the risk, establishing an institutional risk profile, and collecting data. The goals are to highlight the business impact and develop risk scenarios. The evaluation entails converting IT risks into business risks. It requires the IT and the business teams to develop a mutual understanding of the risks that need management. The stakeholders must have a basic understanding of the risks impacting the business objectives. In this regard, the IT person should know the impact of the identified IT risks on strategic objectives. Similarly, the management should understand the IT-related risks that affect business processes (Fleming, Osborne & Kinder).
Risk evaluation helps define the link between anticipated IT risks and their impact on operations through the expression of such risks in business terms. The methods prescribed in the Risk IT framework for risk evaluation include the balanced scorecard, COSO ERM, and the COBIT information criteria (Potts & Kastelle 2014). Risk scenarios are important in IT risk governance. The scenarios are utilized in risk analysis to determine the likely impact of a risk to the organization. Two complementary methods are used to develop the risk scenarios: a top-down approach and a bottom-up approach. The latter utilizes generic scenarios to develop improved scenarios tailored to the organizational realities, whereas in the former approach scenarios are derived from the business objectives.
Risk Response
The purpose of risk response is to address IT risks in a cost-efficient way and according to the organization’s priorities. The essential processes in this domain of the Risk IT framework include risk management, reaction to risks, and risk articulation (Svata & Fleishmann 2011). This step encompasses the definition of risk response and identification of the key performance indicators (KPIs) based on project objectives. The KPIs indicate whether an organization is likely to face a risk that outstrips the established risk appetite. The choice of the KPIs is dependent on micro and macro environment factors, the size of the organization, and the prevailing regulatory regime (Svata & Fleishmann 2011). The KPI selection process should involve stakeholders to achieve buy-in and support. Further, the selection should involve consideration of the major performance indicators and root causes. The selected KPIs must meet the following criteria: optimal business impact, high sensitivity, and reliability (Claudia, Tehler & Wamsler 2015).
The reason for providing a risk response definition is to align the identified risk with the established risk appetite (Claudia, Tehler & Wamsler 2015). This implies that defining a response will ensure potential residual risk falls within the acceptable tolerance threshold. The possible risk response options include avoidance, reduction/mitigation, sharing/transfer, and acceptance. The choice of the risk response option depends on its cost (capital, wages, and operational costs), the significance of the risk as shown in a risk map, the efficacy and efficiency of the response, and the organization’s capacity to execute the response (Hooper 2014). Therefore, an entity should prioritize the response options based on the above criteria and select the optimal risk response.
Issues learned from Literature
Summary
In this chapter, a systematic review of scholarly literature on risk governance has been done. Although risk governance definitions vary widely, they all feature multi-actor involvement and transparency/accountability principles. It can be conceptualised as multi-stakeholder network/process for evaluating and managing public risks. Risk governance provides a framework for the involvement of all actors in responsible management of risk problems. The major risk governance frameworks reviewed in this research include the Brown and Osborne’s (2013) model for public service innovation, IRGC model, modified IRGC framework. Risk governance is a cyclic process comprising five interconnected phases that culminate in an optimal risk management option for an identified risk. The adopted risk governance approaches in public service organisations in countries such as the UK focus on the institutionalisation of risk analysis tools to support policy/decision rationales and accountability. The identified issues of risk governance in the public/government sector include the communication/inclusion of multiple stakeholders, multidisciplinary knowledge/experience integration, routines, and flexibility of regulatory approaches.
The review has examined eight existing frameworks of risk governance in various sectors. The first one is the Brown and Osborn’s (2013) framework, which is applicable in the public-sector innovation. It links technocratic, decisionistic, and transparency to different possible formulations of innovation, i.e., evolutionary, expansionary, and total innovation. Evidently, this framework is too simplistic to cater for the diverse multi-actor processes involved in public sector risk governance. The second framework reviewed is that provided by the IRGC. Its five phases – pre-assessment, appraisal, characterisation and evaluation, management, and communication – provide a foundational theoretical lens for risk governance across all sectors. However, clearly, the framework is too linear to reflect the iterative and integrated nature of public sector decision-making. Nevertheless, it provides a good starting point for the development of a more integrated framework of risk governance. To avoid the problem seen in the earlier IRGC model (linearity), the modified IRGC framework by Renn, Klinke, and van Asselt (2011) involves a cyclic process. It also introduces the element of multi-actor inclusion in the pre-estimation stage.
The problem seen in the IRGC framework also occurs in the OCC’s framework, which is meant for corporate risk governance in banks. This framework involves additive steps of establishing a risk management system, risk appetite, and risk culture that proceed in a logical sequence. In contrast, the IPCC model highlights a host of activities for reducing natural risks and managing residual risk events. The REPM framework centres on value creation for the organisation through oversight/planning, business-level planning, operational execution, and monitoring and compliance of corporate risks. In contrast, the ERM framework focuses on the unit-level and entity-level business risks that threaten a firm’s operations. The risk IT framework gives integrated activities for risk governance, risk evaluation, and risk response to help organisations make risk-aware decisions.
Four key issues or themes emerge from the literature reviewed. The first one is the diversity of stakeholders and breadth of their interactions in a public risk environment. The appropriate risk appetite for organisations is another issue evident in literature. Effective risk communication/reporting that reflects the diversity of stakeholder backgrounds and interpretations is another key issue in this research. Finally, the challenge of embedding a new risk mind-set or culture comes up as a significant issue in risk governance literature.
Literature review II: The role of Internal Audit Function in governance assurance
Introduction
In today’s business environment that is characterised by rapid economic globalisation and the stricter legal landscape, organisations are forced to review their strategy periodically to manage financial and non-financial risks to thrive. These conditions also demand a redesign of organisational structures, processes, and systems in a project context. Efficient management of risks in organisations is crucial for firms to navigate increasingly complex uncertainties, including natural disasters and fraud risks (Dafikpaku 2011). Corporations control risks as a routine business operation. However, to withstand growing economic globalisation waves, it is essential for both public and private institutions to adopt effective mechanisms for risk identification, assessment, and response.
The internal audit function evolved from risk governance to strengthen a firm’s financial risk management practices (Huibers 2013). Organisational stakeholders would want an efficient internal process for managing uncertainties, as opposed to depending solely on external audit reports. They also require regular information about the performance of the firm to inform their investment decisions. The risk-based audit function is meant to enable organisations to meet stakeholder interests, thrive in a rapidly changing business environment characterised by financial uncertainties, and respond to market and regulatory requirements (Burton et al. 2012). The aim is to enhance enterprise-wide operational efficiency to minimise risk, support financial reporting, and avoid failures (Huibers 2013).
From this background, it is clear that the risk-based approach to internal control influences risk governance. The efficient evaluation of departments or units can uncover control weaknesses that expose the organisation to risk. Results from surveys of auditors as respondents can help strengthen risk management processes, such as error detection and fraud discovery (Ravindran et al. 2015). The process ensures that financial statements are accurate and reliable. Auditing is a standard practice for preventing accounting fraud risk in organisations. Further, a risk-based audit can reveal risks with a considerable impact on financial reports (Ravindran et al. 2015). Subsequently, a significant management focus is directed towards those areas.
Financial uncertainties often arise from organisational records and change management. Businesses face constant pressure to innovate and remain competitive. As a result, they must manage change internally to control new risks. Proactive risk management of an organisation’s financial and nonfinancial information is critical during the transition period. Such an approach will result in an efficient decision-making process in all areas, including records management (Huibers 2013). Therefore, a coherent risk governance policy can ensure that departmental heads cooperate, particularly when implementing mitigation measures to preserve financial/nonfinancial information.
This chapter reviews the relevant literature on risk-based audit processes in public sector projects. The fundamental element examined is the internal audit function in the context of risk governance. The chapter involves a synthesis of existing knowledge in this area. Because of the significance of the internal audit in risk governance, this review begins with a definition of the internal audit function and its role in the public sector, organisational projects, and governance assurance. The analysis clarifies the elements of a maturity model developed in the previous chapter, including strategy, risk appraisal and insights, risk decisions and implementation, etc.
The Internal Audit Function
A fundamental practice in good corporate governance is internal auditing. It gives a clear position on a firm’s risk control mechanism to the board, CEO, and senior management to help strengthen risk management. The Institute of Internal Auditors [IIA] (2014) defines internal auditing as “an independent, objective assurance and consulting activity designed to add value and improve an organisation’s operations” (para. 4). The chief audit executive leads this risk-based function. It enables an enterprise to meet its objectives through a systematic and efficient evaluation and response to financial and non-financial risk control issues. In this view, internal audit is an objective and confirmatory process that brings value to the firm and helps streamline management processes (IIA 2014). From this definition, it is clear that this function is intertwined with management or board follow-up activities in the corporate governance framework. A system of institutional accounting controls ensures that all transactions are recorded in strict adherence to the set guidelines to aid financial reporting and accountability.
Internal audit plays a crucial role in the public sector. A survey by Ravindran et al. (2015), which involved 90 chief audit executives in the UAE, revealed that 82% of them perform risk governance functions of assurance, consulting, or support in their institutions. Internal audit is a critical pillar of good public-sector governance. In general, public sector auditors play assurance, participative, and consultative roles. By offering independent and objective reports on whether the management of public resources is done responsibly, they assist institutions or agencies to attain “accountability and integrity, improve operations, and instill confidence in the citizens” (The Institute of Internal Auditors [IIA] 2013, p. 5). In this regard, the audit function supports governance obligations of oversight by determining if government agencies or departments are performing their tasks and flag up scandals. It also provides policymakers with advisory services developed through an objective evaluation of projects and operations in the public sector. Lastly, internal auditing detects trends and challenges for timely interventions.
In projects, the traditional role of the internal audit unit is assurance (Huibers 2013). However, it can have generic responsibilities, such as consultative and participative functions as well, if there are adequate safeguards. The consulting services include quality assurance, i.e., advising the program managers on project milestones, analysis of risks and controls, championing change management, and designing and facilitating training/workshops (Al-jabali, Abdalmanam & Ziadat 2011). The participative responsibilities include providing technical expertise and documentation controls and project coordination. Some fundamental preconditions that must be met for internal audit to perform consulting or participative functions include the management should be responsible for project risks and appetites, the audit committee must approve its roles, the auditors should not be involved in the implementation of risk solutions or responses, etc. (Huibers 2013).
As aforementioned, the traditional function of internal audit is project governance assurance, which encompasses program reviews. This role occurs at four levels: initial project, milestone reappraisals, business readiness assessment, and post-implementation evaluation (Hubers 2013). The reports also focus on program deliverables and the effectiveness of internal controls. In this way, the senior management is assured that the risks are maintained at acceptable levels. In ERM, the internal audit team gives assurances on the effectiveness of risk governance processes, controls, and assessment and reporting (Florea & Florea 2016).
Development of a Maturity Model for Risk Governance Audit in public sector
The maturity model developed in this research is intended to give a framework for the auditing risk governance. Internal audit activities are important in identifying cases of non-adherence to the risk governance framework by the staff across all departments. The adopted maturity model comprises of five interrelated domains: strategy, risk appraisal and insights, risk decisions and process implementation, risk management and governance, and review of risk development and decisions. Just like in the IRGC framework, risk communication occurs throughout the five phases of this model. This requires public organisations to establish a risk culture, adequate financial and technical capacity (resources), appropriate risk appetite levels, and risk ownership. The model is based on existing frameworks, namely, Integrated ERM model, the modified IRGC model, and the OCC’s framework. The description of each domain and its determinants is given below.
Strategy: make sense of the present and explore the future
Strategy, as a concept, has military origins. It is what links policy and tactics used in combat. In business, a strategic plan is the means that an entity employs to counter the rivals’ moves. Nickols (2016) explores different meanings of the term ‘strategy’ as used in literature and presents three conceptual definitions. First, strategy refers to any action by the senior management that is critical to the organisation. Second, it encompasses fundamental directional decisions with specified goals. Third, it comprises particular operations essential in realising both short-term and long-term organisational objectives. In other words, it responds to questions about what the firm should be doing, what goals it seeks to accomplish, and how to meet them.
A strategy is a critical element of the enterprise risk management (ERM) framework. It is combined with another concept – risk appetite – to form the third domain or dimension of the model. Organisations with a risk-taking culture often outline the acceptable risk levels and the specific benefits of each risk to inform strategy (Frigo & Anderson 2011). They define the risk appetite based on the risk capacity and market conditions. A strategic plan communicates the organisation’s policy on those risks it is willing to embrace or own to stakeholders (Brodeur et al. 2010). Risk management is integrated into organisational planning to support the overall strategic direction and operations. According to Brodeur et al. (2010), the integration of risk management into organisational strategy is a best practice in ERM.
Previous research by IIA has shown that the listed companies in the financial sector have strict regulatory requirements to set up proper risk management function in the companies and force them to comply the regulations. However, the regulatory bodies don’t force public sector to comply with this regulation therefore it is important to demonstrate the board and top management the value of risk management and to adopt in order to secure the support from top. (IIA research report 2015)
Risk Appraisal and Insights
The risk assessment process begins with risk identification. This step generates a list of all risks that an organisation is exposed to and related opportunities (Aven 2016). Most firms have risk identification mechanisms for identifying and appraising risks unique to their industry or sector, In addition to naming the significant threats, the process should create risk categories, such as financial, operational, etc. (Cox 2012). They develop an annual risk report that lists the most significant risks and their respective likelihood of occurrence and impact. Based on the IRGC framework, facts and assumptions pertaining to a particular risk are determined during the risk appraisal phase. The process entails estimating the probability and impact of each identified risk (Bernado 2016). A risk appraisal process should be comprehensive in order to capture not only the main risks, but also their root causes or risk drivers. Prokopenko and Bondarenko (2012, p. 24) state that the presence of a clear taxonomy of operational risk terms guarantees consistency in “risk identification, exposure rating, and management objectives”.
The risk insight and foresight in relation to threats to firm operations. It gives an organisation the ability to map or delineate the potential impact and probability of a risk related to a specific activity or operation. The probability of occurrence may range from low (unlikely) to very high (almost certain) while the impact of the risk could be minor, moderate, major, or critical. The impact and probability of occurrence of a risk linked to a project objective/outcome should be scored to allow risks to be compared. The key methods firms can use to map out and prioritise risks inherent in project objectives/outcomes at the board level include scenario testing, indicators, and stress tests (McKinsey & Company 2013). The assessment of risks entails assigning numeric values to every factor. This process involves two stages: a preliminary screening using qualitative methods followed by a quantitative evaluation of critical risks. the quantitative methods involve numerical ratings, while the qualitative ones require descriptive scales (Curtis & Carey 2012).
The dynamic nature of the business environment means that risks are always evolving. As such, organisations must continuously recalibrate their risk assessment mechanisms to reflect these changes. Methods such as scenario analysis are intended to support strategy by anticipating risks and linking them to the objectives (Goodson, Mory & Lapointe 2012).
Risk Decisions and Process Implementation
The quality of internal controls and decisions are the hallmarks of a robust risk governance process. As such, risk must be integrated into all business or project decisions as opposed to pursuing compliance-related goals (Beckers et al. 2013). Effective risk governance requires the integration of various risk considerations and trade-offs to realise project objectives/outcomes at minimal risk exposure (Hopkin 2012). From an audit perspective, the key considerations in assessing risk-related goals and process implementation and compliance with the framework include grounding the risks in all business decisions, whereby, decision-makers base their plans on assumptions about the uncertainties associated with specific project objectives/outcomes (Ward & Chapman 2011). This normative approach entails identifying the risks, estimating their likelihood of occurrence, effects, and outcomes, choosing a path to pursue to accept or avoid them, and designing effective responses (Beckers et al. 2013).
Decision trees can be utilised to express the full extent and complexity of the variables and premises involved and optimise risk-based decisions. This approach requires that risk optimisation measures be embedded in strategic decisions – through evaluation, reports, and mitigation – before execution (Carawan 2016). According to United Nations Economic Commission for Europe [UNECE] (2012), strategic decisions or choices must be anchored in “risk transparency and insight” and must reflect the organisation’s risk appetite (para. 13). Therefore, the auditing process should evaluate the accuracy of the assumptions included in the strategic plan, the acceptability of risks owned or transferred as planned, and the appropriateness of the risk-return trade-offs. In this regard Risk models can be used to simulate hypothetical risk situations to support business decisions.
Risk management and Governance
The formalisation of risk considerations in decision-making involves systems of accountability that reinforce risk-based behaviour in the organisation (Brodeur et al. 2010). The board has an oversight role in risk management and governance. From the integrated ERM programme framework, risk management and governance is seen in how the board works with line managers and risk officers in a project to address specific risks. It is the organisational ERM model for optimising all risk types through risk reports, evaluation, and mitigation (Carawan 2016).
The board’s role in risk oversight covers the assessment of various risks through interactions with the risk committee and line managers (Pergler 2012). Curtis & Carey (2012) mention that Risk-minded directors lead discussions on risk issues and ensure that the ERM function is well facilitated and has the right skills and technology to monitor risks and execute effective responses. They also disapprove bureaucratic processes that impede board-risk committee interactions.
Therefore, when auditing the risk governance structure of a firm, the focus should be on who is responsible for risk oversight. In most firms, the senior management considers risk oversight a sole responsibility of the audit committee of the board. However, this perspective fails to take into account the significance of risk oversight to a firm’s performance (Pergler 2012). It is also indicative of the casual manner in which risk processes are handled by the firm.
The involvement of directors in risk evaluation is the hallmark of oversight. The board should hold a discussion of risk and develop the risk management policy that all employees should follow. On the contrast, Regulatory requirements to adopt risk management practices exist in the banking, securities, and insurance sectors. Firms operating in these industries are required to utilise risk management tools, policies/procedures, quantitative risk measurements, acceptable risk thresholds, and hedging strategies (Harle et al. 2015). Besides board involvement in risk processes, having a separate risk committee can help cultivate a risk aware culture in the organisation. However, even with a risk committee, the ultimate body charged with the role of risk oversight is the board. For this reason, the composition of the board is critical. A mix of backgrounds will help provide a diversity of views on the risks (Carawan 2016). Additionally, Mikes (2011) notes that career CROs mobilise “concepts, frameworks, technologies, risk models, and interpretations” to define, assess, and manage uncertainties (p. 10). Therefore, they play a critical role in decision-making and risk control.
The presence of firm-wide policies helps specify an organisation’s formal approach to addressing risks and provide guidelines for staff role definition, risk communication, whistle-blowing, ethical conduct, internal risk control, accountability and ownership levels, and internal audit for assurance purposes. All these factors represent a structure of boundaries and standards dictating risk-taking in an organisation. Another component of institution-wide policies of a risk-based organisation includes internal controls for tracking and reporting risks (Reding et al. 2013). It encompasses factors such as risk function, risk treatment plans and response strategies, identification, assessment, and prioritisation strategies, risk indicators, regular bottom-up risk communication, formal risk oversight, and fraud risk evaluation.
Review of Risk Development and Decision
The conditions in which risk decisions are made are not static. New data or better options may arise, pushing organisations to reconsider earlier choices. Therefore, it is essential for the firm to review or amend the current risk management processes and decisions. Effectiveness evaluation may involve internal audit assurance to identify gaps in the RM framework (Verbano & Venturini 2011). The auditing of institutional RM guidelines or procedures would reveal the suitability of the existing model and areas that need enhancement. In addition, there is a need for an ongoing update of an organisation’s risk assessment system to ensure it works according to ERM standards. Progress reports of the RM processes should be presented to the oversight committee for action (Verbano & Venturini 2011). The management-agreed continual improvement plan would enhance RM practices in the organisation.
The existence of independent quality assurance by a third party can also reinforce risk development and decisions. Such a function gives an advisory on the quality of the “internal control system” integrated into the operational processes based on a review of the project process and deliverables (Huibers 2013, p. 5). It is also important to define iterative mechanisms critical for the optimisation of the objectives. One such bottom-up approach involves guidelines for oversight by the board or audit committees. In this way, information from the reports by line managers (risk owners) can inform joint decisions on risk responses (Curtis & Carey 2012). Further, the monitoring and review of the RM framework generate data that can support strategic planning. If the model does not enable the organisation to meet the intended outcomes or objectives, then it should be amended to make it more useful. In addition to that the international standard recommends that the organisation should develop the risk management framework and implement it and it should be continuously improved. (ISO 31000)
Risk Communication
Robust risk communication processes can add value to the RM function. Communication between the board and executive and line management is needed for the organisation to acquire a deeper understanding and insights into the potential risks (Nottingham 2014). Mechanisms that support risk communication across all levels can facilitate efficient risk identification, assessment, and response. Another critical component of effective risk communication is transparency. According to Huibers (2013), the board requires a thorough understanding of the risks to make sound decisions. Such clarity can only come from a culture that supports both upward and downward information flows.
The coordination of RM roles and duties across departments is another critical area of risk communication. In most organisations, the model adopted involves a central risk department that is well facilitated and staffed. In the UAE, most firms use teams or functions, such as the internal audit unit, to organise RM activity (Ravindran et al. 2015). The coordination of risk activities may also involve risk champions. This model is a pragmatic approach that is ideal for small to medium enterprises. It entails identifying risk champions in each department to oversee RM activities (Ravindran et al. 2015).
The communication must also involve risk awareness, which aims at increasing the recognition of risks, tolerance, and understanding of their impacts. It may include initiatives such as simulations, case studies, and mentorship (Jen 2012). Risk reporting efforts may also comprise internal communication processes, performance monitoring reports, risk registers, heat maps and dashboard, key indicators, and aggregated exposure documents. Organisations can use one or more of these methods to communicate risk. In the UAE, most firms use risk registers, heat maps/dashboards, and key risk indicators (Ravindran et al. 2015).
Nottingham (2014) outlines four factors necessary for an improved risk communication capability: clear risk governance roles, an integrated view of risks, risk appetite statement, and risk reporting and dialogue. Effective risk communication begins with clarity of risk governance structure. Firms should ensure that the allocation of roles is well defined at the board level and management level and the organisational structure facilitated risk dialogue (Nottingham 2014). Having an integrated view of risks enhances the understanding of the relationship between risk-return trade-offs and business objectives. It entails having a common “definition of risk, business objectives, value drivers, and strategy” relevant to the risks (Nottingham 2014, p. 5). A clear risk appetite statement also contributes to effective risk communication. It entails a quantitative and qualitative expression of the risks that a firm has decided to take. The statement promotes risk communication throughout the firm and informs interactions between the board and the management. Further, having a reporting structure that promotes risk governance in the organisation is important. This approach can help track organisational performance relative to the set risk appetite.
Risk Culture
Risk culture encompasses the values, capabilities, and behaviours that shape an organisation’s risk governance practices and decisions (Polk 2014). It describes the norms of behaviour in an organisation that determine “the collective willingness to accept or take risks” and the capacity to understand and respond to company risks (McKinsey & Company 2013). From this definition, Organisations must take specific steps to cultivate risk-based practices. Risk culture can be attained by promoting accountability concerning the roles of the chief risk officer, audit executive, CFO, and head of compliance (Ravindran et al. 2015). A risk awareness program is also necessary to increase risk ownership, identification, and performance (Jen 2012). Such an initiative would also lead to better decisions due to more robust assessments based on accurate data.
Achieving a sustainable cultural change in the organisation may involve multiple strategies. Fostering understanding among employees on the accepted risks is one way of initiating a cultural change. The specific actions may include incident reviews to enhance employee understanding of the “risk errors and near misses” to build a positive risk culture (McKinsey & Company 2013). A second approach involves role modelling. Supervisors and peers can help set professional behaviour that involves considerations of risks in making decisions (McKinsey & Company 2013). Formal training of staff and the board on risk management will equip them with skills and competencies to behave or act differently when addressing uncertainties (Brodeur et al. 2010, Mckinsey & Company 2013). Cultural change can also be achieved through formal mechanisms like formalised risk escalation processes and the inclusion of aspects of risk in performance appraisals The approach will also ensure that risk thinking is incorporated into strategic planning and resource distribution.
The internal audit role can also promote risk culture. As Ravindran et al. (2015, p. 39) note, auditing gives “objective and independent assurance to the board” on the efficiency of RM and internal controls. It reveals the effectiveness of the risk management program, which helps enhance risk-based behaviour and practices.
Some boards sanction a risk culture audit to determine the status of the RM efforts. The findings not only give an independent assurance on RM processes but may also trigger a formal RM program in the organisation (Ravindran et al. 2015). As aforementioned, the development of talents and skills can also cultivate a risk culture. Tailored educational workshops or programs may be necessary to achieve this goal. Other strategies for attaining a risk culture in an entity include fostering risk understanding/conviction and training on fraud risks to increase awareness and ethical practices. Optimal risk oversight is crucial in preventing high-risk activities that may affect project objectives and outcomes. The leadership and commitment from the senior management is required to “translate risk strategy into operational objectives and assign management responsibilities in the organisation” (Beckers et al. 2013, p. 16).
Financial and Technical capacity
Financial and technical capacity is a crucial determinant of an organisation’s risk resilience. A mechanism for allocating adequate capital to address identified risks is a best practice in RM. Through resource allocation, the risk officer is given the green light to take specific risks that have specified returns (Brodeur et al. 2010, UNECE 2012). The investment choices involve trade-offs between the uncertainty and anticipated benefits. Flexibility is also an important consideration when making capital allocation decisions. Such choices form a critical part of a firm’s risk strategy.
The technical capacity leads to a useful risk appetite articulation, monitoring and reporting, and control (Deloitte 2014). In this regard, the ERM function must have individuals with analytical skills on RM and adequate understanding of the impact of their decisions on an organisation’s risk profile (Curtis & Carey 2012). A mechanism for acquiring skills and management capabilities would determine a firm’s technical capacity to address risks. The required competencies can be obtained through the training of staff and managers.
Organisations leverage on the expertise of the employees or risk owners to manage uncertainties. Therefore, human skills are critical in detecting and executing risk controls on a daily basis. In particular, the operational management – a critical unit of enterprises – has a supervisory function in the execution of risk mitigation measures by staff (IIA 2013). The availability of resources and risk technology would also affect a firm’s financial and technical capacity. Human skills are not enough. Efficiency in risk management requires technology, including automation, to handle issues such as scenario analysis. Risk resilience in volatile economic conditions can also protect the firm from risks that fall outside the purview of its financial or technical capacity. Risk capacity depends on the financing decisions related to the project or operation. Financing decisions, including taking long-term loans, have a direct impact on the risk capacity of the organisation. A firm’s financial structure determines its capital needs and cash flows. Thus, the focus of the audit should be on whether the board is knowledgeable about the risk ramifications of the financing decisions to the project objectives/outcomes (UNECE 2012).
Risk Appetite
Risk appetite refers to the thresholds of risk – level and type – that the board can assume to realise organisational or project objectives (Brodeur et al. 2010, Polk 2014). According to ISO 31000 the risk appetite is “amount and type of risk that an organisation is prepared to pursue, retain or take” ISO (31000-2009). It allows decision-makers to accept risk levels that reflect the strategic direction they want to pursue. A risk appetite framework enables risk-takers in the organisation to assume risks consciously “within limits translating into the strategic objectives” (Deloitte 2014, p. 10). A risk appetite statement conveys to the staff amount of risks a firm decides to own in line with its strategy (Deloitte 2014). Employees must then apply these measures and limits in their day-to-day jobs. A firm’s risk capacity should be understood before setting these thresholds. It is determined using either Monte Carlo simulations or discrete scenarios (Brodeur et al. 2010). The risk appetite is increased or reduced depending on the company’s risk capacity and expected trade-offs.
The appetite limits should be reviewed periodically since industry and market conditions are always evolving. It entails an ongoing “process of understanding and judgment” that is responsive to the changes in “business, competitive, and control environments” (Deloitte 2014, p. 12). The new appetite levels should be cascaded down to the strategic objectives. Further, a frequent revision of risk appetite is required to align it with the new strategy. This framework gives the board and management with data on the appropriate threshold levels for the organisation. Thus, risk appetite information and tools should be aligned with the two tiers. Communication and reporting of the tolerance levels and limits can help trigger escalation and appropriate corrective action (Deloitte 2014). Further, risk-taking activities in the firm can be tied to strategic objectives through the integration of risk appetite into performance management.
The other determinant is new business approval, which should be captured in the risk appetite statement. The approval process should be rigorous and involve constructive dialogue between the senior management and risk management group. The internal audit unit should be strengthened to identify risks associated with new product/business process development, i.e., product development risk. The audit process should ascertain that firm operations occur according to the approved product development process to avoid related risks (Polk 2014).
Ownership
Not all employees can be responsible for risk management. ISO 31000 provides another clear definition of risk owner “person or entity with the accountability and authority to manage the risk”. A risk owner is a person bearing the ultimate responsibility for managing uncertainties, e.g., the head of a business unit (Curtis & Carey 2012). His/her roles include identifying, measuring, tracking, and controlling risks (Curtis & Carey 2012). He/she also prioritises activities, creates risk awareness in the firm, and escalates problems that require board-level interventions.
Key considerations in ownership allocation are risk sources and the individual well positioned to understand and execute effective responses (Curtis & Carey 2012). Most risk-bearing organisations use a risk register to identify and assign potential hazards to the risk owners for management. Based on the causes, likelihood, and impact, individuals best placed to monitor and report risks are selected either from within or outside the firm for each business unit. Another dimension of ownership is accountability. All individuals from the board to the staff are responsible for risk management. However, the level of accountability varies between them. The ultimate responsibility remains with the CEO who “assumes ownership for all risks and reports to the board” (Dafikpaku 2011, p. 16). Risk officers, line managers, unit heads, and team leaders also have varying levels of accountability based on the objectives of the department (Dafikpaku 2011).
Having a risk management function as a standalone unit can help strengthen RM in the areas of responsibility of the risk owners. It supports the firm in the design and execution of efficient processes for risk identification, analysis, and treatment (IIA Norge 2017). It can also assist track an organisation’s risk profile, detect potential threats, and convey risk information to the board and stakeholders (IIA Norge 2017). A risk team headed by the CRO plays a role in the coordination of risk activities. An internal audit function can also coordinate RM processes through “participation in risk facilitation activities” (Ravindran et al. 2015, p. 41). An organisation can also use risk champions or third-party professional service providers to achieve the same purpose.

Summary
The review of literature in this chapter has focused on the internal audit function and the determinants of the maturity model for good risk governance. The analysis clarifies a multiplicity of risk metrics, processes, practices, and standards used to address uncertainty and control the outcome. From the review, the board depends on audit findings to strengthen RM processes. The internal audit function in organisations plays three critical roles: participation, facilitation, and assurance. A firm’s ERM capability can be improved through a robust risk strategy process, efficient risk identification and appraisal mechanisms, and data-supported decisions and responses.
It also requires robust risk management and governance structures that include formal decision-making channels, organisation-wide policies, management support, and CRO roles. A review of risk development and decisions ensures continual improvement of ERM in line with strategic objectives. It also requires active risk communication to increase awareness and create a risk-based culture. The organisation’s financial and technical capacity can be improved through staff training. Best practices in RM require that the risk appetite levels be adjusted periodically to reflect the firm’s capacity and changes in market conditions. The organisation should allocate risk ownership to persons closest to the uncertainties/threats, such as unit managers.
Literature Review III: Effectiveness of Projects in Public Sector
Introduction
In the recent decade, the necessity for improvement in the functioning of governments has created the need for a reliable systemic approach. Currently, the approach universally accepted by governments is the creation of projects targeting specific issues and implementing recommended solutions. Understandably, the success of the described projects depends on the skills and expertise of staff members responsible for the implementation. In the public sector, the likelihood of success is further decreased by budgetary constraints and lack of consistent control. Finally, the increased demand for transparency and accountability characteristic for the sector requires the integration of respective practices, further complicating the matters.
In order to address the host of complications caused by these factors, various project management practices have been applied to the projects. Such a move allowed the project managers to utilize numerous readily available methodologies, instruments, and tools and incorporate measurement systems accepted as industry standards in the private sector. However, it has been pointed out by critics that the effectiveness of practices designed for for-profit organizations may not provide the expected improvement. The purpose of this literature review is to provide information on the principles of managing projects in the public sector, highlight important factors responsible for their success, define the roles of effectiveness and efficiency in the assessment process, outline approaches to risk management, and describe relevant processes.
Projects in Dubai
Since the 1970s, the Emirate of Dubai enjoyed rapid economic growth and modernization. Dubai itself became synonymous with unprecedented mega projects, with the investment of billions of dollars in massive infrastructure, real-estate and other related projects. While many of these projects were financed, developed, and built by the private sector, the lion’s share of this economic activity indirectly belonged to the government. Most mega projects were undertaken by State-Owned Enterprises (SOEs) that were created and owned by the government of Dubai, most notably including Dubai Holding and Dubai World (Al-Malkawi & Pillai, 2013).
The purpose of utilizing SOEs was to delegate the responsibilities of development and modernization to specialized entities that were capable of planning, financing, and executing huge projects both effectively and efficiently. While the SOEs of Dubai gained particular prominence as many of the projects were impressive in magnitude and profile, the reliance of governments on SOEs to plan, develop and implement projects in the Middle East was not new. An OECD report for example, states that despite the many failures of publicly-financed and SOE-managed projects worldwide and the Middle East, the experience of GCC economies, especially Dubai, with such structures has been successful, “having produced a number of profitable, and by most accounts, well-run public enterprises in a number of strategic industries” (Middle East Banker, 2012, p.1).
The OECD report (2012) identifies three major characteristics of SOEs in the GCC region that are relevant to financial risk management: insulation from politics, insulation from bureaucratic interventions in operations, and clear lines of command. These three characteristics are directly related to governance and indicate that SOEs were staffed by experts who enjoyed a substantial degree of freedom and independence to make decisions related to investment in major projects in line with the vision of the political leadership (Middle East Banker, p.2). In Dubai for example, the portfolio of the Emirate’s largest SOE, Dubai World, constituted of development and real estate projects, hospitality, investment, financial services, commodities, marine services, ports management and free-zones (Aubert, 2013).
By insulating SOE’s from political and bureaucratic intervention and meddling, the government of Dubai empowered its SOEs and granted them a significant degree of independence as well as access to financial and other resources to ensure that projects were selected, planned, approved, and executed professionally and efficiently. Additionally, the clear line of command within each SOEs was intended to establish clear accountability and responsibility for performance (Middle East Banker, 2012).
Dubai’s SOEs were hailed for their success as they were considered among the best run SOEs in the world and among the best run companies in the Emirate (Middle East Banker, 2012), and in principle, they were also supposed to insulate the government of Dubai from financial risks pertaining to their projects, an assumption that was put to the test during the financial crisis of 2009 (Al-Malkawi & Pillai, 2013).
During the 2000s, Dubai witnessed rapid economic growth and activity, much of which was fueled by the engagement of its SOEs in numerous costly projects. These SOEs were profitable as long as economic growth persisted and as long as prices continued to appreciate as a result of unwavering demand. This trend, however, was slowed down during the global financial crisis of 2007/2008 and the subsequent credit crunch and the liquidity shortages which hammered many world economies. Dubai’s SOEs were suddenly faced with rapidly declining demand and high operational costs in the long term with no prospects for solvency in the short term. (Aubert, 2013).
Currently, Dubai has become a centre of innovation. To keep up with the pace of change, the government allocates considerable resources for modernizing the public segment in accordance with stakeholder expectations (Ibrahim 2015). Currently, several such projects have already been successfully launched. The brightest examples include the software solutions in transportation, safety and security, and social activity domains (Buhumaid, Constantin & Schubert 2016). In addition, a number of initiatives exist in Dubai intended to further promote and streamline the development and implementation of projects in the public sector (UAE Government n.d.). Thus, it is necessary to establish a framework for the assessment of efficiency of projects in the public sector.
Effectiveness and Efficiency of Projects
Samset et al. (2016) give a fundamental logic of public projects from the identification of the societal need to the achievement of the desired effect. The actual needs of the citizens inform the development of a relevant project concept to address them. A relevant project is the one whose outcomes/deliverables are considered sustainable. As a result, the identification of the societal needs is the starting point of public project development. The formulation of objectives and goals/targets based on the identified needs is then done to guide the subsequent execution and monitoring of goal-oriented initiatives. This process is illustrated in Figure 10 below.

In public investment projects, after formulating the goals, the means or strategies for achieving them are selected. In this case, efficiency in the translation of resources into outputs and the utilization of the outputs to attain a sustainable effect on the population is of utmost significance (PSGB 2012). In the front-end model, this process is referred to as project design. The actual utilization of the selected means or strategy occurs in the execution step, generating an output/result. In the public sector, the output could be an infrastructural product or a new system of citizen service delivery. The utilization of the output determines the project outcomes or deliverables.
The objectives of public sector projects are fundamentally different from those of private sector projects because the focus is not on financial returns, but rather on the public good or societal objectives (PMI 2013). Therefore, the overarching goal/objective of investment in public projects is to maximize the population of direct beneficiaries or citizens.
The definition of objectives/goals for a particular project utilizes the standards and the outcomes of a needs analysis of the stakeholders. As Cormican (2016) puts it, the process of defining the objectives requires a deep understanding of the needs and priorities of the people affected by the project. Logically, for public sector projects, the objectives/goals relate directly to the societal needs and effects. The societal needs can be identified in two main ways. The first one involves planning experts who review and assess the specific needs before describing and expressing them (Pulmanis 2015). The second approach entails the involvement of the citizens and other stakeholders in the identification of the needs, which are the prerequisite for the formulation of objectives. The first method is considered a classical public planning approach. Its main advantage is the efficiency or speed with which the needs are identified. It involves a quick needs analysis by experts based on accessible data. Therefore, the approach is entirely dependent on expert knowledge and scientific tools. In contrast, the involvement of stakeholders in the identification of needs and in the formulation of objectives is complex, more costly, and time consuming. However, the approach comes with multiple advantages, including enhanced communication, realistic assumptions, and well-aligned objectives (Pulmanis 2015). Stakeholder participation is considered a gold standard in the planning and execution of projects in the public sector.
One of the trends observed in the public sectors is the increasing relevance of public participation. Consequently, it becomes necessary for projects’ leaders to be able to identify the parties impacted by their decisions and able to participate in the project’s life cycle. These parties, defined as stakeholders in the academic literature, can have a significant influence on the progression and outcomes of the project (Kelbessa 2016). Therefore, in order to achieve a successful outcome, it is necessary for the project’s management to be able to identify and assess the expectations of stakeholders.
The recommended approach to the described process is a method known as stakeholder analysis. In its basic form, stakeholder analysis involves four stages. During the first stage, the stakeholders are identified. The most intuitive way of doing this is to map the people who are expected to be affected by the project’s outcomes. Once the main groups are identified and mapped, it is also recommended to categorize them based on their disposition as external and internal (Riege & Lindsay 2006). In the public sector, internal stakeholders are directly involved in the project’s life cycle whereas external ones contribute to the progression by providing feedback and offering experience relevant for achieving the set goals and objectives (Nica 2013).
During the second stage, each stakeholder or group of stakeholders is weighted in accordance with their relevance for and possible impact on the project. At this stage, it is important to acknowledge that the behaviour of stakeholders and respective effects on the project depends on a number of factors, including their relationship with the organization, the issue targeted by the project, and power available to them. The weight can be derived from two main factors: influence, or the capability to change the outcome, and importance, or the priority of a given stakeholder’s in the project’s hierarchy. Influence can be exerted directly (e.g. by using relevant knowledge or authority) and indirectly (e.g. through social or economic interactions) (Mergel 2013).
Once the weight of all stakeholders is determined, it is necessary to document the findings, preferably in quantifiable form. This is typically done using a simple matrix. By utilizing the factors identified in the previous stage as variables, it is possible to assign stakeholders to four distinct groups. After this, it becomes possible to manage relationships with stakeholders by applying unique sets of principles to each of the categories (Mergel 2013). This approach provides the necessary consistency of actions and allows for monitoring and adjustment of the project’s implementation.
The public sector encompasses central organizations and downstream institutions that work closely to develop and implement projects or programs (De Vries, Bekkers & Tummers 2014). The projects aim to promote economic growth and improve social welfare. The accomplishments of the public sector are seen in the quality of the services/goods provided (Jung 2013). Therefore, the development objectives of any public sector relate to funding infrastructure and supporting socioeconomic growth through industry-specific regulations and policies. Usually, the development of project goals and objectives takes into consideration social development priorities of a country at a given time (IFAC 2013). For example, a project to improve reading outcomes may have a set of objectives that measure relevant process and outcome variables. In the design stage, two kinds of objectives can be set to guide the project. They include process and outcome objectives.
The growing public dissatisfaction with the performance of the public sector in the recent years has created the need for a response that would provide improvements in organizational performance. The typical goals of such initiatives in the public sector are increased transparency and greater accountability of the organizations, reduced cost of operation, and greater capacity for quality improvement through change (Biygautane & Al-Yahya 2011). These initiatives are typically implemented in the form of projects – systematized programs that utilize a specific structure and comply with a set of universally accepted criteria (Hazel & Jacobson 2014). One of these criteria is the consistency of project’s structure, which can be achieved through the use of well-defined phases.
It is important to understand that in contrast to the continuous enterprise, a project is a finite phenomenon. The primary reason for this is a focus on a specific goal or set of goals that are intended to be achieved within a certain time frame. The academic literature frames this property as a life cycle of the project (Mir & Pinnington 2014). In the most basic form, a life cycle is viewed as comprised of four phases: initiation, planning, implementation, and closure (Bertók 2005). The initiation phase is where the project direction is being determined. At this stage, it is necessary to collect evidence confirming the existence of the issue and document its impact on the organizational performance (Mir & Pinnington 2014). Finally, the proposed solutions are reviewed for feasibility and relevance to the problem. The decision-making at this stage is limited to determining strategic direction and outlining the general approach.
The initiation phase is especially important for the public sector projects for two reasons. First, the projects undertaken in this domain are closely monitored by the controlling organizations due to transparency considerations. An appropriately organized initiation would greatly improve the perceived viability of the organization’s actions. Second, unlike for-profit companies, the public sector organizations often encounter funding restrictions (Kerzner 2017). From this standpoint, the phase in question outlines the expected budget of the project.
During the planning phase, the overarching goal is used to formulate objectives, and necessary actions are determined to meet each of them. After this, each set of actions is examined from the position of economic viability and consistency of tasks with the identified requirements. The outlined tasks, actions, milestones, and variables are then compiled into a document that is used as a primer throughout the project’s life cycle. The plan also contains details on the equipment and inventory necessary for project’s implementation, time frames of each distinct component, and roles and responsibilities of the stakeholders. In many cases, planning also includes identifying the probable barriers and risks associated with the project (Hwang & Ng 2013).
Finally, in the public sector, where accountability is a priority, the plan must also cover the issue of quality by specifying relevant indicators of success, tools for measuring performance, and identified milestones along with the planned achievements. With these components implemented, it will be possible for the project’s management to avoid the majority of difficulties and reach the intended outcomes (Hwang & Ng 2013). The majority of decision-making is made and documented at this stage. In public projects, it is important to clarify the outcomes in order to measure the progress over time. Outcome objectives are developed to support performance tracking. They are concise statements that define “who will make what change, by how much, where, and when” (Robinson 2015, p. 8).
During the third phase, the planned changes are implemented. As was mentioned above, in the public sector the progress of the project is closely monitored for consistency with the planned performance (OECD 2014). In addition to accountability, monitoring allows for the introduction of timely adjustments that address minor issues without disrupting the flow of the project. This phase will differ significantly depending on the type of organization. However, the most common approach would be to follow the plan compiled during the previous phase and, in case this is not possible, seek for and implement plausible alternatives. Thus, the decision-making is limited to deciding on the most appropriate response and the mode in which the adjustments can be made.
Finally, the fourth phase occurs once all of the identified objectives are met and the project is considered successful in reaching its overall goal. This conclusion should be backed by documentation containing the results of the evaluation, which is especially important for the public sector, where transparent reporting is one of the conditions (Rees-Caldwell & Pinnington 2013). Often, the closure phase also includes the analysis of the main advantages of the implemented project as well as barriers encountered in the process, ensuring its applicability in similar scenarios in the future.
The described framework was eventually expanded by dividing the implementation phase into launch and performance and control sub-phases. The reason for the change is the amount and diversity of tasks initiated at the starting point of implementation, such as tracking systems setup, resource assignment, and coordination of the effort, all of which can be allocated to the launch phase (OECD 2014). This approach allows for additional focus on identifying and addressing the deviations from the original plan.
Project life cycle and phases were initially intended for use by businesses and other for-profit organizations (Todorović et al. 2015). However, with the growing adoption of other organizational development methods has led to the concept’s application in the public sector. The universality and strategic scope of the phases allow for applying the framework to a wide range of organizations in the public sector and, as a result, significantly increasing projects’ performance (Todorović et al. 2015).
It is also necessary to mention that different phases pose unique restrictions to the projects’ management. The most apparent is the notable lack of planning in the public sectors of some governments. Specifically, the lack of strategic perspective and a clearly formulated plan is sometimes reported as a reason for budget overruns, ineffective risk mitigation and prevention policies, and failure to meet the deadline (Ofori 2013). Implementation phase, on the other hand, can be compromised by the lack of proper communication channels and the inability of the team to detect and address the setbacks in the plan.
The information above suggests the existence of a number of constraints characteristic for the projects. Depending on the scope and type of the project, they can be categorized using various degrees of specificity. However, the most common approach is to use the model referred to as “project management triangle.” According to the model, the quality of the final product depends on a combination of three factors, namely the cost, scope, and time of the project (Kerzner 2017). Importantly, the determinants are indirectly related, which means that the adjustment in one area invariably produces changes in other two domains. Therefore, the underperformance in one of the areas can be mitigated at the expense of performance in others, whenever the situation permits such an approach.
For instance, the compliance with a short deadline can be achieved by allocating more resources to certain tasks (thereby increasing costs) and eliminating the most lengthy and/or resource-demanding (thereby decreasing scope). Consequently, the increase in scope would require both a larger budget (i.e. increased costs) and longer implementation lifespan (i.e. increased time) (Kerzner 2017). The model is useful as an accessible tool for illustrating the interconnection between the constraints of the project, estimating the areas impacted by the planned adjustments and changes, and communicating the outcomes to the stakeholders.
Other models exist that offer a more detailed disaggregation of project-related constraints. For instance, the cost category can be further disaggregated as consisting of aspects of human resources, equipment, facilities, and infrastructure (Kerzner 2017). In the same manner, the scope-related constraints may include organizational issues, methodological flaws, and legal restrictions.
As can be derived from the information above, each phase of the projects’ life cycle has the capacity for the improvement of their results. Therefore, the improvements in question usually aim at increased effectiveness and efficiency of the projects. However, despite the intuitive nature of the concepts, both are rarely defined in the academic literature on project management. Thus, in order to proceed, it is first necessary to provide the definitions of effectiveness and efficiency relevant to project management in the public sector.
In the most basic terms, effectiveness is the capacity to fulfil a certain task (Sundqvist, Backlund & Chronéer 2014). Efficiency, on the other hand, is the capability to organize the procedure in a way that eliminates as many barriers as possible and ensures the best results at the expense of the least time and effort invested in it (Sundqvist, Backlund & Chronéer 2014). In other words, effectiveness is the ability to produce the results whereas efficiency is the ability to arrive at the concluding phase without the unnecessary waste of resources and efforts. By extension, it is possible to assert that the former can be measured by comparing the results to the milestones laid out in the project’s plan whereas the latter is assessed by identifying the gaps and inconsistencies in the process and identifying their causes (e.g. insufficient funding or misapplication of human resources).
However, it should be understood that these definitions are rarely explicitly formulated in the public sector-related projects (Kaufmann, Kraay & Mastruzzi 2011). In most cases, the terms are used in a self-explanatory manner. In some instances, this approach can be justified by the lack of apparent need to introduce a robust definition – for instance, the projects that utilize specific measurable parameters as determinants of success may only use the concepts of efficiency to outline the overarching goal (Hazel & Jacobson 2014). However, in the situations where these concepts are used as chief determinants of performance, such vagueness can be considered detrimental to the transparency of the process.
At this point, it is necessary to accept the fact that the field of project management covers a wide variety of activities and processes. Since both effectiveness and efficiency are usually attributed to specific processes and utilize different metrics based on their characteristics, it becomes clear that at least on some occasions the concepts will attain different sets of characteristics. According to the study by Sundqvist, Backlund and Chronéer (2014), the characteristics attributed to both effectiveness and efficiency vary significantly across the segment. The most common aspects are the ability to satisfy or exceed customer expectations, the compliance with certain internal requirements, such as cost, timeframe, and resource utilization, and elimination of deficiencies.
As can be seen, some of the proposed aspects align with the criteria posed by specific industry standards for quality. It is possible to view the requirements as goals, which allows incorporating the standard definition of effectiveness into the measurements. Understandably, such an approach would only be possible in the projects that deal with variables that are consistent with the requirements of respective standards. The main advantage of such an approach would be the possibility of select the reliable tools and apply guidelines, recommendations, and expertise from related fields.
For the projects that are incompatible with the described approach, project managers often introduce their interpretation of the term. The definitions mainly depend on the priorities of the project, previous experience of the management, and personal perceptions of the stakeholders. For instance, some projects may prioritize adequate allocation of resources as a determinant of performance, thus characterizing effectiveness as the capacity to maximize the returns on the invested resources (Liu, Wang & Wilkinson 2016).
Finally, it is necessary to acknowledge that the views on effectiveness and efficiency are expected to differ depending on the hierarchical structure of the organization. Specifically, the top management segment is more likely to adopt the strategic viewpoint and thus consider the accomplishment of the ultimate goal the main determinant of effectiveness whereas individual team leaders will be more focused on short-term objectives (Ibrahim 2015). Notably, both approaches are consistent with the definitions of effectiveness provided above. Nevertheless, it is clear that such disparity within a single project may lead to confusion and, in certain situations, compromise trust in the project.
For reasons specified above, an assessment of the effectiveness and efficiency of the projects in the public sector is complicated by a number of factors. In the absence of a universal framework, the main source of data is the case studies published in academic journals. According to the study by Pūlmanis (2014), the growing popularity of project management tools and techniques in the public sector harbours significant potential for improvement. At the same time, the discrepancies between the perceptions of project managers and the results of the self-assessment of the process suggest the insufficient level of maturity of the organization. It is also important to understand that the assessment was conducted on an ongoing project and, as a result, accounted only for the observable and measureable performance (Pūlmanis 2014). In other words, it is more consistent with the accepted definition of efficiency, whereas the authors use the terms “efficient” and “effective” interchangeably, compromising the validity of findings.
The same approach was used in the study of the effectiveness and efficiency of Australian and Chinese projects. The research team relied on factors related to the tendering processes, thus downplaying the relevance of meeting the set goals (Liu, Wang & Wilkinson 2016). In other words, the team prioritized efficiency despite the claims made in the methodology. The described tendency is observed in the majority of the projects conducted in the public sector. The results of the analysis indicate that an increase in effectiveness is included in the list of goals of 18% of the studied articles, followed by increased efficiency at 15% (De Vries, Bekkers & Tummers 2016). However, the most numerous group (35%) does not present a clearly formulated goal. In addition, many of the papers provide vague and inconsistent definitions of the concepts that are only generally attributable to the definitions above.
Efficacy Indicators
The efficacy of a multi-stage public project is determined by its efficiency, effectiveness, and sustainability. Efficacy indicators demonstrate “how well the results at one level of a project” have been translated into outcomes in the subsequent level (World Bank 2013, p. 14). They measure three aspects of a project: “the efficiency of inputs, effectiveness of outputs, and sustainability of the project impact” (World Bank 2013, p. 14). Thus, it can be argued that efficacy indicators highlight the capacity of a project to meet the set objectives. The logical framework often utilises efficacy indicators alongside results indicators to measure a project’s impact (Jos & Faith-ell 2012). For most projects, the monitoring of project performance ends with impact indicators. However, efficacy indicators can be utilised to track performance in projects where efficiency, effectiveness, or sustainability is a project goal for the institution.
Therefore, organisations can choose to use indicators of efficiency, effectiveness, or sustainability based on the nature of the project. Efficiency indicators capture the proportion of inputs of a project per a unit of outputs generated (World Bank 2013). An example may be the amount of funds or labour needed per unit output. Efficiency indicators are useful in public financial auditing – for measuring the appropriate use of resources/funds for the activities intended in line with accountability requirements (Jos & Faith-ell 2012). In contrast, effectiveness indicators measure the “ratio of outputs per a unit of a project outcome or impact” (World Bank 2013, p. 15).
Thus, they measure the extent to which the project outputs influence the outcomes/impacts. An example is the number of immunisations given per a unit decrease in disease morbidity or mortality in the target population. Sustainability indicators capture the continuity of the project’s positive outcomes over time (World Bank 2013). Thus, they measure the degree to which the project will remain viable over time, especially after funding stops. They indicate whether the benefits will continue being felt after the project ends.
The management of results and output of project activities is essential in tracking project progress. It encompasses systematic collection and analysis of data to determine the efficiency and effectiveness of a programme or project in generating the intended results (OECD 2013a). Results measurement also highlights the improvements necessary to achieve better performance – outputs, outcomes, and impacts. The concept is widely used in management literature and is related to the idea of ‘management by objectives’, which has informed public sector reforms since the 1990s in OECD countries. The approach goes beyond the monitoring project resources and activities to include the measurement of the output of the project, i.e., the results. In this context, results are defined as the “output, outcome, or impact –intended or unintended, positive or negative – of a development activity or project” (OECD 2013a, p. 16).
In measuring results, public entities gather and analyse data to determine how well a project/programme is doing relative to the anticipated goals. A survey conducted in 2013 established that over two thirds of OECD countries have created a special unit/department charged with project results measurement and maintenance (OECD 2013b). Besides results management, the special units coordinate quality and planning of the project being implemented. In most projects, results measurement focuses either on deliverables, including short-term outputs, i.e., direct services or goods or on the long-term impacts/changes related to the project outputs.
Results measurement often involves a system that collects data related to the progress of the project. It entails the identification and formulation, in measurable terms, the anticipated results/impacts, in light of the prevailing socioeconomic, environmental, and political realities that influence their achievement. It begins with the formulation of a results chain that establishes the cause-and-effect relationships between resources and activities, culminating in the expected result (OECD 2013a). Additionally, two systems – one for tracking performance and another for explicating the improvements – are developed to complement the results chain. In measuring results, baselines are first obtained to give a picture of the state of affairs before the project is implemented. The baseline data are integrated with the objectives and selected result indicators to enable governments to determine if performance is on course and the contributing factors. The results derived this way can be analysed with a results model to support public reporting.
An example of a results model is the four-tier framework established by the UK Department for International Development (DFID). The framework helps track and manage the progress of “development results at corporate level, as well as to publicly report on delivery” (DFID 2013, p. 11). Level one of this framework measures the progress made on specific outcome indicators that involve a collective action of the DFID and particular nations. Level two centres on the results, which include indicators assessing outputs attributable to DFID-sponsored projects, while level three covers operational effectiveness of the programme. Improvements at level three can translate into “better delivery of results and greater value for money” (DFID 2013). Level four is concerned with the measurement of organisational effectiveness. The indicators used in this level measure the efficiency of the corporate processes to help bolster effectiveness in delivering the results (DFID 2013).
The four-tier model is comparable to other result systems adopted for public projects. The four-level model determines data collection and measurement techniques used by governments or development partners. Level one indicators are derived from global measurement systems. They are pegged on millennium development goals that act as the point of reference for public projects globally. In contrast, level two indicators are developed from institutional strategies, while the data are drawn from national measurement systems (OECD 2013a). Level three and four indicators relate to the organisational systems. Some OECD countries have developed simpler results frameworks with a maximum of two levels to give extra weight to country-level results (OECD 2013a). In such models, the first level usually covers the output of different projects, while the second level measures the impact/outcome of each specific project.
The primary goal of building a results framework is to “collate and analyse” key data/information for effective project management (OECD 2013b, p. 6). It allows government agencies to monitor the progress made towards achieving specific results of a project, as indicated by the objectives. The development of results frameworks is a collaborative process that brings together government agencies and civil society organisations (OECD 2013b). The first step of this process involves the selection of a few strategic outcomes related to each project. Subsequently, each outcome is monitored through a set of KPIs – a maximum of three KPIs per outcome (OECD 2013b). A joint evaluation of the results by the various actors is done before compiling a results statement. The statements usually report quantitative and qualitative data related to the project results and provide a basis for improvements in the next project phase. Therefore, up to three KPIs should be selected per result, i.e., each for qualitative, quantitative, and survey data.
The selection of KPIs is an important process in the accurate measurement of the outputs/results of a project. The right measurements/indicators can help populate the results framework with accurate data. As stated, indicators – whether quantitative or qualitative – either support the measurement of achievement or changes attributable to the project or gauge its progress. Thus, they define specific aspects of a project based on a scale, highlighting the type of data to be gathered to measure output. In other words, they measure how a project is performing against the baseline data. Consistency in the use of appropriate indicators is required throughout the results chain. Various criteria have been developed to help public entities and officials select good indicators. The common ones used by government agencies across the globe include the “SMART (specific, measurable, achievable, relevant, and time-bound) and RACER (relevant, acceptable, credible, easy, and robust)” (World Bank 2013, p. 24).
National guidelines on how to choose good indicators also exist. In Canada, the government developed a results chain to help public entities develop good indicators and measurements for projects. The results chain begins with the input and ends with the outcomes, which fall into three categories: immediate, intermediate, and ultimate outcomes (DFATD 2013). In the results chain, input indicators measure the investments that have gone into a public project, including money, equipment, staff, technology, and time. The results chain also captures the planned activities related to the project. The activities may include infrastructure development or refurbishment, policy guidance, staff training, workshops, and assessments (DFATD 2013). The outputs indicators measure the products/services stemming from the project activities. They may include the number of staff trained, workshops facilitated, infrastructure built, or policy initiatives supported by the project.
The impacts or outcomes of the outputs are measured at three levels: immediate, intermediate, and ultimate outcomes. The immediate outcomes indicators measure the change in capacities of the beneficiaries in terms of knowledge, skills, attitudes, processes, and motivations (DFATD 2013). In contrast, the intermediate outcomes indicators measure the behaviour changes in the target group in terms of decision-making efficiency and effectiveness and social action practices. The ultimate outcome indicators evaluate the change in status or wellbeing of the beneficiaries of the project. They may include indicators of social, economic, or environmental wellbeing.
The results chain given is an example of how outputs and outcomes are measured during the project. It involves quantitative and qualitative indicators that measure the most relevant aspects of a project. However, technical difficulties related to results measurement forces some public entities to select indicators that monitor quantifiable effects, i.e., outputs that are “easy to achieve and measure” (Danida 2011, p. 12). The problem with the use of quantitative results indicators alone is that they do not give adequate measurement of progress towards the desired change in the long-term. Therefore, complexity-aware indicators that involve feedback loops and qualitative data are recommended (USAID 2013a). Examples include sentinel indicators, and process monitoring, and stakeholder feedback – to obtain the perspective of the beneficiaries.
The results measurement systems should be simple and clear. When choosing indicators, it is important to consider the interests and needs of the stakeholders and the objectives of the public project (APEC 2011). Complex indicators can limit the capacity to measure and attribute the results to a public sector project. Therefore, selecting simple indicators can help capture the project results and support management goals. To achieve this, public entities adopt a strategic approach when selecting indicators. They involve technical experts and consider project priorities and budget constraints to choose the right indicators (USAID 2013a).
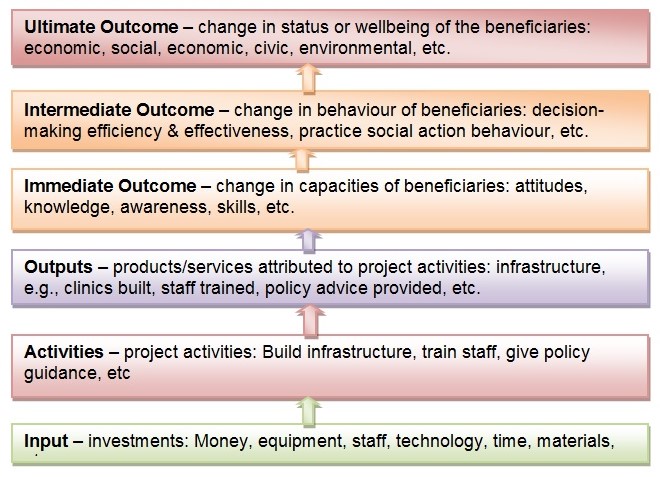
Risk-Taking and Decision-Making in Projects
According to the information presented above, risk management one of the chief concerns of projects. The main reason for such a situation is strong emphasis on innovation (Potts 2009). Currently, innovation is viewed as the most feasible means of increasing effectiveness and efficiency of the institutions in the public sector. In response, organizations from different countries have initiated the process of adopting innovative technologies and policies. However, the pursuit of innovation introduces a certain amount of risk into the project. It should be understood that the situation observed in the public sector is different from that in its private counterpart, from which the concept was adopted. Specifically, the projects in the public sector are known to be inherently less flexible, poorly structured, and prone to design inefficiencies (Page et al. 2015). In addition, the projects in the public sector are more susceptible to political pressures, which have a detrimental effect on the process (Potts 2009).
Finally, it should be acknowledged that the growing demand for innovation creates additional pressure on the project managers and, as a result, requires certain capacity for risk-taking. Unlike the private sector, where risk management is already driven by an established set of practices, in the public sector risk is traditionally managed through avoidance (Holub, Marshall & Hood 2014). It has been suggested that this approach occurs due to a lack of risk diversification by the organizations. It is also important to acknowledge that for the organization in the private sector, it is possible to underperform in several areas and still achieve a positive result by excelling in one aspect. Such net success is rarely available for the public sector projects, in which achievements in some aspects do not necessarily cover gaps from the failed ones (Kaufmann, Kraay & Mastruzzi 2011).
Evidently, the restrictive conditions described above impact the decision-making of project managers. The issue is further complicated by the introduction of uncertainty. According to the definition, risk complicates the decision-making process via the introduction of known adverse outcomes, whereas uncertainty provides no known outcomes or options as a basis for decisions (Rausand 2013). This issue is only partially acknowledged by the government institutions, which recognize the existence of risk as an inevitable component of innovation but relatively rarely provide guidance for projects willing to undertake it (Bhatta 2003).
In most cases, the documents dealing with the question provide a generalized statement on the significance of innovation in achieving excellence of service, maintaining the desired level of quality, reducing workload, and otherwise beneficial for the project’s outcome (Osborne & Brown 2011). At the same time, no information is offered on the methods of dealing with associated risks, and, in the extreme cases, risks are unspecified or excluded from the text (Braig, Gebre & Sellgren 2011). Some sources go as far as suggesting that risk management is a redundant process that requires considerable funding while providing a negligible positive effect (Osborne & Brown 2011). Understandably, such an attitude impairs project managers’ decision-making and reduces risk-taking to aversion and occasional unsystematic mitigation (Bhatta 2008).
As was mentioned above, project planning includes the acknowledgment of risks and development of strategies intended to prevent or mitigate them. The depth level of this aspect of project management differs depending on the scope of the project and the perceived influence of the occurrence of risks on its performance. One of the most feasible solutions is the use of a universally accepted framework that streamlines and systematizes the process. The framework typically includes three stages – identification, evaluation, and mitigation (Deloitte 2015). During the first stage, the potential sources of risk are identified and evaluated for likely of occurrence. The most common sources of knowledge are previous experience with similar projects and data obtained from academic publications (Hazel & Jacobson 2014). Usually, the list is then systematized by assigning categories to the identified risks. Finally, it is possible to further disaggregate the list by utilizing a risk breakdown structure. This approach is useful for visualizing the areas of concentration and, as a result, allocating the resources more appropriately.
During the evaluation phase, the risks are weighted in accordance with their impact on the project. Depending on the expected precision of the project, the likelihood of risk occurrence determined during its identification can be quantified, allowing for a more systematic assignment of priorities. The literature on risk management offers a number of functional tools that can simplify the process, such as impact-likelihood matrices (Kelbessa 2016). However, the projects in public sector rarely make use of these instruments, relying instead on intuitive judgements. The likely reason for this is the lack of familiarity with the instruments and the failure to recognize benefits associated with their use (Jałocha et al. 2014). In addition, the requirements of the evaluation process are rarely formalized, which allows ignoring the procedure or substituting it with informal alternative. Finally, risk aversion is responsible for at least some of these instances.
At the third stage, the findings of the evaluation are used to create a risk mitigation plan. A typical risk mitigation plan contains a combination of strategies addressing the risks based on their likelihood and severity. The mitigation is possible through risk avoidance (implementation of strategies intended to minimize the likelihood of risk), risk sharing (partnering with organizations that can partially address the concerns), risk reduction (direct allocation of funds intended to address specific areas of concern), and risk transfer (relocation of responsibilities to a third party) (Kelbessa 2016). As can be seen, each of the identified strategies requires a certain amount of resources and effort. The availability of the mitigation plan thus provides the opportunity to compare the costs of different strategies and decide on the optimal strategy.
It is also possible that some of the identified risks are perceived as a threat to the project’s success. In this case, an alternative is developed that allows for a favourable outcome despite the occurrence of risk. This alternative, known as a contingency plan, is usually a suboptimal solution in terms of costs and thus requires the creation of a contingency fund reserved for its launch.
As can be seen from the information above, the main bulk of risk management activities are allocated to the planning phase. At this stage, it is possible to gain access to the project’s parameters that may be necessary for creating viable risk mitigation strategies. In addition, at this stage, it is possible to incorporate the contingency plan into the project’s plan to avoid inconsistencies. Finally, the budget required for the creation of a contingency fund may only be available for allocation at this stage (Deloitte 2015). It is also possible to encounter the necessity to initiate a risk mitigation strategy at the implementation stage. In the most severe cases, the encounter of a major risk may trigger a switch to a contingency plan, which will also occur at this phase. However, it should be understood that an appropriate risk mitigation plan requires intervention only in the severe instances, whereas in most cases the flow of the project remains uninterrupted.
Risk Indicators
Risk and sensitivity analyses of a project give estimates of the effect of attaining project objectives on condition that particular assumptions are not met (World Bank 2013). They provide a picture of the effect of changes to exogenous factors on project variables using the what-if scenarios. Therefore, a risk indicator evaluates the impact of external factors (risks) related to the macroeconomic dimension of the project. The exogenous factors include those variables identified as having a direct impact on the project outcome. For instance, energy prices or wages for the project team impact on the project outcome directly. The realisation of a project’s objectives is contingent upon the existence of a means-effects relationship of the logical framework components and minimal risks.
Project Oversight and Audit
In order to maintain the necessary level of integrity, projects can be subject to control at certain stages of their life cycle. Depending on the character of the project, the control in question can be performed internally or independently by a trusted party. The internal control, commonly referred to as internal audit, is a process aimed at providing assurance of the project’s characteristics, such as effectiveness and efficiency, compliance with regulations, and reliability of reporting, among others (Piper 2015). Internal audit is performed through various means, including monitoring, oversight policies and procedures, identification of inconsistencies via communication with respective parties, and establishment of a control environment (IFAC 2013).
Depending on the type of data gathered, controlling processes and activities may include supervision of operations, retention of records, installation of physical safety measures (e.g. locks, surveillance cameras), use of security software, and various authorisation mechanisms (Cole, Eppert & Kinzelbach 2008). It is important to understand that internal control does not focus on the financial aspect of the projects and examines all relevant aspects and activities in its life cycle. Depending on the project’s scope, the audit can be applied to specific components or to the project as a whole.
In the broadest sense, all participants of projects in public sector are responsible for the audit process. However, the main bulk of activities are concentrated within two groups. The first one is top management, which is responsible for integrating an activity into the project’s plan. In addition, project managers establish the necessary environment that promotes accountability and transparency and improves efficiency of the activities (OECD 2007). The second group is internal auditors – individuals tasked to gather, analyse, and report data on the project’s efficiency. Auditors are also responsible for maintaining the overall effectiveness of the oversight system. Other common areas of assessment include monitoring of the project’s control environment (e.g. identification and elimination of gaps), evaluation of risk mitigation and contingency plans, evaluation of the intra-organizational communication systems, and supervision of the audit’s feasibility (Nalewaik & Mills 2014).
Internal audit is organized in accordance with one of two models. The first option, known as centralized audit, is conducted by a single dedicated organization either by delegating tasks to project’s members or by placing the organization’s representatives within the project (Prabhakar 2009). In the second category, referred to as decentralized audit, the external organization develops standards of the control process, which are then used by project’s management to create an internal unit responsible for measuring compliance with these standards (Potts & Kastelle 2010). As can be seen, the second category delegates some of the responsibility to the individual projects. The standards used for the purpose of decentralized audit include performance standards, which provide quality criteria for the typical processes in public sector projects and attribute standards, which determine characteristics of control entities in question.
As can be seen, the decentralized approach offers greater flexibility and independence from external authorities. Nevertheless, it remains relatively uncommon in the public sector, mostly due to firmly established hierarchy and well-defined layers of control (OECD 2014). However, several countries, such as Canada, the United Kingdom, and the United States are already undergoing an adoption of the decentralized practices.
In order to conduct a reliable audit, it is necessary to collect relevant and accurate data. The easiest option is the assessment of progress in terms of meeting the set objectives. A more elaborate approach involves the use of tools producing quantifiable data, such as key performance indicators (KPIs). A KPI is a systematized list of indicators that represent vital elements of the project’s performance (Kerzner 2017). Due to their popularity in the financial sector, KPIs are used primarily for financial performance measurement. However, it is equally plausible to use them for the assessment of non-financial outcomes (Kerzner 2017). In the public sector, key indicators may include compliance reviews, staff retention rates, volume and quality of information published in the reporting process, and a number of known unaddressed issues.
Summary
As can be seen from the literature review, the academic sources cover project establishment in sufficient detail. However, certain important elements, such as a universal definition of efficiency and effectiveness, are scarce. While effectiveness and efficiency are recognizable concepts that are already routinely applied to many projects in public sector, the majority of managers demonstrate insufficient understanding of the definitions and determinants of the concepts. Thus, it is reasonable to expect a wide variety of results that are not necessarily compatible with each other. Another probable outcome is the lack of consistency in the selected approaches and demonstrated results.
Next, it is apparent that at least some of the strategies and tools used in the private industries are applicable to the public sector with only minor adjustments. Some aspects of project management, such as increased attention to transparency and accountability, require additional attention in the project development process.
Finally, a range of issues and barriers can be identified pertinent to risk management of public sector projects. Specifically, despite the availability of tools and techniques adopted from other domains of project management, risks in the public sector are rarely managed consistently.
Conceptual Framework
Introduction
Risk governance is a critical management best practice in all projects. It encompasses a transparent and systematic engagement with identified risks through appropriate responses (Brown & Osborne 2013). This process primarily comprises of risk identification, analysis, assessment, and management that inform risk-based decisions that reflect the organisation’s objectives. Therefore, risk governance is a vital control activity that has strong links with the audit function of a firm (Hudin & Hamid 2014).
From the literature review, the adoption of risk governance practices in organisational contexts is shown to be dependent on a range of internal factors. These variables constitute the determinants of success in realising project objectives. Further, multitudes of different risk management techniques, practices, criteria, frameworks, and organisational characteristics that influence project outcomes have been noted in literature. The approach an organisation uses to identify, assess, monitor, and control risks inherent in its industry depends on its characteristics, e.g., strategy, risk appraisal and insight, risk communication, appetite, etc.
Therefore, the conceptualisation of the influence of risk governance on project outcomes must involve the institutional variables – internal factors – that determine risk management practices of a firm. The reasons for adopting a risk governance approach should relate to the determinants of project success and the occurrence of adverse events. On the other hand, the internal audit function helps moderate the impact of these drivers on project outcomes. As Shad and Lai (2015) state, internal controls reflect an organisation’s characteristics, including its technological infrastructure, organisational structure, and size. The proposed conceptual framework incorporates ten determinants of risk governance practices in organisations (as gleaned from literature) and links them to project outcomes.
This research explores strategy, risk appraisal and insight, risk decision and process implementation, risk management and governance, review of risk development and decisions, risk communication, risk culture, financial and technical capacity, risk appetite, and ownership, which are the determinants of project success or occurrence of negative events mediated by the internal audit function, as shown in Figure 5.1. The dimensions of the conceptual framework are discussed below along with the hypotheses formulated.
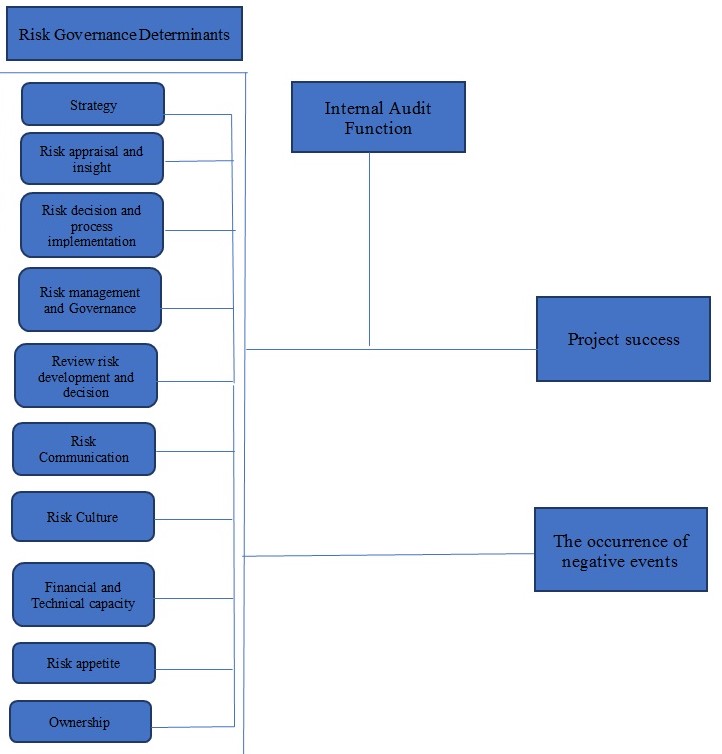
Relative Importance of the Determinants of Risk Governance
The ten factors above collectively contribute to project success. Optimal risk management that maximises on these determinants is required to mitigate risks that impact project objectives and outcomes. Therefore, although risk governance is an integrated process, each variable contributes differently to the overall success of a project or occurrence of negative events. The rating of the variables considers their relative contributions to the risk governance process. From literature, ‘risk strategy’ is a fundamental determinant of risk appetite, which must be aligned with the operational or project objectives of a firm (Beckers et al., 2013). The second factor – risk appraisal and insight – is critical in generating a catalogue of risks that an organisation is exposed to and attendant opportunities. It yields risk categories, types, likelihood, impact, and quantitative assessments that inform risk-based decisions.
Risk decision and process implementation imply risk-informed decision-making that entails identifying strategic alternatives, analysing them, making a well-reasoned selection (Aven 2016). Organisations must establish the foundation for risk-based business decisions and mechanisms and procedures for maximising opportunities that come from the exposure to risk. Risk management and governance constitute a formal function that regulates the risk-taking practices of a firm to ensure that they reflect its culture and monitors or manages enterprise-wide risks to reduce exposure and maximise value (Ellul 2015).
The review of risk development and decisions is another crucial determinant that contributes to project success or adverse incidents. It ensures continual improvement of the risk management process through progress monitoring and risk reviews (Aven 2016). Active risk communication is also required within an organisation to improve staff awareness and engender risk-based behaviour and practices. Risk culture, i.e., the prevalent attitudes and beliefs about uncertainties, is a crucial determinant of how managers and employees view and respond to risks. Thus, risk decisions would depend on the system of common values and understanding of organisational objectives.
Another factor considered is the financial and technical capacity of a firm to manage project risks. Comprehensive risk governance requires management capacity to identify, assess, monitor, and handle business threats. Financial resources are needed to conduct a risk assessment and execute mitigation strategies. Furthermore, the technical expertise to implement controls and audit the risk management system is critical. Staff skills in risk governance can be improved through adequate training and preparation.
The other determinant is risk appetite, which describes the overall risk level and types the firm is willing to assume in order to realise its strategic objectives (Polk 2014). Regular adjustment of the maximum allowable risks is important due to changing market conditions and organisational capacities. Risk ownership is another critical predictor of project outcomes. Typically, the individual interacting daily with risks, e.g., line managers, as well as the board have the ultimate responsibility to handle business threats. It is clear that the relative contribution of each of the ten determinants of risk governance is not the same. Therefore, the hypothesis posited is as follows:
H1: There is no significant difference in rating the importance of the determinants of risk governance.
Project Success
Risk management increases the likelihood of a project being successful. According to Pinto (2014), risk governance as a critical success factor includes structures and procedures used in resource allocation, coordination, and control of each activity throughout the project lifecycle in order to realise organisational objectives. This core element of the broader corporate governance framework is also a good indicator of management performance. The focus of this study is to examine the link between risk governance determinants and project success. Therefore, the ten factors can be conceptualised as indicators of causality. Serra and Kunc (2014) establish that strategy planning correlates with implementation, which implies that governance is a success factor in projects. The significance of risk management in organisations has been shown in previous studies.
Joslin and Muller (2015) found that governance does not play a mediatory role in project success; rather, it is a causal factor. Thus, it can be concluded that organisational characteristics predict risk behaviour that in turn influence project outcomes. By extension, risk governance precedes project success (determined at the end), which makes it the cause. Firms establish management structures and mechanisms for risk appetite determination, risk-informed decision-making, risk communication, and appraisal and insight, among other determinants, before initiating projects, which means that success is an outcome of good risk governance – an independent variable.
The criteria for determining project success measure the outcomes at the end of the undertaking. The principal dimensions used may include “project efficiency, organisational benefits, impacts, stakeholder satisfaction, and future potential” (Joslin & Muller 2015, p. 615). Project-related governance is an oversight role that includes a range of actions and practices to realise specific objectives. Optimisation of the risk management process, therefore, would increase the chances of project success. Weaker governance structures are associated with poor business performance (Too & Weaver 2014). The flipside of this assertion is that sound management in organisations engenders higher productivity and outcomes. Therefore, risk management, which is a core element of the corporate governance framework, is an antecedent variable in project success.
The risk governance determinants precede project initiation. To achieve success, an organisation has to formulate a risk strategy, strengthen its risk appraisal, insight, and review, establish risk-informed decision-making, define its risk appetite and ownership, enhance risk communication, and increase its financial and technical capacity before a project is selected. These risk governance determinants are independent of the nature, magnitude, or risk levels of a project (Muller & Lecoeuvre 2014). The primary aim of risk management is to avoid or mitigate events that could impact negatively on a firm’s performance, profitability, or output. The success of organisations is dependent on the control structures dedicated to identify and manage relevant risks (Muller & Lecoeuvre 2014). The practical implication of this statement is that risk governance determinants increase the chances of a project being successful. Thus, the following hypothesis posited:
H2: Determinants of risk governance are positively related to project success.
The occurrence of Negative Events
The realisation of project objectives may be impeded by adverse events occurring during implementation. Factors ranging from delays in delivery to cost overrun can impact project goals. The response strategy for negative threats may include avoiding, transferring, or mitigating the risk situation (Hajikazemi et al. 2016). The aim is to control their effects and potential project failure. Project risk governance requires robust management procedures in the identification, assessment, analysis, and mitigation of ‘black swan’ events occurring during the design and implementation stages (Hajikazemi et al. 2016). Factors such as delivery deadlines and cost limits are critical constraints in projects. Risk governance procedures ensure that the project progress is within budget and on time in line with the objectives. Projects challenged by threats usually overrun costs and deadlines and lack the attributes specified at the design stage.
Adverse events typically result from poor management continuity, higher expectations, and misalignment between project goals and organisational objectives (Dodson & Westney 2014). They have two primary characteristics: exist as outliers (unlikely occurrences) and have a significant effect on projects. Although they are unpredictable, organisations can manage negative events by being robust and dynamic to withstand these challenges. Kenett (2013) suggests that organisations should be prepared to predict and mount appropriate responses to potential occurrences that may affect projects negatively. Early identification of indicators of negative events and their likelihood of happening can help avoid or mitigate their impact. Within a project management context, determinants of risk governance, such as risk strategy and appraisal and insight, are critical in preventing ‘black swan’ events and their effect.
Another approach for controlling these occurrences includes risk communication. Werther (2013) suggests that facilitating a “flow of independent and transparent information” would enable the project manager and stakeholders to avoid challenges that may lead to failure (p. 8). However, the risk management team must understand that risk analysis tools may not give a reliable forecast of negative events. Therefore, lessons learned from earlier exposure to such occurrences can help strengthen risk management procedures. Mainstream risk governance models can enhance an organisation’s ability to predict and respond to rare events. The emergence of negative incidents in projects indicates an absence of “processes and governance to identify strategic risks” (Dodson & Westney 2014, para. 4 ).
In this regard, measures that enable the project team to recognise and manage events that threaten project objectives are critical. Examples include risk framing (likelihood and effect), strategies for avoidance or mitigation, assessment through probabilistic determination of budgets and timelines, allocation or insurance, and validation via monitoring and regular reviews of the risk frames (Dodson & Westney 2014). These approaches reflect the determinants of risk governance that are included in the conceptual framework.
Firms implementing large projects must test their capacity to withstand the effects of negative events, including cost overruns and lower benefits than those projected at the design stage. Project managers must also take measures to prevent the occurrence of black swans. Such steps may include dividing complex projects into smaller sizes in terms of cost and duration (Kenett 2013). Further, contingency planning can help handle certain risks, while data-driven risk governance can ensure better decisions and effective responses. Other strategies may include strengthening R&D efforts and risk communication in the organisation (Kenett 2013). From the approaches discussed above, it is clear that negative events can be managed through effective prediction or by controlling their impact via risk governance processes and procedures. Therefore, organisations that use these strategies experience fewer negative events than those that do not. Based on this conclusion, the following hypothesis is posited:
H3: Determinants of risk governance are negatively related to the occurrence of negative events in projects.
Internal Audit Function
Internal auditing is a critical component of effective risk governance along with risk management mechanism. It entails a neutral and objective assurance on risk control processes of an organisation (Florea & Florea 2016). This definition indicates that auditing extends to risk assessment and governance issues in the firm. Therefore, the audit function is a form of internal controls meant to support the management and ensure compliance with organisational processes (Florea & Florea 2016). It encompasses the measurement, analysis, and evaluation of the efficacy and efficiency of the other controls, including risk management techniques. The aim is to minimise costs, maximise benefits, and enhance capacity, which would contribute to project success.
The significance of auditing to projects is grounded in three principles. The first pillar is corporate governance, which includes the organisation’s “culture, policies, strategies, and relationship with stakeholders” (Australian National Audit Office [ANAO] 2014, p. 4). It entails transparency and accountability in making decisions. The internal audit function supports governance structures by promoting efficiency in the control and management of institutions (ANAO 2014). The second one is internal controls, i.e., mechanisms that enhance accountability in the organisation. They involve inbuilt procedures for budget preparation, accounting and reporting, and resource administration. They are the controls implemented in the financial management system to ensure allocation efficiency and effectiveness (Reding et al. 2013). Internal auditing is a critical function in corporate governance as the audit committee reports directly to the board and gives suggestions on how to improve the control system.
The last principle is risk management, which lies at the heart of organisational strategy. As aforementioned, risk constitutes an event that impedes the realisation of project objectives, and for this reason, it must be managed. Risk management includes measures that a firm takes to identify, assess, and manage risks or capitalise on opportunities (ANAO 2014). The internal audit function supports risk governance by suggesting the critical controls needed to manage identified risks and estimating the potential tradeoffs related to specific threats. In the public sector, the internal audit’s functions of assurance, participation, and consultancy enable institutions to improve their operations and achieve accountability (Florea & Florea 2016). In projects, auditing plays different roles. The assurance functions include milestone reviews, pre-implementation and post-implementation evaluations, assessment of product quality (deliverables), and providing advice on the efficiency of the internal controls (Huibers 2013). In this regard, internal auditing supports risk governance processes to realise the objectives of the project.
The second role is consultancy, which encompasses advice to the project management team and stakeholders. Internal auditors give recommendations on the risk assessment methodology, and thus, act as advisors to the board and risk officers. They also provide objective views on how to design the control framework, develop project milestones, and manage change (Huibers 2013). Another important consultancy role is developing a training program to enhance risk awareness and culture (Reding et al. 2013).
The participative functions of internal auditing include proactive involvement in internal control matters, provision of alternatives, project coordination, and facilitation of quality assurance, among others (Huibers 2013). The auditors also identify risks emerging from the use of a new system and suggest ways to manage change. From this analysis, it is clear that the internal audit function supplements risk governance through assurance, consultative, and participative roles. It can be viewed as a moderating variable that explains the causal relationship between the determinants of risk governance (independent variables) and project success (dependent variable). Therefore, the following hypothesis is posited:
H4: The relationship between the determinants of risk governance and project success are moderated by the internal audit function.
Summary
Risk governance has become a critical success factor in organisations. Through an in-depth review of literature, ten determinants that affect project outcomes and objectives are identified. In the proposed conceptual framework (Figure 5.1), these variables influence project success and occurrence of negative events. They include strategy, risk appraisal and insight, risk decision and process implementation, risk management and governance, review of risk development and decisions, risk communication, risk culture, financial and technical capacity, risk appetite, and ownership.
From literature, each of these variables contributes to the success of projects, as an antecedent to outcomes, not as intervening factor (Joslin & Muller 2015). This study suggests that the relative contribution of each determinant is not significant. It is also hypothesised that risk management has a positive correlation with project success. Governance structures and procedures for controlling risks can help the organisation realise project objectives (Pinto 2014). The occurrence of unpredictable, black swan incidents is characteristic of weaker risk governance systems.
Therefore, a negative correlation is suggested between risk governance determinants and the emergence of negative events. The internal audit’s assurance, consultative, and participative roles help strengthen risk controls in organisations (Huibers 2013). Therefore, it is suggested that auditing moderates the relationship between the risk governance determinants and project success.
Reliability Analyses and Descriptive Statistics
Introduction
This chapter discusses the validation and the reliability analyses of the instrument used in this research paper. This will be followed by a discussion of the general information gathered from questionnaire participants. Additionally, it provides a descriptive statistic which explains each determinant in this research.
Risk governance and risk management allow businesses to identify strengths, limitations, threats, and opportunities of their current and future projects. Examining how risk governance can influence project outcomes and success is a useful task that could potentially strengthen the competitive advantage and ensure that an organization reaches the objectives it has set earlier. Thus, the primary aim of the research is to critically investigate the correlation between effective risk Governance and the overall success of public projects in the Dubai.
There are various determinants that influence the success of public projects, in this research the researcher focuses on the risk governance determinants as factors that influences the success of the projects, the factors are considered the main construct of the designed questionnaire representing 5 main questions; the first question extends to 10 sub-questions which represent the determinants of risk governance. In order to cover the consistency and reliability of the collected data, the researcher will conduct primary tests on the data using Cronbach’s Alpha method.
The statistical analyses part primarily undertaken through SPSS software. This software is widely used in research in order to perform data entry and then generate graphs and tables on the basis of the analysis of entered data (Hinton, McMurray & Brownlow 2014; Leech, Barrett & Morgan 2014). It is recurrently used to deal with large data sets and can be utilized to conduct different types of analyses. The majority of individuals operating in the business world and social sciences tend to employ SPSS in their practice.
Respondents’ General Information
The sample included approximately 500 respondents that were contacted via social media, email, Risk management forum, and other methods. The researcher distributed hard copies of the questionnaire in the risk management in middle east forum and then collected the answers by means of the online service titled Survey Monkey. The sample represented the public sector of Dubai because the researcher was aware of the differences in the level of readiness of government organizations in terms of risk governance. Out of all surveys, only 151 were almost completed (113 out of 151 were fully completed and ready to be analyzed further). The survey took place for two months and the overall response rate was 22.6%. Then, the researcher generated a database in SPSS so as to examine the information that was acquired from the respondents. Below, a summary can be found.
Table 8.1 Sample responses summary.
The overall number of questions in the proposed survey is 148. The time spent on answering all those questions (approximately 25 minutes) became a serious challenge for the researcher in terms of achieving a decent response rate. Nonetheless, further analysis could be conducted even on the basis of the attained response rate.
According to Bartlett et al. (2001), the number of respondents from 72 to 96 is sufficient for the overall population size of 500 (it is also illustrated in the table 8.2). This means that the marginal error is 0.03 and alpha level is between 0.1 and 0.05. Accordingly, the number of respondents that took part in the existing research project is above the minimal acceptable range proposed by Bartlett et al. (2001). This left the researcher being highly confident about the results of the current research project and validity of the data that was obtained via surveys. They carefully proceeded with the interpretation of the obtained data and its careful analysis.
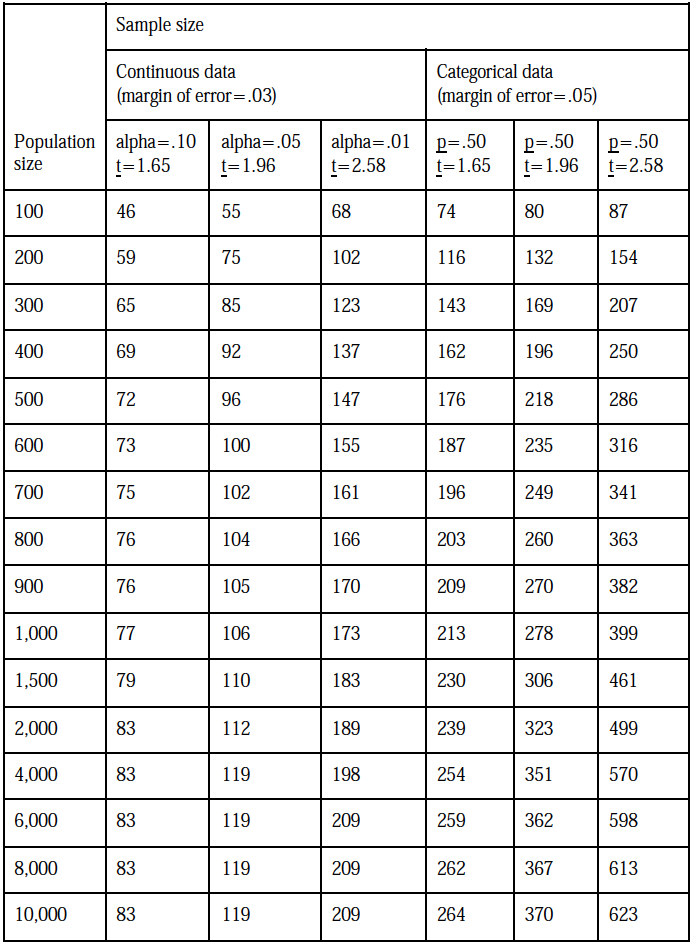
Reliability Analysis
In order to measure internal consistency, the researcher chose to use Cronbach’s alpha. This was the most suitable method because it allowed them to see the relations in coded groups. According to the literature, Cronbach’s alpha can also be perceived as a measure of scale reliability (Eisinga, Grotenhuis & Pelzer 2013; Geldhof, Preacher & Zyphur 2014). This means that, for instance, a high α value makes the measure unidimensional. On the other hand, there is a need to provide evidence that internal consistency is in place and all the additional analyses are available to the researcher (see Table 8.2). Therefore, Cronbach’s alpha can be seen as a coefficient consistency test and not a mere statistical variation of the latter (Bonett & Wright 2015). The researcher was interested in studying the average inter-correlation among coded items.
The key objective of using Cronbach’s alpha was not to measure either the dimensionality of the data or to test its undimensionality (Geldhof, Preacher & Zyphur 2014). Instead, the researcher was looking for similar coefficient scales that could be disclosed only by means of an experimental factor analysis (Eisinga, Grotenhuis & Pelzer 2013). Moreover, Cronbach’s alpha is not a mere measure of validity that only records “true” scores. It is important to remember that a reliable measure is the one that does not include any measurement errors that can distort the measurement process and trigger inconsistent outcomes (Adamson & Prion 2013). Nonetheless, there should be room for systematic error because reliability of the data is supported by its consistency and does not have to be completely error-free.
In order to measure the concepts at hand, the researcher went further and did more than a simple test of reliability while trying to measure a number of concepts (Geldhof, Preacher & Zyphur 2014). Instead, they evaluated the validity of the scale by means of applying both substantive and theoretical knowledge and finding all the reasons for considering certain measures to be either accurate or inaccurate (Eisinga, Grotenhuis & Pelzer 2013). As it can be seen from the table 7.2, the existence of empirical relationships between the concepts of interest and pre-set measures can also be seen as one of the most important components of addressing the study variables by means of Cronbach’s alpha due to the fact that the values of alpha are within the allowed limits and are in line with the requirements of the study (Eisinga, Grotenhuis & Pelzer 2013). Analysis of the results of the study showed that all the variables have a relatively similar coefficient of reliability.
Table 8.3 below assesses the cronbach alpha associated with each of the determinants of risk governance measured.
Table 8.3 – Results of Cronbach Alpha test for the study measures
As seen in the table above, all the variables highlighted are within acceptable limits and align with the study requirements. Indeed, most of them had cronbach alpha indices that were closer to 1 as opposed to 0. Since the variables had high coefficients, it is correct to deduce that the items analyzed had shared covariance. From the same statistic, it could also be deduced that they were all measuring the same research issue. This statement stems from the fact that the general rule of thumb in analyzing the reliability of SPSS data states that the cronbach alpha should be higher than 0.8. Conversely, many analysts consider scales that have less than 0.5 cronbach alpha to be unacceptable. Based on the above findings, it is important to point out that all the values highlighted above showed relatively similar levels of co-efficiency.
Risk based audit and project success emerged as having the highest cronbach value of 0.986. This number means that it had the highest internal consistency out of all the variables sampled in the study. “Risk appetite” had the second highest cronbach alpha of 0.978, meaning that it had the second highest internal consistency, followed by risk management and governance, risk appraisal and insight, risk development and decision, strategy, risk culture, risk decision and process implementation, ownership, Occurrence of negative events, and financial and technical capacity, in that order. Collectively, the items complete a list of variables with an internal consistency higher than 0.9. Comparatively, the internal audit function had the lowest internal consistency of 0.834. This finding could mean that most of the respondents did not understand its role in the risk governance processes or their organizations, relative to how they comprehended the other variables investigated.
Lastly, since all the determinants of risk governance highlighted above have a high internal consistency, it is correct to assume that there was no distortion of the measurement process and that there were consistent outcomes. However, this finding does not imply the lack of systematic errors in the study because the cronbach alpha mostly focuses on the internal consistency of the variables and not necessarily on guaranteeing the non-existence of errors.
Descriptive Method
As mentioned above the findings highlighted in this research were generated after analyzing the views of the research participants using the SPSS technique. This software package offers researchers different types of data analysis frameworks, such as bivariate statistics, prediction of numerical outcomes, group identification, geospatial analysis, GUI (R extension) and descriptive statistics, to analyze data. The researcher used the descriptive method to perform an independent analysis of the research variables to understand how they influenced the risk governance framework of the organization and the effectiveness of the projects. This method only highlights the basic features of the data set. Based on the descriptive nature of the data collection method, the findings presented in this research will be simple summaries of the respondent’s views. The goal of employing this data analysis technique is to assess the quantitative descriptions of the research variables in a manageable way.
As mentioned earlier the researcher collected the information that was subject for review using the survey method. The review focused on 148 variables, including control variables such as job level, experience, education, age, gender and nationality. The respondents gave their views using a questionnaire as the main data collection instrument. The survey had four main sections. The first one sought to find out the respondents’ opinions about the determinants of risk governance framework. The second part of the analysis included a survey of the research participants’ views about the influence of risk-based audit processes on the success of organizational projects, while the third part of the investigation sought to find out the occurrence of negative events on project success. The last part of the analysis involved an examination of the role of internal audit functions in risk management. Firstly, The demographic variables analyzed in the study included six key measures: age, educational experience, job level, gender and nationality. These variables are analyzed below.
Table 8.4 – Demographic Variables
Job Level
The job levels of the employees sampled were categorized into three key groups: employee level, middle-level management, and top-level management. The lowest level (employee level) accounted for 36% of the respondents sampled. Comparatively, 33.3% of the research participants were in middle-level management, while 30.7% of them were in top-level management. The distribution of employees across these job levels appears in figure 1 below.
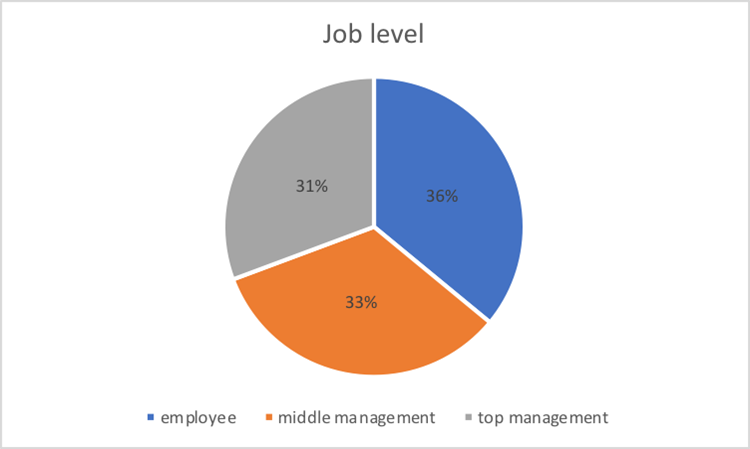
The above data shows that the findings of the study represent all the employees in the organization because the three job levels are not differentiated by more than 6 points. In other words, there is an almost equal number of lower level, middle-level and top-level employees who took part in the study. The lowest employee group (employee-level) comprised the largest cohort of participants in the study. This view implies that a majority of the employees support the decisions that come from the study because top-level managers are usually fewer than lower-level employees. The opposite scenario would be problematic for the study because if top-level managers were the majority of the respondents, it would be easy to criticize the findings based on the view that this employee group is not representative of most people in the organization (by virtue of the number of employees in working in the organisation). Generally, it could be assumed that all three job levels identified in the study provided a balanced representation of the participants’ views.
Work Experience
The employees’ work experiences were evaluated with regard to how they fit into five key groups. The first one was comprised of employees who had up to two years of work experience. They were 3.5% of the sample. The second group of employees was comprised of those who had between 3 to 5 years of experience and they comprised of 6.1% of the sample. Comparatively, employees who had 6-10 years of work experience were 27.2%, while those who had 11-19 years of experience were 47.4% of the total population sampled. The last category of employees comprised the majority group of respondents. Those who had more than 20 years’ worth of work experience comprised of 15.8% of the sample.
Based on these statistics, most of the employees sampled had 11-19 years of work experience, while the smallest group of employees who took part in the study had less than 2 years of work experience. This finding appears in figure 2 below.
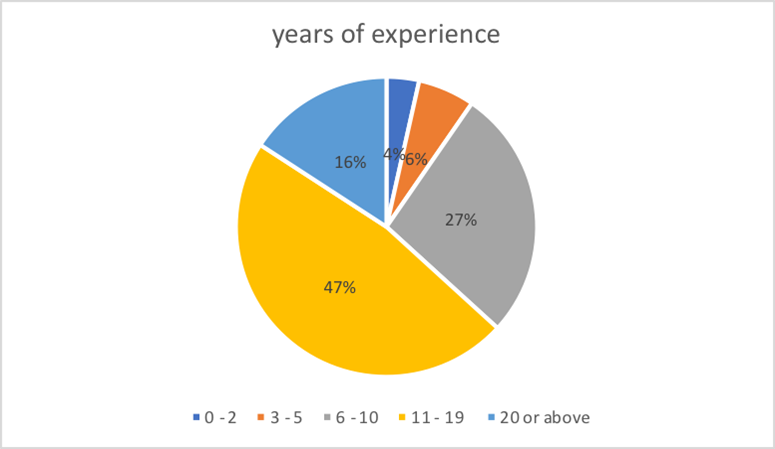
The pie chart highlighted above shows that the employees who had 11-19 years of work experience accounted for most of the responses in the study. This category of personnel was useful to the study because they may have answered the research questions from a point of knowledge about the organization’s activities. Their institutional memory of work processes was also instrumental in understanding the relationship between risk governance processes in the organization and the realization of project objectives in the firm. If this percentage is added to the number of employees who had more than 20 years of work experience, the total percentage of research participants who had more than a decade’s worth of work experience equals to 66% of the sample. This statistic implies that most of the respondents sampled had a lot of work experience to support their views in the study.
Education Level
The education levels of the employees sampled in the study were categorized into five groups that included high school (or less), college degree, higher diploma/bachelor degree, masters, and doctorate (or above). Those who had a higher diploma or bachelor’s degree were the majority because they comprised 42.1% of the sample population. The second biggest educational group of respondents was made up of employees who had a master’s degree. They were 33.3% of the total sample. The third biggest group of respondents was comprised of college-educated employees and they accounted for 15.8% of the respondents surveyed. Employees who had a doctorate degree (or above) were 8.8% of the total number of research participants. No respondent had a high school diploma (or less). These findings are summarized in figure 8.3 below.
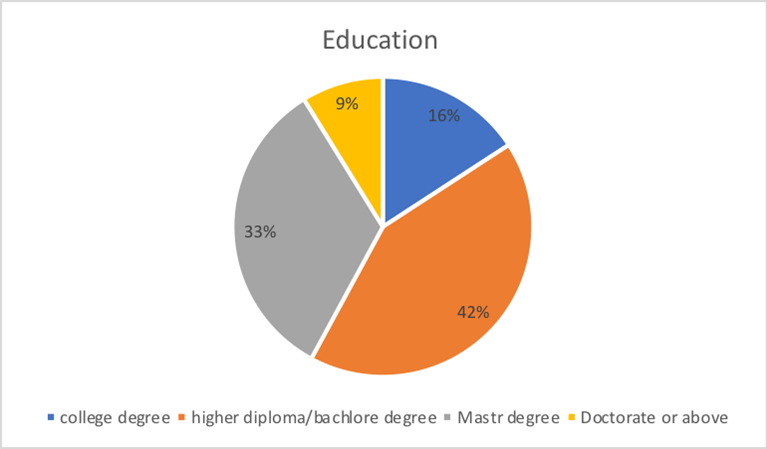
According to the pie chart highlighted above, most of the respondents sampled had a bachelor’s degree and above. The absence of employees who had a lower education level than that means that all the participants sampled were well educated. The pie chart above also shows that at least one-third of the employees sampled had a master’s education. This finding adds to the narrative that all the employees were highly educated. The existence of an 8.8% sample population of respondents who had a doctorate degree also means that some of the respondents had “very high” education levels. Collectively, these percentages imply that their responses were reliable because they were given from an educated point of view. The presence of 8.8% of the employees with “very high” education levels in the study also means that the investigation included different perspectives of workers who had the highest level of academic degree and possibly of the relationship between risk governance and project objectives. Therefore, these variations in education levels provide a balanced understanding of the respondents’ views.
Age
The research participants were also stratified according to age differences. There were five key categories of this variable. They comprised of employees who were 24 years (or lower), 25-30 years, 31-40 years, 41-50 years, and older than 51 years. A majority of the respondents were aged between 31 and 40 years. They comprised 51.8% of the total sample. The second biggest age group was comprised of employees aged between 41 and 50 years. They accounted for 25.4% of the total sample. The third largest age group of employees was comprised of those aged between 25 and 30 years. They were 15.8% of the total sample. Employees who were aged 51 years (or more) were 6.1% of the sample population, while the smallest group of employees was comprised of workers younger than 24 years. They constituted 0.9% of the total sample. A summary of the employee segmentation by age appears in figure 8.4 below.

The variations in age highlighted in the pie chart above indicate the inclusion of different generational differences in the findings gathered from the study. Based on the percentages mentioned above, it is plausible to assume that most of the respondents were middle-aged. By relying on the common understanding that young people are aged between 15-35 years, the findings above show that the respondents provided a balanced representation of the views of both the younger and older employees. This analysis makes it easy to extrapolate the findings of the study across different generational cohorts. Furthermore, it means that the views presented by the respondents provided different perspectives of employees in the workplace because older and younger workers often exude varying perspectives of risk management and governance issues. The multigenerational inclusion of respondents’ views also draws attention to the minimization of conflict between different sets of employees in the workplace, which may hinder their understanding of the research questions or their representation of the research issues. The inclusion of a balanced view of responses from both the young and the old also signify the need to merge the effects of different communication styles on the study. Since both sets of employees communicate differently, the inclusion of the younger and older employees in the survey means that communication bias may have been minimized when asking the respondents to give their views about the influence of risk governance on project objectives. Lastly, the presence of a low percentage of participants (0.9%) who were younger than 24 years in the investigation means that the contribution of views from “inexperienced employees” was minimal.
Gender
There were more males than females who participated in the study. Comprehensively, the total male population sampled was 65.8%, while the total sample of female participants in the study was 34.2%. The differences appear in figure 8.5 below.
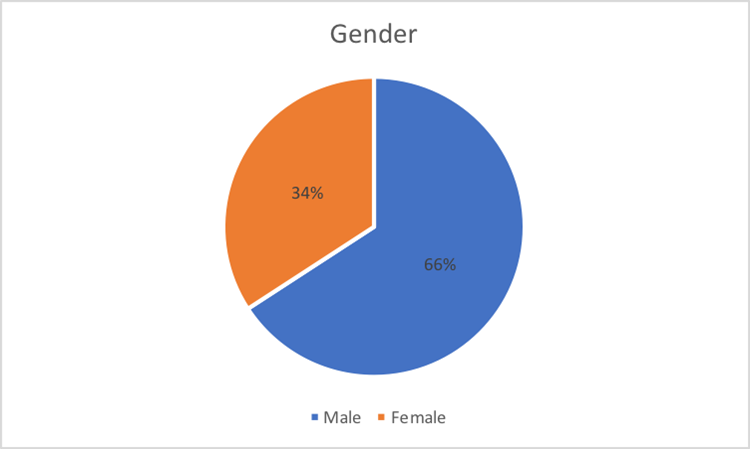
The aforementioned gender differences regarding how employees were sampled represent different views that male and female employees have about risk governance. The high number of male respondents in the study was not deliberate, but a fair representation of the gender differences in the workplace and their willingness to participate in the study. Nonetheless, someone could argue that the findings are gender biased because the percentage of male respondents was almost double that of female participants. However, this outcome was involuntarily achieved because there was no gender bias associated with the process of recruiting the research participants. Therefore, the differences represent the true picture of the workplace and, by extension, people’s views regarding the influence of risk governance on project objectives.
Nationality
Nationality was the last demographic variable used to analyze the research sample. Two categories were used to segment the sample population: UAE nationals and non-UAE nationals. Those who met the first criterion were 55.3% of the total sample, while those who met the second category of employees were 44.7% of the respondents surveyed. Figure 8.6 below shows the distribution.
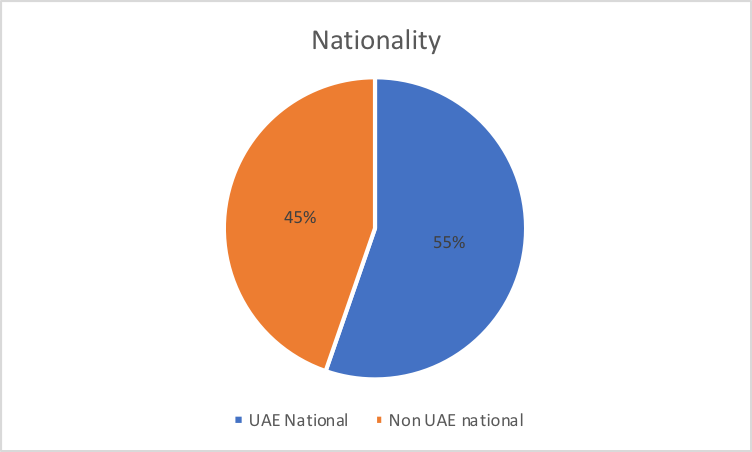
The pie chart above shows that the difference between UAE nationals who participated in the study and those who did not share the same nationality was 10 points. This statistic means that most of the workers who participated in the study were UAE nationals. Its implication is that the views provided by the respondents were mostly contextual to the experiences of the UAE nationals. However, to the extent that 45% of the respondents were non-UAE, it could be assumed that there was a balanced representation of non-UAE views in the study as well. The implication of this analysis is that the findings derived from the research could not only be limited to the UAE context. It also means that it is easy to extrapolate the findings to the non-UAE context.
The Descriptive statistics of the variables
Determinant 1: Strategy (S)
“Strategy” was the first determinant examined in relation to how it influenced the risk governance framework. During the investigation, the researcher asked the respondents to state whether their organizations had a process to align risks with objectives, an identification process for potential risks, a process for alignment of risk profile with business and capital management plans, and a procedure for integrating the risk management into the organization’s strategic decision-making plan. Additionally, the research participants had to give their views regarding the existence of a risk oversight body, a mechanism for understanding and enforcement of risk practices, a process for compliance with regulatory requirements, an internal audit process to implement a formal risk management program, and a financial crisis impact drive to implement risk management programs in their organizations.
A majority of the respondents sampled said that “strategy” was “likely” a key part of their organizations’ risk management processes. The mean percentage of respondents who held this view was 37%. A significant number of respondents also held “neutral” views about the likelihood of the above strategy existing in their organizations’ processes. Broadly, this group of respondents amounted to 26% of the total sample. Comparatively, a significant percentage of respondents said “strategy” “unlikely” existed in their organizations or “very likely” existed in their workplaces. The mean percentage of respondents who held these views were 16% and 18%, respectively. Generally, a majority of the respondents said that the variables associated with strategy likely existed in their workplaces.
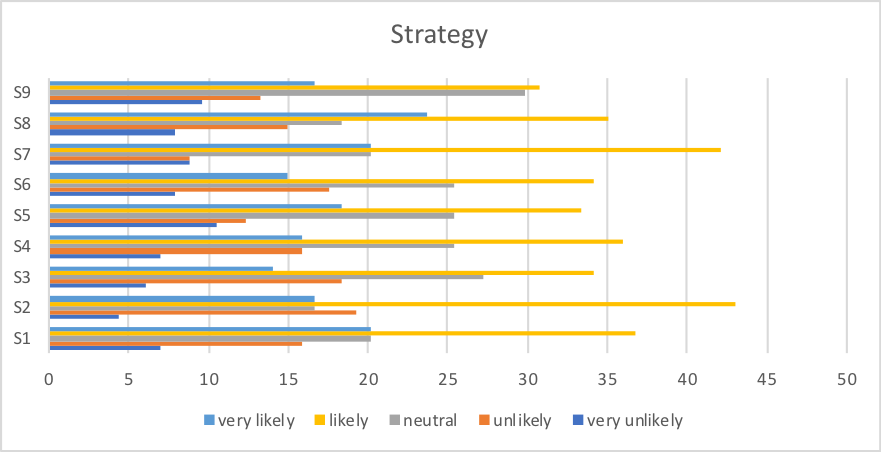
Determinant 2: Risk Appraisal and Insight (RAI)
The second determinant analyzed in the survey was risk appraisal and insight. The researcher analyzed ten variables in this investigation. The first five involved an analysis of whether organizations had risk identification mechanisms, mechanisms for risk repository, qualitative risk assessment criteria, quantitative risk assessment criteria, and a mixed risk assessment criteria (both qualitative and quantitative). The presence of a mechanism for updating risk assessment frameworks, a process for regular quantification and aggregation of risks, guidelines for prioritization of risk management and control, a control framework calibrated in line with risk appetite, and the existence of guidelines for quantified of tolerance for loss or negative events were the last five variables investigated. Most of the respondents sampled said that these risk appraisal and insight techniques existed in their organizations.
For example, the least percentage of respondents who said these variables likely existed in their organizations were 46% and they were referring to the existence of guidelines for quantified tolerance for loss or negative events. The rest of the variables had higher percentages of respondents who believed that the risk appraisal methods queried existed in their organizations. Coupled with the number of respondents who said that these methods “very likely” existed in their organizations, it is safe to conclude that a majority of the participants sampled believed that the aforementioned variables of risk appraisal and insight existed in their organizations.
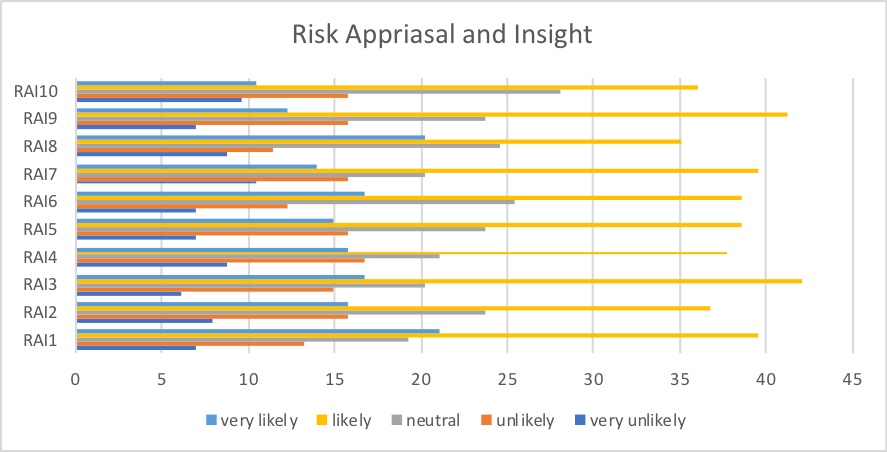
Determinant 3: Risk Decision and Process Implementation (RD)
The third determinant affecting risk governance that the researcher investigated in the study was the risk decision and process implementation. This determinant of risk performance had four variables. They included the presence of a procedure for grounding of risk in all business decisions, the existence of a mechanism for embedding risk optimization in strategic decisions, presence of procedures for executing core business processes and operations based on risk consideration, and the existence of a simple risk model as support business tools for decision-making. Most of the respondents sampled said that decision and process implementation tools “likely” existed in their organizations. Those who were “neutral” about the existence of the same tools formed the second biggest percentage of respondents, followed by those who thought these systems were “unlikely” to exist in their organizations.
The least percentage of respondents said it was “very unlikely” that the risk decision and process implementation procedures existed in their organization. The mean percentage of those who thought this way was 6%. The average percentage of respondents who said such procedures “likely” existed in their organizations (the majority group) was 34%. Based on an evaluation of these percentages, it is correct to conclude that a majority of the respondents said the highlighted risk decision and process implementation processes existed in their organizations.
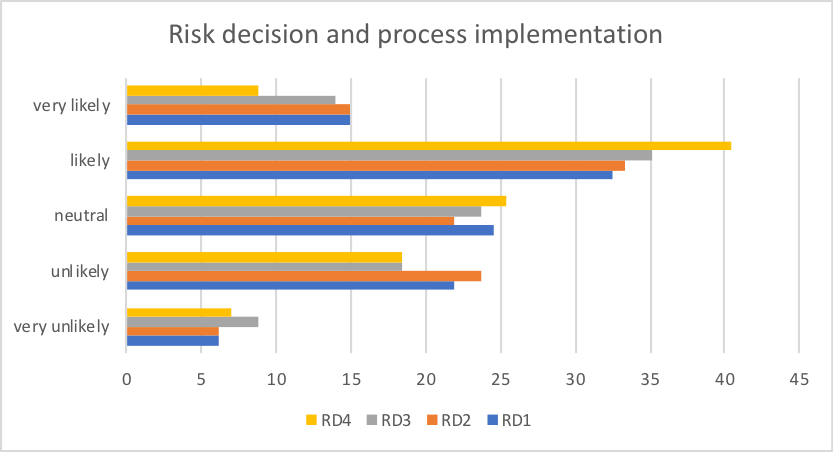
Determinant 4: Risk Management and Governance (RMG)
The existence of risk management and governance processes in organizations was the fourth determinant of risk governance investigated in the research. Cumulatively, there were 19 variables associated with this determinant. The first four included the existence of risk management policies and procedures, the presence of support and sponsorship of the risk management process by the board and executive, and the existence of regulatory requirements to adopt risk management practices. Other variables investigated included the existence of a CRO position in their organizations, the presence of a formalized approach to address risks, the availability of guidelines to define the roles and responsibilities of risk staff, the availability of a risk communication mechanism, the existence of a whistle-blowing mechanism and the existence of ethics and code of conduct policies.
Other variables analyzed included the existence of guidelines for internal audit, the existence of a risk function, the availability of risk treatment plans, the presence of a process for risk identification, the presence of a process for identifying and monitoring key risk indicators and the availability of a regular risk communication framework supported by the board and senior management. The existence of a formal risk oversight authority, guidelines for risk internal control, guidelines for definition of risk accountability and ownership and procedures for fraud risk assessment were the last variables analyzed in this segment of the analysis.
A general overview of the respondents’ views on this determinant showed that a majority of them believed that Risk Management and Governance processes “likely” existed in their organizations. The average percentage of respondents who supported this view was 34%. The lowest number of respondents sampled said it was “very unlikely” that Risk management and Governance processes existed in their organizations. An average of 20% of the respondents held “neutral” views about this subject, while a mean percentage of 16% of the respondents said that such processes “very likely” existed in their organizations. Therefore, a comprehensive review of the findings shows that a majority of the respondents believed that Risk management and Governance processes existed in their workplaces.
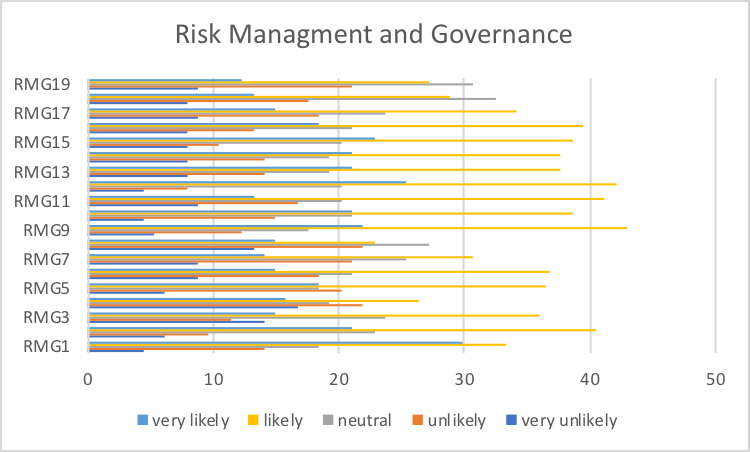
Determinant 5: Review Risk Development and Decision (RRD)
Another determinant investigated in the research involved a review of risk development and decision processes in organizations. The variables investigated involved an evaluation of whether the respondents believed their organizations had an internal audit assurance framework for risk management, a process for ongoing update of risk assessment, a mechanism for independent assurance by a third party, guidelines for board/audit committee oversight processes, and a process for monitoring and reviewing the risk management framework. The respondents were also asked to state if they believed their organizations had guidelines for revision and reconstruction of risk management, a framework for periodic reporting on risk, a process for escalating and notifying risks to the relevant authority, a process for management and monitoring of risk exposures, and a documentation process supporting the same.
A majority of the respondents (45.9%) said their organizations had a documentation process. However, an analysis of the general opinions of the participants reveals that most of them believed their organizations “likely” practiced periodic reviews of risk development and included them in their decision-making processes. Only an average of 7% of the respondents believed that it was “very unlikely” that such processes did not exist in their organizations. This percentage shows that most organizations review their risk development processes and reflect the same findings in their decision-making processes.
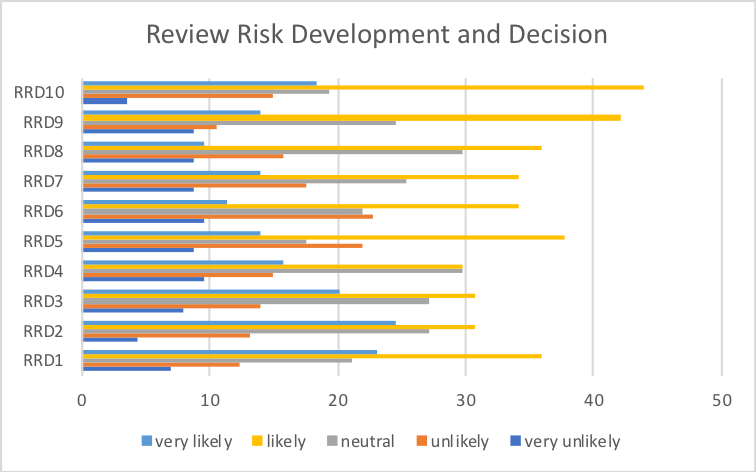
Determinant 6: Risk Communication (RC)
In the questionnaire, the researcher also analyzed risk communication as a determinant of risk governance. Relative to this investigation, a majority of the respondents said their organizations had a risk communication framework. In fact, most of them said their workplaces had guidelines outlining how to coordinate risk management activities as well as provisions for appointing risk champions from business units. In both of these variables, a mean percentage of 39.5 of the respondents said the processes “likely” existed in their organizations. No other variable attracted a similar percentage of views. This response rate referred to the perception of the research participants about 12 variables highlighted in the study.
The variables explored the possibility of an existence of a process for risk communication, a process for promoting transparency in the organization, guidelines for coordinating risk management activities, rules for appointing risk champions from the business unit, a risk awareness initiative, and procedures for internal communication of amount, and type of risk to accept and manage. The researchers were also asked to state whether their organizations had processes for external communication to promote transparency and accountability, guidelines for monitoring and reporting of performance against risks, a risk register, a risk heat map (or dashboard indicating risk portfolio), key risk indicators report and an aggregated quantitative risk exposure report. Broadly, a majority of the respondents said these risk communication covariates “likely” existed in their organizations.
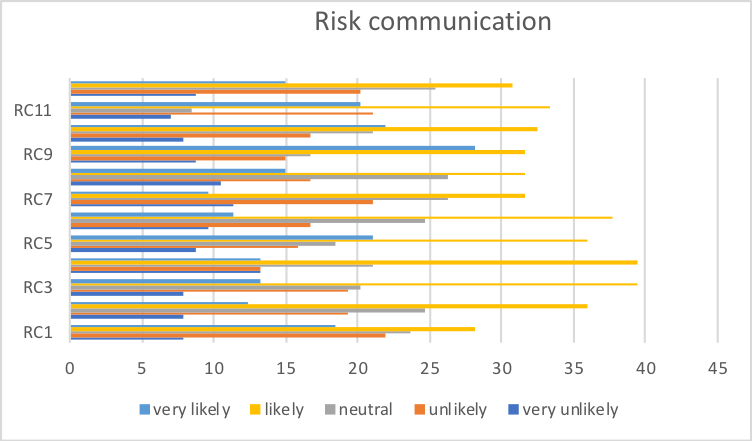
Determinant 7: Risk Culture (RCU)
Risk culture was also investigated as another key determinant of risk governance. The respondents were asked to state whether their organizations had set guidelines for promoting accountability, a risk awareness program, guidelines for internal audit to promote the risk culture, procedures for risk management training, a process for risk culture audit, a program for talent development, a framework for fostering risk understanding, and formal training processes for risk awareness and fraud. The biggest percentage of the respondents acknowledged the presence of guidelines for promoting sustainability. The mean percentage of those who felt this way was 37.7%. No other variable had such a high approval rate.
Most of the respondents also acknowledged some type of risk culture in their organizations, because a majority of them said the variables highlighted above “likely” existed in their workplaces. An average of 13% of the respondents had a strong conviction that a risk culture existed in their organizations because they said most of the variables highlighted in the organization “very likely” existed in their workplaces. Therefore, it is possible to deduce the fact that a majority of the respondents either believed a risk culture “likely” or “very likely” existed in their organizations. Nonetheless, the percentage of respondents who said the processes “likely” existed was larger.
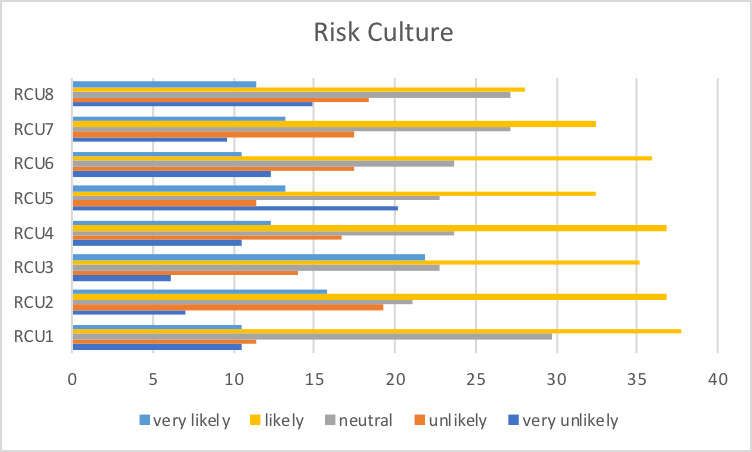
Determinant 8: Financial and Technical Capacity (F)
The researcher also sampled the respondents’ views regarding the financial and technical capacity of their organizations. Five variables were analyzed to explore how this determinant influenced risk governance. They included an evaluation of the presence of a mechanism for allocating adequate capital to manage risk, a framework for acquiring skills and management capability, the existence of human skills, financial resources, and risk technology. A majority of the respondents sampled acknowledged the existence of a strong financial and technical capacity in their organizations. Within the majority, most of them said their organizations had adequate human skills. The least number of respondents sampled said it was “very unlikely” that their organizations had a strong financial and technical capacity. A mean of 15% of the respondents also answered in the affirmative because they said their organizations “very likely” had the financial and technical strategies discussed.
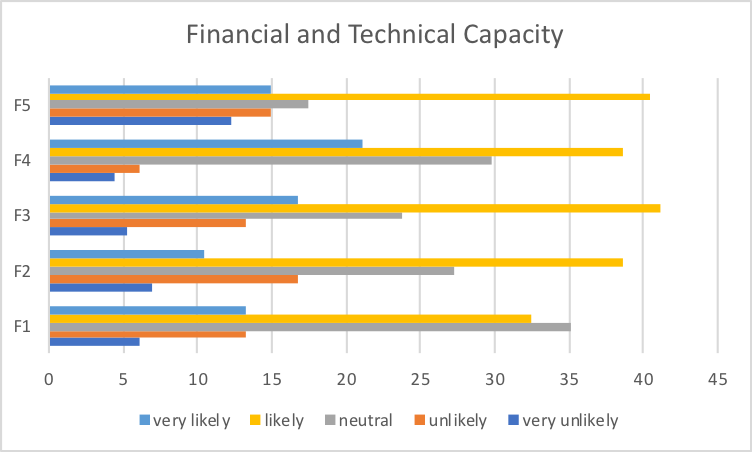
Determinant 9: Risk Appetite (RA)
Another determinant investigated in the study was risk appetite. The respondents were asked to state whether different variables associated with the risk appetite were present in their organizations. The variables analyzed sought to establish whether a risk appetite framework, a risk appetite statement, an understanding of the current risk capacity, a periodic review of risk appetite limit, frequent reviews of risk appetite, and a synchrony of the risk appetite between the management board existed in the respondents’ organizations. The investigation also spread out further to establish whether organizational functions, a framework for communicating risk appetite tolerance, a reporting process that indicates when risk thresholds are reached, and a framework for integrating risk management into the organization’s performance framework also existed in their workplaces.
Broadly, a majority of respondents said most of the risk appetite processes mentioned in the questionnaire existed in their organizations. Averagely, 33% of the respondents felt this way. A significant percentage of the respondents (25%) also held “neutral” views about the existence of such risk appetite processes in their organizations. The least percentage of respondents said it was “very likely” that their organizations had the specific risk appetite processes questioned in their organizations. This finding was different from most of the other determinants investigated in this research because the least percentage of respondents so far sampled believed the risk determinants “very unlikely” existed in their organizations. However, in this determinant, the least percentage of respondents were in the category of respondents who said it “very likely” existed in their organizations.
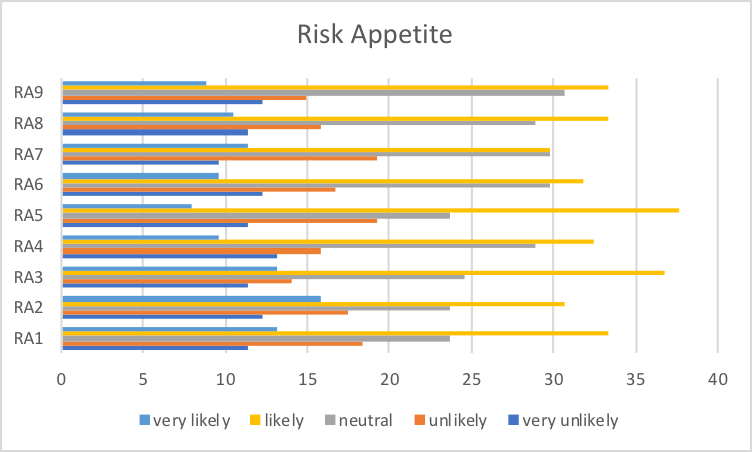
Determinant 10: Ownership
When the respondents were asked to give their views about the presence of risk ownership processes in their organizations, a majority of them said such ownership processes “likely” existed in their organizations. This finding was similar to other responses given in this study when investigating the presence of other risk determinants because those who said they “likely” existed in the organization were the majority again. The mean percentage of respondents who held the same view about the risk ownership process was 37%. The least percentage of respondents sampled said the risk ownership processes questioned “very unlikely” existed in their organizations.
This finding means that most of the organizations where the respondents came from “likely” had a risk ownership process. Nonetheless, an interesting finding seen from this analysis is the high number of respondents who were almost evenly spread across all the response options when answering about the existence of a third-party service provider for risk management activities. In other words, the number of participants who said this variable “existed” and “did not exist” in their organizations was almost equal. Generally, compared to other determinants sampled in the study, the risk ownership determinant had the highest distribution of responses.
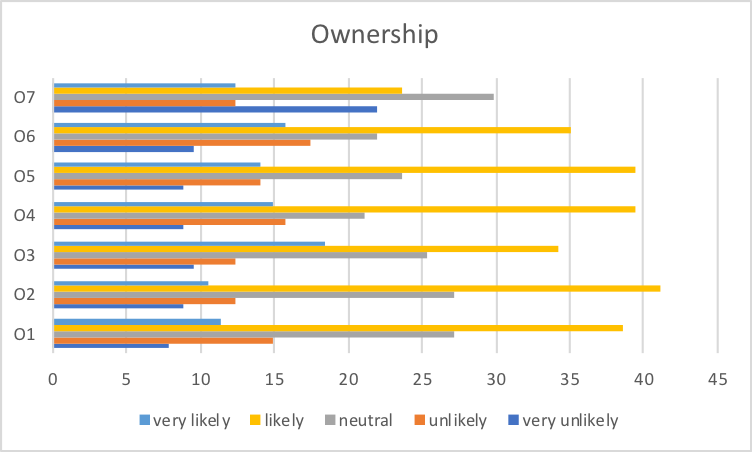
Determinant 10: Risk based Audit and Project Success
The second part of the investigation (Part B) involved an analysis of the contribution of risk audit processes to the realization of organizational project objectives. The respondents were asked to give their views regarding different aspects of this risk determinant. Comprehensively, they gave their views about how risk audit processes influenced their organizations’ strategic objectives, project time and budget, understanding of key risks, identification of project risks, reporting of risk patterns, risk sharing across multiple departments, redirection of management’s focus on the important issues, led to fewer surprises and risk crises, and led to the efficiency of their organizations. Coupled with other variables, the research participants collectively responded to 28 variables.
The biggest percentage of respondents sampled said it was “likely” that risk-based audit processes contributed to their organization’s project objectives and success. The mean percentage of respondents who answered this way was 43%. Within this majority, there was a greater consensus among the respondents that the risk audit process led to an improved ability to execute operational plans. About 52% of the respondents (within the majority group) felt this way.
The percentage of respondents who held neutral views about the influence of the risk determinant on the realization of their operational goals was almost equal to the percentage of respondents who said it was “very likely” the audit process helped in the realization of their organizational strategic objectives. The difference in mean percentage between both sets of respondents was 2%. Nonetheless, comprehensively, this determinant (audit process) also followed the same pattern of responses as that observed in other determinants of risk governance because the biggest percentage of respondents fell in the “likely” group (similar to how they responded to the other determinants).
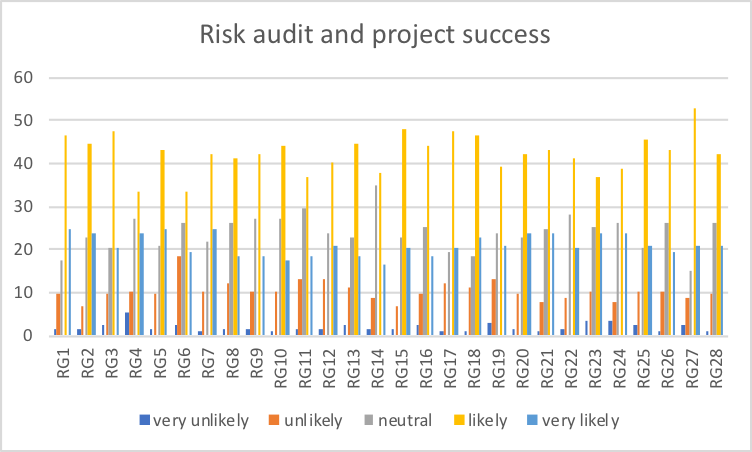
Determinant12: Occurrence of Negative Events
The third part of the questionnaire sought to understand the respondents’ views about the impact of varied negative events on their organizations. Several adverse events were investigated. They included an experience of schedule delays, an experience of cost over-runs, a lack of control over project phases, an experience of project failure, an inability of the governance model to manage key projects, and the experience of unresolved issues and disputes. The lack of independent monitoring and progress, the failure to report to the management board and executives, the failure of an organization to achieve business objectives, and the lost opportunity cost of doing the wrong project are other variables investigated in the study.
The biggest group of respondents sampled said the variables were “unlikely” to have an effect on their organizations. The mean percentage of respondents who held this view was 32%. The second largest group of respondents said the variables sampled “likely” had an effect on their organizations. The mean percentage was 27. The third largest group of respondents held “neutral” views about the research statements and their mean percentage was 26. Those who held extreme views about the research issue (“very likely” and “very unlikely”) formed the smallest percentage of respondents.
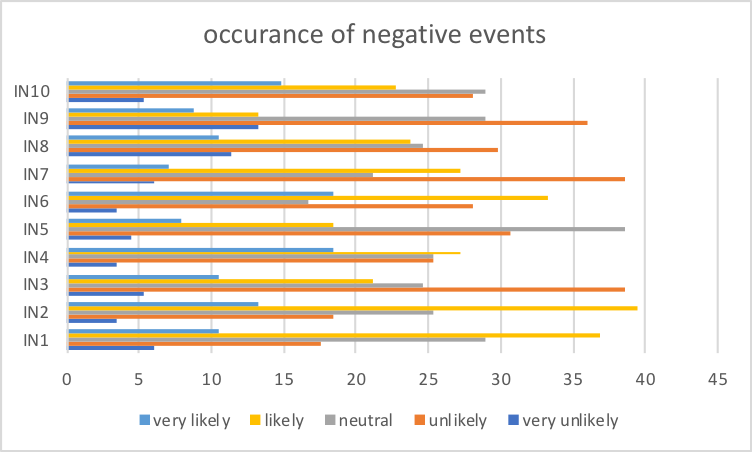
Determinant 13: Internal Audit Functions (IAF)
The fourth part of the survey sought to find out the respondents’ views about the role of internal audit functions in their organizations. In line with this subject matter, they were asked to rate how specific aspects of their internal audit functions influenced their risk management processes. The internal audit functions investigated included the provision of independent assessments on risk management processes, the establishment of a formal risk management program, a support for the implementation of a risk management program, and the provision of consultancy and advice on risk management processes. The interference of internal audit processes on risk management processes, an assurance of how risk management processes will be handled, the provision of assurance through written audit reports about the entity-wide risk management process, and participation in setting the organization’s risk appetite, are other variables that were also investigated in this section.
The largest group of respondents sampled said that the internal audit functions mentioned above were “important” to their risk management functions. About 36% of the respondents felt this way. The second largest group of research participants said that the internal audit processes were “very important” to their risk management processes. The mean percentage of respondents who thought this way was 34. The lowest percentage of respondents said the internal audit process was “very unimportant” to their organizations. This percentage of respondents was the lowest in the study (4%).
Furthermore, in two variables sampled, none of the respondents said that internal audit processes were “unimportant” to their risk management process. The two variables were the provision or consultancy and risk advice practices and the provision of assurances through written reports covering how key risks are managed. Generally, a majority of the respondents sampled said that the internal audit process was instrumental in the proper functioning of their risk management processes.
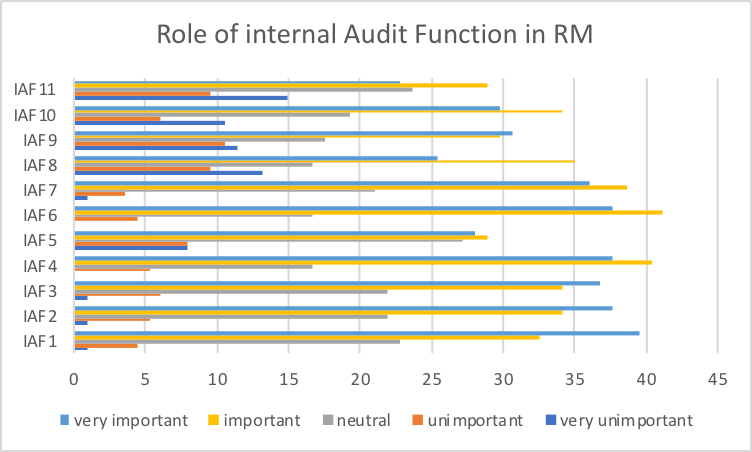
Summary
In this chapter, the findings deduced from this report are reliable because the items investigated have a high internal consistency. Evidence of this fact emerged from the reliability analysis report undertaken in this chapter, which showed that 12 variables had a cronbach that was higher than 0.9. Conversely, only one variable had a cronbach equal to this figure (0.834). Since all the indices are within acceptable limits, it is correct to assume that the research findings had a strong level of reliability. Therefore, all the variables highlighted are within acceptable limits and align with the study requirements. More importantly, most of them had cronbach alpha indices that were closer to 1 as opposed to 0.
Since these numbers are high coefficients, it is correct to assume that the items analyzed had shared covariance. From the same view, one could also assume that they were all measuring the same research issue. As highlighted in this chapter, these assumptions stem from the fact that the general principle in analyzing the reliability of SPSS data states that the cronbach alpha should be higher as 0.8. Thus, if the research process had produced cronbach alpha numbers of less than 0.5, they would be unacceptable. Based on the above findings, presumably, all the items sampled had similar levels of co-efficiency.
Lastly, the findings of the survey are presented through a holistic assessment of 13 key determinants of risk governance. They included strategy, risk appraisal and insight, risk decision and process implementation, risk management and governance, review risk development and decision, risk communication, risk culture, financial and technical capacity, risk appetite, ownership, risk-based audit and project success, the impact of negative events, and the role of internal audit function in Risk management. In all these 13 determinants of risk governance, the largest percentage of respondents said these covariates “likely” existed in their organizations or influenced their risk management processes. This finding means that most of the risk determinants were practiced in the respondents’ organizations and they influenced their risk management guidelines.
However, an interesting finding that emerged in this study is the similarly high number of respondents who held “neutral” views about the research questions asked. In other words, they did not know whether the variables existed in their organizations’ or were practiced in their workplaces in the first place. This large percentage of respondents who held “neutral” views about the issues investigated could have arisen because of their unfamiliarity with some aspects of their organizations’ risk Governance and management practices.
Factor Analysis
Factor analysis was employed to extract critical factors in the questionnaire that explain risk governance determinants. According to Jackson (2015), factor analysis applies in the design of a valid and reliable scale because it extracts the most significant factors from observed data that explain a construct of interest. In the analysis of observed data, factor analysis employed maximum likelihood as an extraction method. Denis (2016) expounds that maximum likelihood is expedient because it permits computation of varied indexes, determination of significance of factor loadings, and calculation of confidence intervals and correlations. Factor analysis was done on 10 scales in the questionnaire, namely, strategy (S), risk appraisal and insight (RAI), risk management and governance (RMG), review risk development and decision (RRD), risk communication (RC), risk culture (RCU), risk appetite (RA), risk-based audit and project success (RG), Impact of negative events (IN) and Internal audit function (IAF).
KMO, Bartlett’s, and Cronbach’s alpha tests were determined and tabulated in the following table (Table 9.1).
Table 9: Tests for KMO, Bartlett, and Cronbach’s alpha
KMO statistics for all variables are greater than 0.8, which means that the sample sizes are adequate for factor analysis. Field (2014) states that KMO values between 0.8 and 0.9 indicate a good sampling adequacy, whereas those greater than 0.9 exhibits an excellent sampling adequacy. Bartlett’s test indicates statistical significance, which means that the correlation matrix is dissimilar to the identity matrix (Pallant 2016). Cronbach’s alpha indicates that internal consistency of items is within a good level (0.8-0.9) and perfect level (above 0.9) for the reliability of the questionnaire to be robust (McCormick et al. 2017; Elliott & Woodward 2015). Thus, the following sections cover factor analysis of the ten scales in the questionnaire.
Factor Analysis for Strategy (s)
Table 9.1a: Total variance explained for strategy
Factor analysis extracted, the first, second, and third factors with eigenvalues of 5.862, 0.434, and 0.261, which explained 65.13%, 4.82%, and 2.90% of variances correspondingly. Figure 9.1 confirms that maximum likelihood extracted three factors as demonstrated by the inflection point of the scree plot.
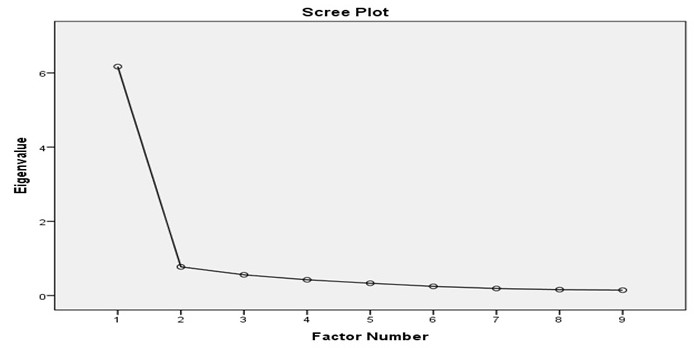
Table 9.1b: Pattern matrix for strategy
Table 91.1c above shows how each item loaded onto different latent clusters of Strategy (S). Three items, S3, S9, and S4, loaded onto the first latent variable with loadings of 0.829, 0.685, and 0.661 respectively. Four items, S7, S8, S6, loaded onto the second new latent variable with loadings of 0.719, 0.694, 0.628, and 0.557 in that order. Item S1 loaded onto the third latent variable with a loading of 0.849 and will be shifted to second new latent cluster.
Table 9.1c: Pattern matrix for strategy with new codes
The Table 9.1c depicts two latent clusters of Strategy (S):
- Four items, S1, S3, S4, and S9, are highly reliable as they loaded on the first latent cluster with Cronbach’s alpha of 0.912.
- Four items, S5, S6, S7, and S8, are highly reliable for they loaded onto the second latent cluster with Cronbach’s alpha of 0.863.
In summary, Table 9.1d illustrates that four items that loaded onto the first latent cluster were coded as a new item (SG1), while the other four items that loaded onto the second latent cluster were coded as a new item (SG2).
The interpretation of the (2) new latent clusters is provided below:
Risk alignment process – SG1
Risk alignment process (SG1) is a new cluster derived from nine factors of strategy. It comprises two components of the strategy that explains 68.03% of its variance. The first component with three items accounts for 65.13% of the variance, whereas the second component with one item accounts for 2.9% of the variation. Collectively, the four items are highly reliable in predicting risk alignment process as an aspect of strategy in risk governance. Risk alignment involves synchronisation of operations and activities in an organisation to meet objectives, performance measures, and strategies employed by organisations in risk management.
In their study in the banking industry, Sheedy and Griffin (2017) established that infrastructure, culture, and strategy are three factors, which require synchronisation for organisations to achieve optimal performance in risk management. Infrastructure offers a supportive foundation for risk managers to implement risk management operations and activities. Culture promotes synchronisation for it encourages risk managers to follow established procedures and practices in their roles and responsibilities while exercising risk governance. The strategy provides a framework for implementing risk management successfully in an organisation. Thus, alignment is critical in risk governance because it optimises interventions of risk management.
The examination of questionnaire reveals that risk alignment process entails S1, S3, S4, and S9 items. The questionnaire shows that alignment of risks with strategic objective, risk profile with capital management, risk management with strategic decision-making, and financial crisis with risk management plan are main strategies that organisations should utilize in risk governance. Smith (2016) argues that the inability to align risk interventions in organisations does not only reduce the capacity to manage risks but also increases the occurrence and impacts.
Organisations without risk alignment do not achieve optimal performance of their operations and activities due to incoordination and confusion emanating from conflicting processes. Organisations with poor risk alignment processes are characterized by inefficiencies, incoordination, inflexibility, and disintegrated operations and activities. Sheedy and Griffin (2017) recommend risk managers to streamline their operations by creating risk alignment process. Therefore, it is evident that organisations cannot forgo risk alignment process in managing risks that threaten their objectives.
Risk oversight practices – SG2
Risk oversight practices (SG2) forms a new cluster derived from nine items of strategy in risk governance framework. It constitutes a single component that explains 4.82% of the variation in strategy. The component comprises four factors that are highly reliable in predicting risk oversight practices in risk governance framework. Lyons (2015) defines risk oversight practices as interventions of enterprise risk management (ERM), which the board of directors undertakes in the management of risks. Oversight practices of risks entail identification, assessment of impacts, mitigation of occurrences and effects, and review of the efficacy of interventions. Lyons (2015) established five layers of defence in ERM, namely, the board, the executive management, the internal assurance, tactical oversight, and operational oversight, which helps the board of directors to manage risks effectively. The inclusion of tactical and operational layers of defence into the conventional three-layered model of defence has enhanced the capacity of organisations to undertake risk oversight practices.
The examination of questionnaire shows important themes that related to risk oversight practices applied in the development of strategies in risk governance. The existence of oversight body, the mechanism for comprehending risk practices, the process for regulatory compliance, and the internal audit process are major factors that explain risk oversight practices. These factors are in line with the findings of Lyons (2015), which shows that risk oversight practices should occur in various layers of organisations ranging from the management level to operational level. Organisations with widespread oversight practices have enhanced the ability to manage and control risks.
Vecchiato (2015) recommends organisations to define oversight responsibility of the board, improve risk intelligence, assess risk appetite, align risk identification with interventions, evaluate the capacity of risk governance, and inform stakeholders about risk process. These recommendations capture risk oversight practices that organisations have to adopt and implement for effective management of risks. Thus, risk oversight practices promote the capacity of organisations to overcome challenges that are dominant in turbulent environments.
Factor Analysis for Risk Appraisal and Insight
Table 9.2a: Total variance explained for risk appraisal and insight
Through the method of maximum likelihood, factor analysis extracted 1, 2, and 3 factors with eigenvalues of 7.267, 0.235, and 0.662, which explained 72.67%, 2.35%, and 6.62% respectively. Nevertheless, the scree plot shows extraction of two factors with a significant impact on risk appraisal and insight.
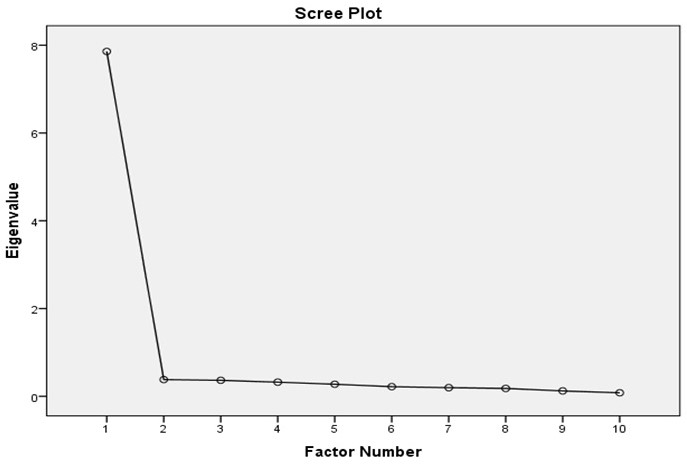
Table 9.2b: Pattern matrix for risk appraisal and insight
Pattern matrix (Table 9.2b) indicates that five items, RAI9, RAI8, RAI1, RAI2, and RAI10, loaded onto latent cluster 1 with 0.948, 0.689, 0.683, 0.646, and 0.562 loadings respectively. Two items, RAI4 and RAI5, loaded onto the second latent cluster with 1.001 and 0.477 loadings in that order. RAI6 is the only one item that loaded onto the third latent cluster with a loading value of 0.977 and will be shifter to second latent cluster.
Table 9.2c: Pattern matrix for risk appraisal with new codes
The table 9.2c depicts the two new latent clusters:
- Five items, RAI1, RAI2, RAI8, RAI9, and RAI10, are significantly reliable because they loaded onto the first latent cluster with Cronbach’s alpha of 0.937.
- Three items, RAI4, RAI5, and RAI6, are significantly reliable for they loaded onto the second latent cluster with Cronbach’s alpha of 0.936.
In recap, Table 9.2c shows that the five items in component one was coded as a new item (RAIG1), while the three items that loaded onto the second component were coded as a new item (RAIG2).
The interpretation of the (2) new latent clusters is provided below:
Risk Guidelines – RAIG1
Risk guideline (RAIG1) is a new cluster derived from 10 items of risk appraisal and insight. It explains 72.267% of the variation in risk appraisal and insight. Risk guidelines encompass five factors, namely, RAI1, RAI2, RAI8, RAI9, and RAI10, which are highly reliable for they loaded onto a single component. Risk guidelines are central to risk management for they provide framework, principles, and process for managing risk in diverse organisations. The nature of risk guidelines determines their effectiveness in the management of risks.
Evidently, organisations with comprehensive risk guidelines manage their risks successfully. The International Organisation for Standardisation formulated ISO 31000, which stipulates risk guidelines aimed at boosting the capacity of organisations to manage risks (Cooper et al. 2014). The ISO guidelines provide a concise, simple, and clearer process for organisations to expedite their risk management regarding planning and decision-making. The ISO focuses on the principles of risk management, integration into all operations, iteration of risk management, and streamlining of processes.
Risk guidelines are essential in the management of risk for they provide framework, principles, and processes that are not only effective but also promote standardisation of operations and activities. Bergstrom and Frykmer (2016) employed complexity theory in asserting that an analytical framework comprising dimension, scope, and resolution systems form the basis of risk management guidelines. The integration of risk guidelines into the analytical framework offers a robust way of streamlining and synchronising operations and activities.
According to ISO 31000, organisations ought to formulate empirical guidelines and feasible principles, which guide risk managers on how to manage diverse risks. The existence of clear and concise risk guidelines eliminates ambiguity and obscurity in the process of risk management. The absence of risk guidelines creates confusion and reduces synergy of auditors for they would perform uncoordinated tasks, which hinder effective management of risks. Thus, the cluster of risk guidelines is critical in the assessment of the capacity of organisations to undertake effective risk governance.
Risk assessment process – RAIG2
Risk assessment process (RAIG2) is a new second cluster derived from 10 items of risk appraisal and insight. It comprises two components explaining 2.348% and 6.616% of the variation in risk appraisal and insight. The first component has two factors, RAI14 and RAI15, whereas the second component has one factor, RAI16. These components collectively explain 8.964% of the variation in risk appraisal and insight. Risk assessment process is an established method of risk management that allows risk managers to identify risk and formulate effective mitigation measures. In risk assessment, risk managers should identify risks, recognise vulnerable project objectives, determine the potential occurrence, provide a comprehensive report, and offer a continual review (Aven 2016).
Identification of risk is the primary role of risk managers for it enables them to comprehend the nature and magnitude of impending impacts. Since risks have huge impacts on certain project objectives considered as weak points in an organisation, recognition of these objectives improves preparedness. The determination of potential occurrence aids in evaluation of the magnitude of the impacts, and thus, forms the basis of developing effective migration measures. Given that risk assessment process provides important information about risks, organisations require a detailed report for risk managers to examine, develop mitigation measures, and undertake a constant review.
Normally, risk assessment process entails the quantitative and qualitative risk analysis. The quantitative risk analysis considers risks, which have considerable effects on project objectives, whereas the qualitative risk analysis considers all risks identified in a given project. In the qualitative risk analysis, risk managers employ scientific and mathematical models in predicting the occurrence and the impacts of risk on respective projects in organisations. In contrast, risk managers apply expert judgment in the qualitative risk analysis to determine the occurrence and impacts of risks. Due to the increasing importance of the risk assessment process, modern organisations have integrated enterprise risk management in their boards (Viscelli, Beasley & Hermanson 2016). Risk management boards with established risk assessment process are effective in risk governance.
Factor Analysis for Risk Management and Governance
Table 9.3a: Total variance explained for risk management and governance
In Table 9.3a, the extracted factors had eigenvalues of 12.828 and 0.868 for the first and second factors, which explained 67.51% and 4.57% of the variation in risk management and governance respectively. However, the scree plot (Figure 9.3) demonstrates that four factors provide a significant influence on the variation of data.
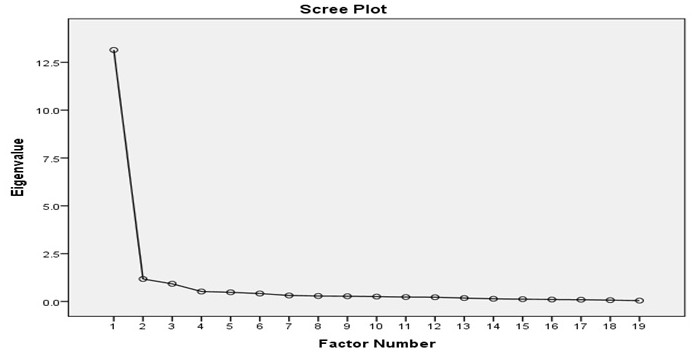
Table 9.3b: Pattern matrix for risk management and governance with new codes
The table 9.3b depicts the new latent clusters:
- Twelve items, RMG1, RMG2, RMG5, RMG6, RMG9, RMG10, RMG11, RMG12, RMG13, RMG14, RMG15, and RMG16, are highly reliable for they loaded onto the first latent cluster with Cronbach’s alpha of 0.97.
- Seven items, RMG3, RMG4, RMG7, RMG8, RMG17, RMG 18, and RMG19, are highly reliable for they have Cronbach’s alpha of 0.931.
In summary, the twelve items in the first latent cluster were coded into a new variable (RMGG1), whereas the seven items in the second latent cluster were coded into a new variable (RMGG2)
The interpretation of the (2) new latent clusters is provided below:
Risk Governance- RMGG1
Risk governance (RMGG1) is a new cluster emanating from 19 items in the questionnaire, which explains risk management and governance. It constitutes a single component with 12 factors, which are highly reliable in predicting the occurrence of risk governance in an organisation. Fundamentally, risk governance comprises regulations, rules, processes, conventions, and mechanisms that organisations employ in the management of risks. Stulz (2016) undertook a study in the banking industry and established that risk governance entails identification, measurement, aggregation, management, and monitoring of risks.
The establishment indicates that risk governance is a process that requires proficient coordination of operations and activities in line with the prevailing management practices. Organisations grapple with the challenge of identifying, measurement, and aggregation of risks for they operate in dynamic environments. Once they have assessed risks, risk managers design strategies and processes of preventing, eliminating, mitigating, and avoiding risks. For sustainable risk governance, organisations have to undertake a review of risks continuously.
The assessment of the items in the questionnaire reveals important themes in risk governance. The existence of a support system and formalised approach to risk governance enables organisations to manage risks appropriately. Moreover, the existence of stipulated rules and regulations and elaborate policies and code of conduct is essential for employees to perform their duties and roles diligently. As accountability is a management matter that determines ownership of responsibilities, risk managers have to ensure that there are relevant mechanisms and procedures for employees to adhere (Stulz 2016).
The existence of the internal auditing mechanism strengthens the capacity of risk managers to undertake risk governance. The auditing mechanism enables risk managers to streamline and synchronise their operations and activities in tandem with the dominant practices. In their study, Escuder-Bueno and Halpin (2016) found out that risk identification, evaluation, and prioritisation are crucial pillars that support risk governance in various organisations. The implication is that organisations ought to establish risk management process as the foundation of risk governance.
SG2 – Risk Control – RMGG2
As a new cluster, risk control (RMGG2) emanates from 19 items of risk management and governance. It constitutes a single component with seven factors that explain 4.57% of the variation in risk management and governance. Risk control is an elaborate process that organisations employ in managing risks. It entails operations and activities that organisations undertake in implementing interventions, monitoring of progress, identifying new risks, and the assessment of risk process efficacy. Risk managers deploy various strategies in risk control, which include avoidance of risk, prevention of loss, reduction of loss, separation from risks, duplication of resources, and diversification of organisational functions (Aven 2016).
The avoidance of risk is the most effective approach to risk control because it reduces the probability of a risk occurring to naught. The prevention and reduction of loss apply in instances where the occurrence of a risk is inevitable, and the only available option is to mitigate their occurrence and impacts. The separation and duplication is a strategy that allows managers to reduce risks and their impacts on organisations. Since risks have different impacts on various objectives or sections of organisations, diversification of projects minimises their impacts when they occur.
In the questionnaire, it is apparent that seven items highlight themes of risk control in risk governance framework. The existence of regulatory requirements is important in risk control for it provides a legal framework that supports interventions and practices of risk managers. Given that firms consist of stakeholders and the management teams, communication mechanisms is essential for it promotes the effectiveness of the decision-making process. Whistleblowing mechanism and fraud risk assessment are interventions to risk control that help in preventing corruption and supporting accountability among employees in an organisation.
The existence of a formal oversight authority such as the board of directors or risk management board ensures the implementation of strategies successfully (Lyons 2015). Risk control requires an oversight body to supervise and management operations and activities involved in the management of risks. Brustbauer (2016) avers that risk control is a strategy that enables small- and medium-sized enterprises to control risks and become competitive in global markets. Hence, risk control is an integral predictor of risk management and governance in modern organisations.
Factor Analysis for Review Risk Development and Decision
Table 9.4: Total variance explained for review risk development and decision
The extracted factors (1, 2, and 3) had eigenvalues of 7.085, 0.391, and 0.319 explaining 70.85%, 3.91%, and 3.19% of the variation in review risk development and decision correspondingly. The scree plot (Figure 9.4) confirms that the three extracted factors explain significant variation in review risk development and decision.
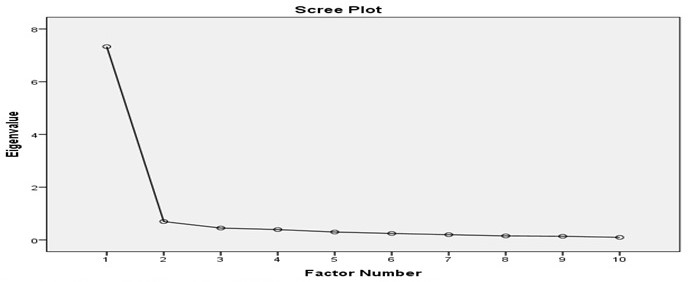
Table 9.4b: Pattern matrix for review risk development and decision
The pattern matrix (Table 9.4b) depicts how different items load onto three latent clusters based on their loadings. Out of the 10 items in RRD scale, RRD6 and RRD5 loaded onto the first latent cluster, RRD1, RRD3, and RRD2, loaded onto the second latent cluster, and RRD9, RRD10, and RRD8 loaded onto the third latent cluster.
Table 9.4c: Pattern matrix for review risk development and decision with new codes
In Table 9.4c:
- The first latent cluster has two items, RRD6 and RRD5, exhibiting an excellent level of the reliability with a Cronbach’s alpha of 9.24.
- The second latent cluster has three items, RRD1, RRD3, and RRD2, depicting a high level of the reliability with Cronbach’s alpha of 0.857.
- The third latent cluster has three items, RRD9, RRD10, and RRD10, showing an excellent level of the reliability.
As a summary, the two items in the first latent cluster were coded into a new variable (RDG1). The three items in the second latent cluster were coded into a new variable (RDG2), whereas those in the third latent cluster were coded into a new variable (RDG3).
The interpretation of the (3) new latent clusters is provided below:
Risk monitoring guidelines– RDG1
Risk monitoring guidelines (RDG1) is a new cluster extracted from 10 factors of risk review risk development and decision. It comprises one component with two factors, which are highly reliable in explaining review risk development and decision. The two factors explain 70.85% of the variation in risk development and decision. Risk monitoring guidelines offer procedures, processes, and principles of analysing, evaluating, and tracking risks in an organisation. As risks vary over time, risk monitoring is necessary for real-time assessment and management.
Scott et al. (2016) explain that the function of risk monitoring is to track the occurrence of risks and determine the efficacy of strategies that organisations deploy in risk management. According to Kaplan and Mikes (2016), risk monitoring guidelines direct risk managers to determine if risks have changed, interventions are still reliable, and previous assumptions apply. In risk monitoring, risk managers can undertake a continuous or re-assessment process to keep abreast with dynamic nature of risks in organisations.
Since risk monitoring is an active process, it entails identification and evaluation of risks for effective implementation of interventions. Essentially, risk-monitoring guidelines stipulate how risk managers identify and evaluate risks in their respective organisations. When risk managers identify risks and draft action plan for managing them, they apply monitoring process in checking and tracking the implementation process of interventions to guarantee efficacy and success. The monitoring process permits the collection of data for risk managers to analyse and generate essential information employed in risk management. Once there is an elaborate risk management plan, risk-monitoring guidelines arise to ensure that there is a meticulous implementation of risk interventions.
In a case analysis, Kaplan and Mikes (2016) found out that continuous monitoring of risk is an integral ingredient for effective management of risks. From the questionnaire, it is apparent that the two factors of risk monitoring entail the existence of the formal process of addressing risks and guidelines that define roles and responsibilities of risk managers. The formal process empowers risk managers to create action plans and manage risks effectively. Guidelines that define roles and responsibilities direct risk managers in their operations and activities aimed at handling risks meritoriously.
Risk effectiveness assurance – RDG2
Risk effectiveness assurance (RDG2) is the second novel cluster generated from ten items of review risk development and decision. It comprises three factors, which accounts for 3.91% of the variation in review risk development and decision. Risk effectiveness assurance is a method that allows risk managers to assess risks and determine the capacity of interventions to assure effectiveness. The ability of a response to be effective in the management of risks is dependent on the quality assurance standards established by organisations.
Davis (2017) explains that effective quality assurance in risk management is the one that considers dynamic changes in organisations and updates in standards. The board of directors ought to identify gaps in risk management, determine the capacity of the present interventions, and provide recommendations in a detailed report. In essence, the effectiveness of quality assurance determines how organisations response to diverse risks they encounter.
Risk effectiveness assurance is apparent in the questionnaire as different factors or items explain different themes, as exhibited in RRD1, RRD2, and RRD3. In the questionnaire, the apparent theme related to risk effectiveness assurance is the presence of the internal audit assurance. In assessing the role of audit committee, Haji and Anifowose (2016) found out that the internal assurance is significant to risk management because it empowers organizations to monitor and control their risks because they cause huge impacts. Owing to the dynamic nature of risks, the questionnaire captures the essence of an ongoing update of risk assessment.
Davis (2017) explains that continuous update of quality assurance standards is necessary to keep abreast with changing risks and interventions. Additionally, the external assurance is essential to complement the internal mechanism. An independent body should undertake the external assurance to avert biases, which would influence the assessment and management of risks. Therefore, risk effectiveness assurance is an indispensable element in risk governance for it promotes standards of quality assurance.
Monitoring of risk exposure – RDG3
As the third novel cluster derived from ten factors of RRD, monitoring of risk exposure (RDG3) is a vital variable in risk governance. RDG3 has three items, RRD8, RRD9, RRD10, which account for 3.19% of the variation in review risk development and decision. Fundamentally, monitoring of risk exposure is a continuous process of risk management. The main purpose of monitoring of risk exposure is to track identified risks, evaluate the existence of residual risks, and establish new risks (Bernklau 2016).
Risk monitoring is an active process throughout the lifetime of a project or organisations. Changes and the emergence of new forms of risks require risk managers to update processes and procedures utilized in risk management. In monitoring risk exposure, risk managers aim to determine if reviews of risks are up to date, there is compliance with risk management practices, and contingency reserves are adequate.
Risk monitoring entails numerous operations and activities involving risk management. Boubaker, Buchanan, and Nguyen (2016) categorise monitoring of risk exposure as identification, risk analysis, risk control, measurement, and communication. Since risks are dynamic, risk managers have a constant task of assessing and determining if new risks have emerged in various projects.
The identified risks need analysis to ascertain the degree of potential impacts and provide appropriate management interventions. For effective management of risks, control mechanisms are crucial for the sustainability of the risk management process. The management has to measure all risks align their impacts with available resources and interventions. Communication is an integral element in the monitoring of risk exposure for it enables risk managers to communicate their assessments and offer relevant mitigation measures.
In the questionnaire, various themes of monitoring of risk exposure are apparent. The existence of escalating process, management process, and documentation allows the management to monitor risks reliably. Thus, monitoring of risk exposure provides real-time information, which helps the management to make informed decisions on when to implement contingency plans, take corrective actions, and change project objectives.
Factor Analysis for Risk Communication
Table 9.5a: Total variance explained for risk communication
Factor analysis extracted three factors with eigenvalues of 6.909, 1.091, and 0.970, which accounted for 57.58%, 9.09%, and 8.08% of the variation in risk communication. The scree plot affirms that the three extracted factors are significant predictors of risk communication.
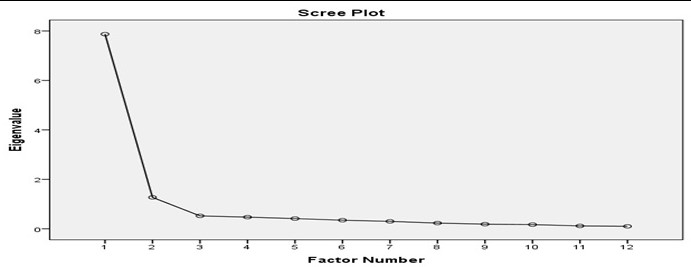
The pattern matrix shows that the items load into three latent clusters with different loadings. Five items, RC2, RC5, RC6, RC7, and RC8, loaded onto the first latent cluster, while four items, RC9, RC10, RC11, and RC12, loaded onto the second latent cluster. Three items, RC1, RC3, and RC4, loaded onto the third latent cluster.
Table 9.5c: Pattern matrix for risk communication with new codes
In Table 9.5c:
- Five items, RC2, RC3, RC6, RC7, and RC8, are reliable because their Cronbach’s alpha is excellent in the first latent cluster (0.932).
- Four items, RC9, RC10, and RC12, are reliable for their Cronbach’s alpha is superb in the second latent cluster (0.903).
- Three items, RC1, RC3, and RC4, are reliable for their Cronbach’s alpha is excellent in the third latent cluster (0.908).
Therefore, factor analysis of risk communication indicates that the fives items of the first latent cluster were coded into a new variable (RCG1), whereas the four variables of the second latent cluster were coded into a new variable (RCG2). The three variables of the third latent cluster were coded into a new variable (RCG3).
The interpretation of the (3) new latent clusters is provided below:
Risk Communication – RCG1
Risk communication (RCG) is a new cluster obtained from 12 items of risk communication. It forms a single component with five items that are highly reliable in predicting risk communication. Risk communication accounts for 57.58% of the explained variance by factor analysis. Risk communication entails sharing of information that is critical in the identification, assessment, and mitigation of risks. Since experts can identify, assess, and mitigate risks, they have to share information with various parties or stakeholders in organisations so that they can make informed choices regarding risk management strategies. The dynamic nature and the occurrence of risks require sustained communications to enhance the preparedness of parties involved in risk management.
Eriksson (2016) holds that risk communication boosts strategies for monitoring hazards and improves the sustainability of risk management. When risk managers undertake an accurate assessment of risks and communicate appropriate information, they obtain optimum support from an organisation. Thus, risk communication is an indispensable aspect of risk management that allows organisations to undertake accurate monitoring of risks and intervention measures.
Risk communication encompasses different aspects of risk management as reflected in the questionnaire. Transparency is an important feature of risk communication for it allows everyone in an organisation to access and utilise information in risk governance. Given that communication can occur haphazardly, risk communication should occur in a system where there are formal procedures that differentiate internal and external communication. Moreover, the communication channels ought to discriminate information depending on their uses in risk management. The external communication is beneficial for it boosts transparency and accountability in risk governance.
In risk management, assessment, monitoring, and reporting of risk analyses require effective communication. Arvai (2014) contends that risk communication is not a means of enlightening but a mechanism that supports enriching dialogue, which enables risk managers to access and utilise information in risk management. Thus, risk communication comprises mechanisms and processes that the management use in conveying and processing information.
Risk documentation – RCG2
Risk documentation (RCG2) is the second cluster generated from 12 factors of risk communication in risk governance. It constitutes four factors that form a single component, and they explain 9.10% of the variation in risk communication. Since risk management entails identification, assessment, and review of risks, it requires documentation to allow storage and utilisation of information in risk management. For instance, risk assessment document has detailed information about risks in organisations. Risks managers study risk assessment document so that they can design appropriate interventions and mitigation measures.
Risk documents act as sources of evidence for insurance companies and courts use them in determining liability. Proper risk documentation enables an organisation to get favourable premium rates of insurance and prevent costly lawsuits of negligence. In a documentary analysis, Higgins et al. (2016) noted that organisations differed in the way they analyse risks, undertake risk-assessment procedures, and implement risk management strategies. Through risk documentation, reviewers can determine the efficacy of risk-assessment methods and interventions.
The analysis of items that represent risks documentation shows that the existence of risk indicators report and aggregated risk exposure report are dominant themes. Risk documentation ought to have key risk indicators for they are essential in promoting monitoring and development of mitigation measures. In assessing project-based organisations, Khameneh, Taheri, and Erhadi (2016) concluded that risk reporting is one of the key performance indicators of risk management and performance. In essence, risk indicators report show trends of risks over time, which have influenced the capacity of organisations to achieve their project objectives.
By analysing risk indicators report, risk managers can predict the occurrence and impacts of risks on project objectives and outcomes. The assessment of risks generates aggregated risk report, which qualifies and quantifies risks in an organisation. An aggregated report forms the basis for designing and implementing evidence-based risk management strategies. Therefore, risk documentation is central to risk governance because it accumulates information that risk managers require to analyse and construct relevant and effective mitigation measures.
Risk Coordination – RCG3
Another new cluster of risk communication is risk coordination (RCG3). It comprises three items, which explains 8.08% of the variation in risk communication. These factors are highly reliable in predicting the extent of risk communication that happens in organisations. Given that risk management involves different levels of management ranging from the board at the top to operational management at the bottom, there is a need to coordinate processes for effective management of risks in organisations.
Lechner and Gudmundsson (2014) aver that risk coordination ensures synchronisation of operations and activities, resulting in optimised risk management. Risk management practices such as identification, assessment, and review of risks need well-organized coordination because they have concerted effects on risk management. According to Viscelli, Beasley, and Hermanson (2016), ERM is a system that allows organisations to coordinate risk management operations and activities for the board of directors can prioritise risks and launch appropriate responses to mitigate them. Therefore, the board of directors has a major role in coordinating ERM practices for effective and reliable management of risks in their organisations.
The existence of systems of risk management exhibits risk coordination in an organisation. From the questionnaire, risk communication is one of the factors that influence risk coordination. Communication promotes risk management because it allows risk managers to share vital information and design effective mitigation measures of risk. The existence of an elaborate communication mechanism within an organisation promotes risk management because the board of directors, managers, and employees can share information effortlessly.
Additionally, the existence of guidelines for coordinating operations and activities is a factor that reflects risk coordination in an organisation. In their study, Xu and Berry-Stolzle (2018) highlight that ERM is an efficient system of coordinating risks for it integrates numerous interventions and strategies. Through risk coordination, the management delegates their responsibilities to appointed risk managers who can implement strategies for risk management as outlined in risk guidelines.
Factor Analysis for Risk Culture
Table 9.6a: Total variance explained for risk culture
Factor analysis extracted three factors with eigenvalues greater than 0.5 from eight items that make up the scale of risk culture. The extracted factors, 1, 2, and 3, have eigenvalues of 3.646, 2.297, and 0.349, which accounted for 45.58%, 28.71%, and 4.37% of the variation in risk culture. The scree plot supports the extraction of the three factors for they have marked influence on the variation of risk culture.

Table 9.6b: Pattern matrix for risk culture
The pattern matrix demonstrates that three factors, RCU1, RCU4, and RCU6, load onto the first latent cluster, while another three factors, RCU2, RCU3, RCU8, load onto the second latent cluster. RCU5 loads onto the third factor with a very high loading value of 1.067 and will be shifter to first latent cluster.
Table 9.6c: Pattern matrix for risk culture with new codes
In Table 9.6c:
- Four items, RUC1, RCU4, RCU5, and RCU6, are moderately reliable for they have Cronbach’s alpha of 0.880.
- Three items, RCU2, RCU3, and RCU8, are moderately reliable because they have Cronbach’s alpha of 0.891
In summary, four items, RUC1, RCU4, RCU5, and RCU6, were coded into a new variable (RCUG1), while the three items, RCU2, RCU3, and RCU8 were coded into a new variable (RCUG2).
The interpretation of the (2) new latent clusters is provided below:
Risk culture development – RCUG1
Risk culture development (RCUG1) consists of the first and the third components derived from eight factors of risk culture. The first component comprises three factors, while the third component encompasses one component, which explains 45.58% and 4.37% of the variation in risk culture respectively. Like in organisational culture, shared values, beliefs, principles, attitudes, goals, and practices determine the formation and the development of risk culture in organisations. Risk culture plays a central role in risk management and governance because it shapes processes, procedures, principles, and values in organisations.
Risk culture development involves the growth of a culture that supports risk management and governance. The Institute of Risk Management has elucidated risk culture as a product of interrelationship of personal ethics, behaviours, and organisational culture (Chapman 2014). For risk culture to develop, organisations ought to define their principles, guidelines, roles, and regulations employed in the management of risks. To attain commendable risk culture, risk managers must educate employees on the essence of developing risk culture in their organisations.
The scrutiny of items in the questionnaire that predict risk culture shows that several factors contribute to the development of risk culture. The existence of guidelines for promoting accountability in risk management is necessary. By following established guidelines and applying them in risk management continually, risk managers reinforce accountability and create a culture of compliance.
The questionnaire also reveals that training of employees and the board of directors is essential for the robust and extensive development of risk culture. Training boosts dissemination of guidelines and creates synergy in the implementation of strategies and interventions deployed in risk management. Ring et al. (2014) observe that lessons derived from regulatory notices enable organisations to strengthen their risk culture and manage risks efficiently. The existence of audit process, empowering programs, and guidelines for fostering risk management are integral to the development of risk culture.
Risk culture awareness – RCUG2
Risk culture awareness (RCUG2) is the second component derived from eight factors that cover risk culture. It constitutes three factors, which account for 28.71% of the variation in risk culture. Risk culture awareness involves the understanding of roles, regulations, and guidelines that organisations employ in risk management. In the development risk culture, the building of awareness is the first step. Risk managers cannot develop risk culture in their organisations without creating awareness among employees.
Organisations create risk culture awareness through communication and training of employees to understand various guidelines and practices of risk management. Effective strategies for building awareness entail the delivery of risk communication, the definition of roles and responsibilities, the performance of risk management, and the review of risk guidelines (Arras 2016). Thus, risk culture awareness forms the basis of the development of risk culture.
The analysis of questionnaire provides significant insights relating to risk culture awareness themes in organisations. The questionnaire notes the existence of awareness program for it aids in the development of risk awareness. Besides, the internal audit system should have guidelines, which stipulate how organisations acquire and develop risk culture. Risk guidelines aids in the creation of uniform interventions and strategies employed in risk management.
Evidently, ERM provides a framework through which the management integrates various aspects of risk management such as identification, evaluation, and review of risks. The implementation of ERM improves risk awareness in organisations and boost performance (Frigo 2018). As cases of fraud occur in organisations, employees should be aware of ethical guidelines for effective deterrence and prevention.
Factor Analysis for Risk Appetite
Table 9.7a: Total variance explained for risk appetite
Factor analysis extracted three factors with eigenvalues of 6.811, 0.880, and 0.229, which accounted for 75.68%, 9.78%, and 2.55% of the variation in risk appetite in that order. The scree plot below endorses that the three extracted factors have a significant influence on the risk appetite.
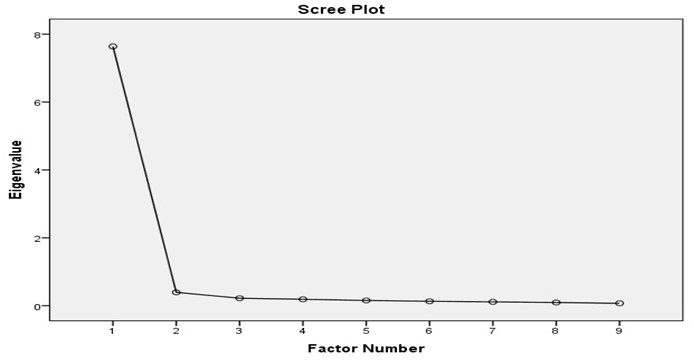
The pattern matrix (Table 9.7b) shows that four items, RA1, RA2, RA4, and RA4, loaded onto the first latent cluster with high loadings. Subsequent four items, RA5, RA6, RA7, and RA9, loaded onto the second latent cluster, whereas RA8 is the only factor that loaded onto the third factor with a significant loading value. Thus, pattern matrix for new code included RA8 into the second latent cluster, as demonstrated in Table 9.7c.
Table 9.7b: Pattern matrix for risk appetite
Table 9.7c: Pattern matrix for risk appetite with new codes
In Table 9.7c:
- Four items, RA1, RA2, RA3, and RA4, loaded onto the first latent cluster with Cronbach’s alpha of 0.960 indicating an excellent reliability.
- Five items, RA5, RA6, RA7, RA8, and RA9, loaded onto the second latent cluster with Cronbach’s alpha of 0.967 also showing an excellent reliability.
Overall, the four items, RA1, RA2, RA3, and RA4, loaded onto the first latent cluster and created a new variable (RAG1), whereas the five items, RA5, RA6, RA7, RA8, and RA9, loaded onto the second latent cluster and formed a new variable (RAG2).
The interpretation of the (2) new latent clusters is provided below:
Risk Appetite – RAG1
Risk appetite (RAG1) is a novel cluster extracted from nine items of risk appetite in risk governance. It is the first component with four factors, which are not only reliable but also explain 75.68% of the variance in risk appetite. Risk appetite is a parameter that measures the capacity of an organisation to tolerate a certain level of risk without experiencing significant impacts on its objectives and goals. Organisations with a high level of risk appetite can overcome considerable impacts of risks, while organisations with low risk appetite cannot tolerate minor risks that they experience (Kaplan & Mikes 2016).
Normally, organisations perform risk assessment and determine their ability to bear different forms of risks. Essentially, risk assessment report allows risk managers to design and implement strategies and interventions, which would boost risk appetite, and thus, cushion organisations from the effects of most risks.
The questionnaire supports the existence of risk appetite in risk governance. Risk appetite framework is the foundation of risk assessment because risk managers can utilize it in drafting guidelines and interventions employed in risk management. Moreover, the existence of a defined risk appetite statement aids in the establishment of a robust risk appetite framework, which is critical in the assessment of risk appetite (Baldan, Geretto & Zen 2016).
The existence of mechanism of comprehending the degree of risk is necessary in determining risk appetite of an organisation. Due to the dynamic nature of risks, an elaborate review mechanism for periodic assessment appetite limits is necessary. Thus, risk managers need guidelines for risk assessment and review to ascertain risk appetite in organisations.
Risk appetite alignment process – RAG2
Risk appetite alignment process (RAG2) is the cluster component generated from nine factors of risk appetite. It contains the second and the third components with four factors and one factor respectively. The first component and the second component account for 9.78% and 2.55% of the variances in risk appetite respectively. Risk appetite alignment is a novel approach that modern organisations have developed and perfected in risk management. It entails alignment of risk appetite with risks, strategies, interventions, and activities of risk management.
Proper alignment of risk appetite is beneficial to organisations because it promotes the achievement of strategic goals and reduces residual risks. According to risk-based performance, organisations align their risk appetite by defining strategic goals, assessing appetite, identifying risks, reviewing appetite, conducting a risk assessment, aligning appetite with established risks (Nahar, Jubb & Azim 2016). Hence, such a process of risk appetite alignment provides an opportunity for review of risks and reassessment of appetite.
The scrutiny of questionnaire shows important patterns of themes, which describes risk appetite process in risk governance. The questionnaire recognises that risks are dynamic, and thus, it suggests the existence of frequent reassessments of risk appetite to align with the prevailing changes of strategic goals of organisations. For guidelines are drivers of risk management in an organisation, risk alignment should consider optimising the interactions of business activities and the management.
An effective interaction creates a favorable environment for risk management and alignment of risk appetites with organizational goals and objectives (Nahar, Jubb & Azim 2016). Constant reporting of the degree of risk appetite enhances the responsive capacity of organizations by alerting and preparing them. The existence of established frameworks such as ERM and risk-based performance aids in the integration risk appetite in performance.
Factor Analysis for Risk Based Audit and Project Success
Table 9.8a: Total variance explained for risk governance
The extracted factors, 1, 2, and 3, have eigenvalues of 20.017, 0.749, and 0.562, which accounted for 71.49%, 2.68%, and 2.01% of the variation in risk governance correspondingly. The scree plot demonstrates that the three factors extracted accounted for a significant variation in risk governance.
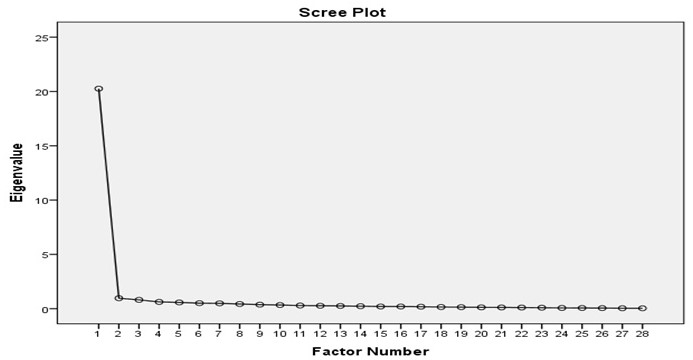
Table 9.8b: Pattern matrix for risk governance and project success
Pattern matrix demonstrates that RG10 has the highest loading value (0.816) while RG2 has the lowest loading value (0.471) in the first latent cluster with 11 items. In the second latent cluster with seven items, RG26 has the highest loading value (0.768), while RG27 has the lowest loading value (0.485). RG4 has the highest loading value of 0.866, whereas RG2 has the lowest loading value of 0.486.
Table 9.8c: Pattern matrix for risk governance and project success with new codes
In Table 9.8c:
- The 11 items, RG1, RG8, RG9, RG10, RG11, RG12, RG13, RG14, RG15, RG16, and RG18, loaded onto the first latent cluster with an excellent level of reliability (Cronbach’s alpha = 0.969).
- The seven items, RG20, RG21, RG22, RG24, RG25, RG26, and RG27, loaded on the second latent cluster with an excellent reliability index of 0.956.
- The five items, RG2, RG4, RG5, RG6, and RG23, have a superb reliability level for they have Cronbach’s alpha of 0.945.
In summary, the 11 items from the risk governance scale, RG1, RG8, RG9, RG10, RG11, RG12, RG13, RG14, RG15, RG16, and RG18, formed a new latent variable (RGP1). Likewise, the seven items, RG20, RG21, RG22, RG24, RG25, RG26, and RG27, formed a new latent variable (RGP2). The five items, RG2, RG4, RG5, RG6, and RG23, created a new latent variable (RGP3).
The interpretation of the (3) new latent clusters is provided below:
Efficient project delivery – RGP1
Efficient project delivery (RGP1) is a new cluster derived from 28 items of risk governance. It consists of 11 items that are highly reliable for they explain 71.49% of the variation in risk governance. Primarily, risk governance is the core of risk management for it involves institutions, policies, rules, regulations, practices, processes, and procedures that management utilizes in making strategic decisions aimed at improving organizational performance and alleviating risks. Moreover, it constitutes frameworks, models, and systems that stipulate mechanism and define boundaries of organizational operations and activities.
Viscelli, Beasley, and Hermanson (2016) place the responsibility of risk governance on the board for it can create, fund, and implement interventions of risks management. Risk governance enables organizations to assess risks, determine risk appetites, and align strategic operations to guarantee performance.
The conceptualization of risk governance in relation to the successfulness of projects offers critical insights necessary for effective management of risks. The achievement of strategic objectives is an outstanding aspect of risk governance because risk managers focus on attaining expectations of projects.
In their study, Stein and Wiedemann (2016) assert that risk governance acts as a bridge that links risk management and corporate governance to optimize outcomes. Evidently, risk governance is valuable to organizations because it boosts the efficiency of operations, prevents the occurrence of crises, saves costs in the delivery of projects, and streamlines processes.
Efficient risk monitoring – RGP2
This cluster is derived from 7 items of risk-based audit processes, that is, RG20, RG21, RG22, RG24, RG25, RG26, and RG27, and it is consistent with the literature on continuous risk monitoring in which it is regarded as critical in addressing and auditing project risks. It explains 2.68 % of the variance in risk-based audit and project success by factor analysis. Risk monitoring is the real-time assessment of an enterprise’s risk status using a set of key risk indicators to prioritize audit procedures.
Studies consider continuous risk monitoring a core element of a dynamic auditing process. For example, Bumgarner and Vasarhelyi (2014) consider it a systematic approach to risk evaluation and audit planning that supports the detection of shifts in an organization’s risk profile for effective governance. They further highlight the significance of risk monitoring; it enables auditors to populate risk assessments and auditing with new data to support risk management. Given the changing nature of risks, auditors have to continually evaluate and monitor risks to relate them to risk auditing and management.
From the questionnaire, risk monitoring captures different aspects and outcomes of a well-designed risk-based auditing process. The adoption of risk monitoring using KRIs would help uncover emerging risks in a real-time manner. In a study, Moon (2016) supports the principles of accountability, adequate identification of risk appetites, prudent financial resource utilization, better management of stakeholder expectations, and improved strategic plan execution at board level. A risk-based auditor evaluates and identifies areas of potential risk impacts through relevant KRIs to ensure timely mitigation.
Thus, periodic audit processes may not be consistent with the principles of the risk-based auditing. It should be recursive and based on continuous risk monitoring to respond to changes in an entity’s risk status throughout a business cycle.
Effective project risk management – RGP3
This cluster was formed from five items RG2, RG4, RG5, RG6, and RG23, which predict the success of projects. Effective project risk management accounts for 2.01% of the explained variance through factor analysis. This research corroborates the findings of related studies on the influence of risk-based audit processes on project success. It is understood from the literature that risk-based auditing connects the internal audit function to the firm’s risk governance strategy, assuring the management that project risk management is aligned to the defined risk appetite (Moon 2016). Risk-based auditing assures the board – an organ bearing the ultimate responsibility for risk identification and management – that the risks are being managed effectively.
The specific components of effective risk management in projects, as identified in the questionnaire, include timely and on-budget delivery, board-level reporting of consolidated and key risks, and risk identification and sharing across departments. Raydugin (2016) holds that project management allows managers to “identify, assess, and control” key risks at corporate and project level, which tend to be similar across departments (p. 295). For this reason, organisations adopt integrated risk management frameworks, such as ERM, to strengthen their risk culture – identification, assessment, and management capabilities.
Multiple reporting of project risks to the chief financial officer who sits at the board can help avoid the management of risks in silos and enhance the involvement of project managers in the planning and execution of risk management activities to mitigate risks and capitalize on opportunities (Raydugin 2016). At this point, the firm should utilise internal auditing to add value to the portfolio of project risk management. Thus, from the literature, effective project risk management supports strategic decisions through consolidated risk identification, reporting, and sharing across departments, and informed resource allocation.
Factor Analysis for Occurrence of Negative Events
Table 9.9a: Total variance explained for impacts of negative events
The extracted factors, 1, 2, and 3, have eigenvalues of 4.252, 1.830, and 1.068, which account for 42.52%, 18.30%, and 10.68% of the variation in impacts of negative events. However, the scree plot indicates that five factors significantly influence impacts of negative events on projects.
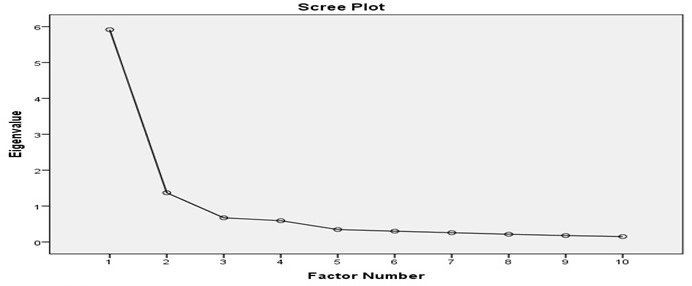
Table 9.9b: Pattern matrix for impact of negative events
The pattern matrix shows that four items, IN3, IN5, IN7, and IN9, loaded onto the first latent cluster, whereas another four items, IN1, IN2, IN4, and IN6, loaded onto the second latent cluster. Two items, IN8 and IN10, loaded onto the third latent cluster with loadings of 0.973 and 0.492 respectively.
Table 9.9c: Pattern matrix for impacts of negative events for new codes
In Table 9.9c:
- Latent cluster 1 has five items, IN3, IN5, IN7, IN8, and IN9, with an excellent reliability because the Cronbach’s alpha is 0.919.
- Latent cluster 2 has five items, IN1, IN2, IN4, IN6, and IN10, with a high reliability index of 0.861.
In summary, factor analysis created two new latent variables from 10 items on impacts of negative events. The five items, IN3, IN5, IN7, IN8, and IN9, formed INP1 as a new latent variable, while the remaining five items, IN1, IN2, IN4, IN6, and IN10, created INP2 as a new latent variable.
The interpretation of the (2) new latent clusters is provided below:
Governance Failure – INP1
Governance failure is a new cluster derived from five questionnaire items, that is, IN3, IN5, IN7, IN8, and IN9, associated with negative project impact. This cluster explains 42.52% of the variance determined through factor analysis. This finding is supported by the literature, where it is established that risk management failures result in the omission of opportunities and inability to meet strategic objectives (Fadun 2013). Since risk permeates all organisations and departments, integrated risk management can enhance the predictability of risks and enable them to take advantage of opportunities.
However, in most firms, traditional models of risk governance that categorises and manages risks as separate entities are common, increasing the likelihood of governance failure. The major downside of this model is its narrow focus on organisational risks, as opposed to a holistic view of uncertainties and possible opportunities.
Risk governance failure could stem from various pitfalls as reflected in the questionnaire. Precisely, deficient control over project phases, deficient governance model, the absence of independent monitoring and board-level reporting, and inability to meet strategic objectives are linked to unsuccessful risk management. Fedun (2013) extends this list further by identifying three reasons why risk governance systems fail.
First, agency risk, which describes the inadvertent or obstinate neglect of risk mitigation procedures of the firm by staff, can contribute to failure. Second, the dynamic nature of systematic risks related to the economic forces makes them inevitable in a business context. Thirdly, flaws in risk management processes may lead accumulate over time and cause governance failure. In this view, there is need to perform a regular review of an organisation’s risk management framework to recognise and address possible deficiencies on time.
Project failure – INP2
Project failure is the second new cluster created from five items (IN1, IN2, IN4, IN6, and IN10). It captures the adverse events occurring in organisations that impact negatively on projects. This cluster accounts for 18.30% of the variance in the occurrence of negative events. Project implementation often comes with the pressure to stay on budget and deliver within the expected timelines. From the questionnaire, delays in schedules, cost overrun, project failure history, unresolved disputes, and opportunity costs related to implementing wrong projects are the key factors contributing to failed projects.
As Cagliano, Grimaldi, and Rafele (2015) note, the movement between project phases comes with a certain level of uncertainty. Therefore, the risk management approach should be flexible to accommodate unique threats inherent in each stage. In addition, the techniques selected must support corporate maturity towards the various threats that evolve during the project lifecycle.
Errors committed by the project manager or teams also contribute to project failure. Fedun (2013) states that individual or corporate “risk attitude, risk culture, and risk appetite” influence staff perception of risks and opportunities (p. 233). The management’s position on acceptable risks would depend on the organisation’s perception of threats. Thus, a poor risk attitude could adversely affect project objectives. In addition, the way people perceive or interpret risk determines how they will manage potential project risks.
In essence, the factors identified in the questionnaire – schedule delays, cost overruns, failure history, etc. – reflect the risk culture of the organisation. The prevalent attitudes and values about threats would determine how managers and staff perceive and respond to risks. Additionally, the risk appetite would depend on how risk-taking behaviour is rewarded in the organization (Fedun 2013). Thus, project failure can be avoided by inculcating the right risk attitudes, culture, and appetite.
Factor Analysis for Internal Audit Function
Table 9.10a: Total variance explained for the internal audit function
The extracted factors, 1, 2, and 3, have eigenvalues of 3.301, 3.065, and 1.623, which explained 30.00%, 57.87%, and 14.76% of the variation in the internal audit function. The scree plot indicates that five items in the scale are significant in explaining the variation in the internal audit function.
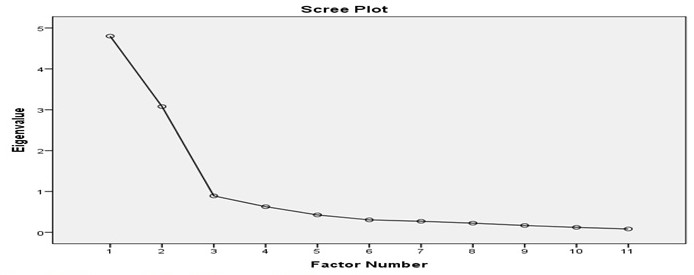
Table 9.10b: Pattern matrix for the internal audit function
The pattern matrix illustrates that four items, IAF1, IAF2, IAF3, and IAF4, loaded onto the first latent cluster with the highest eigenvalue being 0.966. Another four items, IAF5, IAF8, IAF10, and IAF11, loaded onto the second latent cluster with the highest eigenvalue being 0.964. Two factors, IAF7 and IAF6, loaded onto the third latent cluster with eigenvalues of 0.954 and 0.551 respectively.
Table 9.10c: Pattern matrix for the internal audit function with new codes
In Table 9.10c:
- Four items, IAF1, IAF2, IAF3, and IAF4, loaded onto the first latent cluster with have a superb reliability for they have Cronbach’s alpha of 0.901.
- Four items, IAF8, IAF9, IAF10, and IAF11, loaded onto the second latent cluster with an excellent reliability index of 0.935.
- Two items, IAF7 and IAF6, loaded onto the third latent cluster with an excellent reliability index of 0.905.
In recap, factor analysis created three new latent variables, IAFR1, UAFR2, and IAFR3, from 11 items in the scale. The four items, IAF1, IAF2, IAF3, and IAF4, formed IAFR1 as a new latent code, whereas other four items, IAF8, IAF9, IAF10, and IAF11, created IAFR2 as a new latent code. The two variables, IAF6 and IAF7, created IAFR3 as a new latent code.
The interpretation of the (3) new latent clusters is provided below:
Role of Internal Audit – IAFR1
This new cluster is derived from four items, that is, IAF1, IAF2, IAF3, and IAF4, of the internal audit function. It constitutes a fundamental aggregate component predicting the significance of auditing in risk management in organizations. The role of internal audit accounts for 30.01% of the variance as determined through factor analysis. In most firms, board directions on risk management are delivered via the audit committee – the unit around which all audit activities coalesce.
Ravindran et al. (2015) outline three functions of internal auditing in risk management: assurance, consultative, and facilitative roles. This activity entails a systematic assessment and response to risk control issues to strengthen the risk governance process. It incorporates accounting controls that support financial reporting and accountability (Ravindran et al. 2015).
The roles investigated through the questionnaire are consistent with the tasks of the internal auditing identified in the literature. The main purpose of this department is to give objective assurance to the board regarding the efficiency of the risk governance process, that is, risks are well managed, and internal controls are working (Florea & Florea 2016). Internal auditing can also act as a catalyst for the creation of a formal risk management program. The internal auditor, given his/her knowledge of risks, can champion for enhanced ERM capabilities in the firm. Thus, he/she can give advice and consultancy services that can bolster the company’s risk management and control procedures (Florea & Florea 2016).
However, resource availability and the level of risk maturity in the enterprise may limit the consulting role. Another critical obligation of internal auditors is facilitation. This role entails giving technical expertise, project coordination, and providing documentation controls to facilitate risk management.
Auditing of Risk Governance Function – IAFR2
This second cluster is created from five items, namely, IAF8, IAF9, IAF10, and IAF11. Auditing of the risk governance function can reliably predict audit functions involved in the management of risks in organizations. This cluster explains 27.86% of the variance obtained through factor analysis. The internal auditing function is primarily an assurance provider. Its independence and objectivity are ensured when it is not involved in the risk management process (Ravindran et al. 2015).
However, from a business point of view, this unit may be integrated into formal risk management. Internal auditors may participate in setting the organisation’s risk appetite, developing the risk management policy and strategy, and implementing risk responses on behalf of the management. Therefore, linking internal auditing to risk management may create additional value for the organisation if there are adequate safeguards in place to preserve the objectivity of this function.
The auditing of risk governance activities requires collaborative practices to realize greater value for the firm. It entails tying audit plans to ERM to facilitate information sharing and avoid role duplication (Ravindran et al. 2015). Thus, the internal auditor, risk committee, and the team involved in the management of strategic risks and controls should collaborate in auditing the risk management framework.
As Moon (2016) observes, in the current business environment, internal auditing primarily provides assurance that strengthens corporate governance. This function not only augments accounting management, but also assures the ERM process and supports the assessment of enterprise operations (Moon 2016). Therefore, internal auditing is a powerful tool for strengthening an organization’s control environment and aligning audit objectives with risk management goals.
Provision of Audit Reports – IAFR3
This cluster is formed from two items assessing the internal audit function’s role in overseeing risk management, which include IAF6 and IAF7. This cluster accounts for 14.76% of the explained variance in this factor. The findings of this research are consistent with those of other studies on this subject. Audit reports give information about risks for which assurance and consultancy were given through the auditing of the risk governance procedures and responses (Benli & Celayir 2014).
Reporting also gives details of the effects of resource constraints and the uncovered risks. The questionnaire focused on the assurance function of auditing, such as audit reports on the management of key risks and entity-wide risk management process. Reporting is required to reinforce the board’s ownership of risk governance. Audit findings help elicit a discussion on how management can assume responsibility for all threats included in the risk register (Pritchard 2015). Therefore, internal auditors would need to develop and deliver regular reports to the audit committee during a project lifecycle.
The findings may influence the conclusions on ERM efficacy and capacity to meet the organization’s strategic objectives. The report should provide an opinion on the effectiveness of the current risk management process in the context of the firm’s strategic objectives. Ruse, Susmanschi, and Daneci-Patrau (2014) write that a continuous risk monitoring and assessment (CRMA) approach to auditing that allows internal auditors to report to the audit committee and the management on enterprise-wide risks to allow the prioritization of risk responses.
In addition, significant business risks are identified in audit reports to support board decisions and remedial actions. The CRMA approach allows the management to understand and respond to the firm’s dynamic risks and determine the efficacy of the RM controls.
Summary
Preliminary analysis of the 10 scales in the questionnaire, namely, S, RAI, RMG, RRD, RC, RCU, RA, RG, IN, and IAF, shows that they have adequate sample as KMO statistics are greater than 0.8 and significant Bartlett’s test (p = 0.000) showing dissimilarity with the identity matrix. Factor analysis of RRD (10 items), RC (12 items), RG (28 items), and IAF (11 items) extracted three latent clusters from each scale, which created three new latent variables with a high level of the internal consistency. Comparatively, factor analysis of S (9 items), RIA (10 items), RCU (8 items), RA (9 items), and IN (10 items) extracted three latent clusters from each scale, but it created two new latent codes for each. Factor analysis of RMG (19 items) extracted two latent clusters and used them in creating two new latent codes.
Analysis of Variance
Introduction
Analysis of variance (ANOVA) is a statistical method that evaluates the potential differences among a group of means (Urdan 2017). The dependent variable is often at the scale-level, whereas the independent variable is at the nominal-level and may have two or more categories. The purpose of this chapter is to provide a brief literature review of ANOVA and present the findings of ANOVA testing about whether there is a relationship between respondents’ views on various management issues based on job levels.
According to Pyrczak (2016), the ANOVA test was developed in 1918 by Ronald Fisher. It is an extension of the t and the z test whose limitation is the inability to tackle nominal level variables with two categories. This test may also be referred to as the Fisher analysis of variance (Rouder et al. 2016). Since its inception, ANOVA has found widespread use among students and researchers. The research design often determines the use of ANOVA. Three ways of ANOVA are possible: one-way ANOVA, two-way ANOVA, and N-way ANOVA (Roberts & Russo 2014).
A one-way ANOVA is applied when there is only one independent variable. For example, one-way ANOVA can be used to examine the math scores of high school students in a school district. On the other hand, a two-way ANOVA is performed when there is a need to compare two independent variables (Curtis et al. 2015). Expanding the initial example provided, a two-way ANOVA can assess the differences in math scores (the dependent variable) by the school (the first independent variable) and gender (the second independent variable).
Consequently, it is possible to study the connection between the two independent variables by looking at interactions. Interactions reveal the uneven distribution of variation across all groups of the independent variables. For instance, males may have higher math scores overall compared to females. However, this difference could be greater in private schools than public schools. Another term used to identify two-way ANOVA is factorial ANOVA. Complex studies may compel a researcher to use more than two dependent variables. In this case, an N-way ANOVA is used, where N refers to the number of independent variables (Roberts & Russo 2014). For example, the math scores of high school students can be assessed by the school, gender, ethnicity, and age simultaneously.
Since ANOVA entails comparing means, there is a need to formulate null and alternative hypotheses. The standard null hypothesis for an ANOVA test is that there is no significant difference among groups (Curtis et al. 2015). The alternative hypothesis, conversely, assumes that at least one significant difference exists among the groups.
After formulating the hypotheses, the researcher should test the assumptions of ANOVA. The next step entails computing the F-ratio and the related probability value, which is referred to as the p-value. The null hypothesis is rejected if the p-value linked to the F is smaller than the established level of significance, which could be 0.05 or 0.01. Rejecting the null hypothesis implies that the alternative hypothesis is supported and that the means of all the groups are unequal.
Subsequently, the researcher needs to conduct post hoc tests to identify the groups that differ from each other. Post hoc tests are t-tests that analyse mean differences between groups. Several post hoc tests exist, including Dunnet, Scheffe, Bonferroni, and Tukey tests (Kucuk et al. 2016). These tests reduce the chances of type I errors, which is the erroneous rejection of the null hypothesis (Kucuk et al. 2016).
Two main factors are used to determine whether ANOVA is suitable for analysis. The first factor is the level of measurement of the variables. The dependent variable must be a continuous level of measurement, which could be interval or ratio). On the other hand, the independent variables must be categorical, which could be nominal or ordinal. Since ANOVA is a parametric test, it is guided by three assumptions and has some assumptions. The first assumption is that the data are normally distributed. The second assumption of ANOVA is that the variances are homogeneous. This assumption implies that the variance between the groups should be more or less equal.
The third assumption of ANOVA is that the observations are independent of each other. Various tests can be used to test these assumptions. For example, Levene’s test or the Brown-Forsythe Test can be used to test the assumption of homogeneity of variance. Similarly, the normality of the distribution can be tested using skewness and kurtosis, histograms, and tests such as the Kolmogorov-Smirnov or Shapiro-Wilk (Roberts & Russo 2014). The study design is useful in determining the assumption of independence. Nevertheless, researchers should be cautious and keep an eye open for irrelevant or confounding variables.
The main strength of ANOVA as a method of data analysis is that it is a robust procedure regarding contraventions of the assumption of normality. Literature published in the 1950s and earlier stated that the F-tests used in ANOVA were not robust following contraventions of the assumption that the populations of the variables follow a normal distribution, especially for unbalanced scenarios and small alpha (α) levels (Field & Wilcox 2017). It was also believed that violating the assumption of equal variances led to drastic type I errors.
However, studies conducted by Donaldson in the 1960s revealed that the F-test was conservative despite small divergences from the assumptions of equal variance and normality, which did not affect the overall significance substantially (Field & Wilcox 2017). Additionally, these effects reduce with an increase in the sample size. This realization has increased the popularity of ANOVA as a statistical method of analysis.
Research Hypotheses
Based on the principles and assumptions of ANOVA as explained in the above sub-section, the researcher formulated the hypotheses indicated in Table 10.1. The hypotheses were grouped based on the four main factors being investigated. The details of each analysis are explained in the following sections.
Table 10.1. Table of research hypotheses
Analysis of Variance of Determinants of Risk Governance Framework
Analysis using ANOVA was performed to determine if there were any significant differences between the respondent’s perceptions of determinants of risk governance framework factors. A total of 10 factors were tested, including “Strategy”, “Risk Appraisal and Insight”, “Risk Decision and Process Implementation”, “Risk Management and Governance”, “Review Risk Development and Decision”, “Risk Communication”, “Risk Culture”, “Financial and Technical Capacity”, “Risk Appetite”, and “Risk Ownership” between 3 groups based on their job levels (employee, middle management, and top management).. An ANOVA analysis was conducted to justify the statistical differences of the groups’ responses in each category. The hypothesis test was computed using SPSS software at a significance level of 0.05. The F-statistic and the p-values were observed.
Analysis of Variance of Strategy Audit Process
Respondents were asked to respond to 9 items by indicating the likelihood of the existence of those factors in their organization. The results indicated in Table 1 in Appendix A under the column ‘Sig.’ show p-values greater than 0.05 for the 9 factors tested. Therefore, there was no significant difference between respondents’ perceptions of strategy. Therefore, the H0 hypothesis was accepted for the causes of variation related to strategy. In this case, there was no need for further tests to determine the difference in specific means between the respondents.
Analysis of Variance of Risk Appraisal and Insight Audit Process
Respondents were asked to respond to 10 items by indicating the likelihood of the existence of those factors in their organization. The results indicated in Table 2 in Appendix A under the column ‘Sig.’ show p-values greater than 0.05 for the 10 factors tested. Therefore, there was no significant difference between respondents’ perceptions of risk appraisal and insight based on job levels. Therefore, the H0 hypothesis was accepted for the causes of variation related to risk appraisal and insight. In this case, there was no need for further tests to determine the difference in specific means between the respondents.
Analysis of Variance of Risk Decision and Process Implementation Audit
Respondents were asked to respond to 4 items by indicating the likelihood of the existence of those factors in their organization. The results indicated in Table 3 in Appendix A under the column ‘Sig.’ show p-values greater than 0.05 for the 4 factors tested. Therefore, there was no significant difference between respondents’ perceptions of risk decision and process implementation based on job levels. Therefore, the H0 hypothesis was accepted for the causes of variation related to risk decision and process implementation. In this case, there was no need for further tests to determine the difference in specific means between the respondents.
Analysis of Variance of Risk Management and Governance Audit Process
Respondents were asked to respond to 19 items by indicating the likelihood of the existence of those factors in their organization. The results indicated Table 4 in Appendix A under the column ‘Sig.’ show p-values greater than 0.05 for the 19 factors tested. Therefore, there was no significant difference between respondents’ perceptions of risk management and governance based on job levels. Therefore, the H0 hypothesis was accepted for the causes of variation related to risk management and governance. In this case, there was no need for further tests to determine the difference in specific means between the respondents.
Analysis of Variance of Review Risk Development and Decision Audit Process
Respondents were asked to respond to 10 items by indicating the likelihood of the existence of those factors in their organization. The results indicated Table 5 in Appendix A under the column ‘Sig.’ show p-values greater than 0.05 for the 10 factors tested. Therefore, there was no significant difference between respondents’ perceptions of review risk development and decision based on job levels. Therefore, the H0 hypothesis was accepted for the causes of variation related to review risk development and decision. In this case, there was no need for further tests to determine the difference in specific means between the respondents.
Analysis of Variance of Risk Communication Audit Process
Respondents were asked to respond to 12 items by indicating the likelihood of the existence of those factors in their organization. The results indicated Table 6 in Appendix A under the column ‘Sig.’ show p-values greater than 0.05 for the 12 factors tested. Therefore, there was no significant difference between respondents’ perceptions of risk communication based on job levels. Therefore, the H0 hypothesis was accepted for the causes of variation related to risk communication. In this case, there was no need for further tests to determine the difference in specific means between the respondents.
Analysis of Variance of Risk Culture Audit Process
Respondents were asked to respond to 8 items by indicating the likelihood of the existence of those factors in their organization. As shown in Table 10.2, 2 out of 8 factors tested showed significant differences between respondents’ perceptions of risk culture Audit process variation based on job levels. Thus, the null hypothesis was refuted. To find out the statistical difference between the views of respondents about factor RCU5 “existence of a process for risk culture audit”, the results in Table 10.2 showed that F = 3.636 with a p-value = 0.030. With regard to factor RCU8 “existence of formal training of fraud risk awareness and ethical culture”, the result in Table 10.2 showed that F = 3.338 with p = 0.040, which was lower than the previous factor. The findings on the remaining 6 factors that were insignificant are included in Table 7 of Appendix A.
Table 10.2. ANOVA test for risk culture audit process variation factors related to the job level
Additional examination of the Tukey HSD post hoc multiple comparison tests with regard to factor RCU5 showed that there was a significant difference in the views of employees and top management (p = 0.023) regarding the existence of a process for risk culture audit in the organization (Table 10.3). Similarly, the Tukey HSD test showed that there was a significant difference in the views of employees and top management (p = 0.034) regarding the existence of formal training of fraud risk awareness and ethical culture.
Table 10.3. Post hoc test for factor RCU5 and RCU8
Analysis of Variance of Financial and Technical Capacity Audit Process
Respondents were asked to respond to 5 items by indicating the likelihood of the existence of those factors in their organization. The results indicated Table 8 in Appendix A under the column ‘Sig.’ show p-values greater than 0.05 for the 5 factors tested. Therefore, there was no significant difference between respondents’ perceptions of financial and technical capacity based on job levels. Therefore, the H0 hypothesis is accepted for the causes of variation related to financial and technical capacity. In this case, there was no need for further tests to determine the difference in specific means between the respondents.
Analysis of Variance of Risk Appetite Audit Process
Respondents were asked to respond to 9 items by indicating the likelihood of the existence of those factors in their organization. The results indicated Table 9 in Appendix A under the column ‘Sig.’ show p-values greater than 0.05 for the 9 factors tested. Therefore, there was no significant difference between respondents’ perceptions of risk appetite based on job levels. Therefore, the H0 hypothesis is accepted for the causes of variation related to risk appetite. In this case, there was no need for further tests to determine the difference in specific means between the respondents.
Analysis of Variance of Risk Ownership Audit Process Factors
Respondents were asked to respond to 7 items by indicating the likelihood of the existence of those factors in their organization. An ANOVA test was performed to determine if there were any significant differences between the respondent’s perceptions of ownership factors related to the job level. Table 10.4 indicated that there was a significant difference between respondents’ perceptions of 1 out of the 7 ownership factors. The difference was significant on factor O7 “existence of a third-party professional service provider for risk management activities” (F = 4.008, p = 0.021). There was no significant difference in the views of respondents on the other 6 factors as indicated in Table 10 of Appendix A. Thus, there was a need to conduct additional tests on this factor to identify where the differences existed in factor O7.
Table 10.4. ANOVA test for Risk Ownership Audit process factors related to job level
Additional examination of the Tukey HSD post hoc multiple comparison tests with regard to factor O7 showed that there was a significant difference in the views of employees and top management (p = 0.015) regarding the likelihood of the existence of a third-party professional service provider for risk management activities in the organization (Table 10.5).
Table 10.5. Post hoc test for factor O7
Based on the findings of the analysis, only 3 out of the 93 determinants of “Risk Governance Audit Framework” factors related to job level issues were significant. Therefore, the null hypothesis was rejected, leading to the conclusion that there is at least one statistically significant difference between the respondents’ views on determinants of risk governance Audit framework factors related to job level issues. Significant differences existed in one ownership factor (O7 “existence of third-party professional service provider for risk management activities”) and two risk culture factors. However, the contribution of these factors was minimal.
Analysis of Variance of Risk-Based Audit and the Success of Projects Factors
An ANOVA test was performed to determine if there were any significant differences between the respondent’s perceptions of risk-based audit and the success of projects related to job level. Variation related to risk-based audit and the success of projects was examined where the 11th hypothesis was tested (11. H0 11: β11 = 0 or ≠ 0). The hypothesis test was done at a significance level of 0.05. The F-statistic and the p-values were observed.
A total of 28 factors was examined based on 3 job levels (employee, middle management, and top management). Out of these, only 5 were significant: RG1 “the achievement of strategy objectives”, RG2 “delivering projects on time and budget”, RG8 “fewer surprises and crisis in projects”, RG9 “more focus on efficiency of project phases”, and RG14 “better organizational readiness”. Table 10.6 indicated that there was a significant difference between respondents’ perceptions of RG1 based on job levels even though the difference was not highly significant (F = 3.115, p = 0.048).
There was a significant difference between respondents’ perceptions of RG2 based on job levels (F = 4.465, p = 0.014). The respondents’ perceptions of RG8, and RG9 were statistically significant at (F = 3.600, p = 0.031) and (F = 3.455, p = 0.035) respectively. Similarly, there was a significant difference between the respondents’ perceptions of RG14 based on job levels even though the difference was not highly significant (F = 3.090, p = 0.049). There was no significant difference in 23 out of 28 factors as indicated in Table 11 in Appendix A.
Table 10.6. ANOVA test for risk-based audit and the success of projects factors related to job level
The statistically significant findings in Table 10.6 necessitated the performance of post hoc tests to determine the specific groups where significant differences in perceptions occurred. Therefore, Tukey’s HSD post hoc tests were conducted about factors RG1, RG2, RG8, RG9, and RG14. The findings are summarized in Table 10.7 where the findings of the column labelled Sig. were used to identify the differences. P-values ˂0.05 were useful in identifying the significant differences. It was noted that:
- For RG1 “the achievement of strategy objectives”, there was a significant difference in the views of employees and middle management regarding the likelihood of risk based audit contributing in achievement of strategy objectives by helping the organization achieve its goals. However, this difference was not highly significant (p = 0.047). Despite the low significance, this finding indicated that the attainment of objectives influences, though its usefulness may be low compared to other risk-based audit processes.
- For RG2 “delivering projects on time and budget”, there was a significant difference in the views of employees and middle management (p = 0.013) regarding the likelihood of the impact of risk-based audit on delivering projects on time and budget by contributing to helping the organization achieve its goals. This difference could be attributed to the fact that employees report directly to middle-level management and the two parties are likely to engage in discussions concerning the meeting of deadlines to deliver timely projects.
- For RG8 “fewer surprises and crisis in projects”, significant differences in opinions regarding the likelihood of the risk-based audit lead to fewer surprises and crisis in projects contributing to the attainment of project objectives were observed between employees and middle management (p = 0.023).
- For RG9 “more focus on efficiency of project phases”, there was no significant difference on the respondents’ regarding the likelihood of increased focus on the efficiency of projects’ phases on realizing organizational objectives between the 3 job levels.
- For RG14 “better organizational readiness”, there was a significant difference in the views of employees and middle management (p = 0.013) regarding the likelihood of Risk based audit enhanced organizational readiness by helping an organization achieve its project objectives.
For the other 23 factors, there was no need to conduct post hoc tests because the factors were not significant. Overall, the ANOVA result for “risk-based audit and the success of projects factors” based on job levels indicated that there were statistically significant differences between the respondents’ perceptions of 5 out of 28 factors tested. Therefore, the null hypothesis was rejected.
Table 10.7. Post hoc test for factors RG1, RG2, RG8, RG9, and RG14
Analysis of Variance of the occurrence of Negative Events of Projects
An ANOVA test was conducted to determine if there were any significant differences between the respondent’s perceptions of the occurrence of negative events of projects related to the job level. A total of 10 factors was considered based on 3 job levels (employee, middle management, and top management). Causes of variation related to the occurrence of negative events of projects factors were examined where the 12th hypothesis was tested (12. H0 12: β12 = 0 or ≠ 0). The hypothesis test was done at a significance level of 0.05.
The F-statistic and the p-values were observed. Respondents were asked to rate the occurrence of 10 negative events of projects in the organization. These events included “experiencing schedule delays”, “cost overrun”, “lack of control over the projects phases”, “past project failures”, “the failure of governance model to manage key projects”, “the existence of unresolved issues and disputes”, “a lack of independent monitoring of progress”, “a lack of reporting to board and executives”, “failure to achieve the business objectives”, and “a loss of opportunity cost of doing the wrong projects”.
Table 11 in Appendix A indicated that there was no significant difference between respondents’ perceptions of the 10 factors tested based on job levels. The opinions of respondents on the impact of negative events of projects did not differ significantly, which implied that all employees were in agreement regarding the incidence of specific negative events in the organization. This agreement is a good indicator because it implies that all members of the organization are informed about the ongoing at their workplace with regard to the incidence of negative project activities. There was no need for additional post hoc analyses since the results were insignificant. Therefore, there was sufficient evidence to reject the null hypothesis and conclude that there is no statistically significant difference between the respondents’ views on the occurrence of negative events of projects factors related to job level issues.
Analysis of Variance of Internal Audit Function in Overseeing Risk Management
An ANOVA test was conducted to determine if there were any significant differences between the respondent’s perceptions of internal audit function in overseeing risk management related to job level. Causes of variation related to internal audit function in overseeing risk management were examined where the 13th hypothesis was tested (13. H0 13: β13 = 0 or ≠ 0). The hypothesis test was done at a significance level of 0.05. The F-statistic and the p-values were observed. Respondents were asked to rate the importance of various audit factors in the management of organisation risk by choosing one out of five options.
A total of 11 factors was tested out of which the opinions of the respondents on 6 factors were significant based on 3 job levels (employee, middle management, and top management). These factors were IAF1 “Providing independent assurance on risk management processes”, IAF6 “Providing assurance through written reports covering how key risks are managed”, IAF8 “Participating in setting the organization’s risk appetite”, IAF9 “Developing the organizational policies for its risk management processes”, IAF10 “Developing risk management strategy for board approval”, and IAF11 “Implementation risk responses on management’s behalf”.
Table 10.9 indicated that there was a significant difference between respondents’ perceptions of IAF1 based on job levels (F = 3.934, p = 0.022). There was a significant difference between respondents’ perceptions of IAF6 based on job levels (F = 4.274, p = 0.016). These differences could be attributed to differences in work experience, educational level, or age. Respondents’ perceptions of IAF8, IAF9, IAF10, and IAF11 were statistically significant at (F = 3.394, p = 0.037), (F = 3.753, p = 0.026), (F = 4.516, p = 0.013), and (F = 5.087, p = 0.008) respectively.
Table10. 9. ANOVA for audit function in overseeing risk management
Having rejected the null hypothesis, it was necessary to determine where the differences were observed using Tukey’s HSD post hoc tests with regard to Factors IAF1, IAF6, IAF8, IAF9, IAF10, and IAF11. In Table 10.10, it was noted that:
- For IAF1 “Providing independent assurance on risk management processes”, there were differences in the respondents’ opinions regarding the importance of providing independent assurance on risk management processes for risk management between top management and middle management (p = 0.020).
- For IAF6 “Providing assurance through written reports covering how key risks are managed”, there were significant differences (p = 0.012) between the perceptions of top management and employees regarding the importance of providing assurance through written reports covering how key risks are managed on risk management.
- For IAF8 “Participating in setting the organization’s risk appetite”, there was a significant difference between the perceptions of middle management and top management regarding the importance of participating in setting the organization’s risk appetite on risk management (p = 0.045). Nevertheless, this difference was not highly significant. However, it indicated that participation in creating an organization’s risk appetite was a useful audit function in risk management.
- For IAF9 “Developing the organizational policies for its risk management processes”, there was a significant difference in the perceptions of middle and top management regarding the value of developing the organizational policies for its risk management processes in audit functions (p = 0.030).
- For IAF10 “Developing risk management strategy for board approval”, there was a significant difference between the perceptions of top management and employees on the importance of developing risk management strategy for board approval as an audit function (p = 0.011).
- For IAF11 “Implementation risk responses on management’s behalf”, there was a significant difference between the perceptions of top management and employees on the importance of implementing risk responses on management’s behalf as an audit function (p = 0.016). A significant difference based on this factor was also noted between middle and top management (p = 0.019). This observation indicated that diverse opinions existed regarding the importance of implementing risk responses in an organization. Therefore, there was a need to conduct additional investigations regarding this factor.
Table 10.10 Post hoc test – factor IAF1, IAF6, IAF8, IAF9, IAF10, and IAF11
The insignificant factors are indicated in Table 12 of Appendix A. Since there were significant differences in respondents’ perceptions in 6 out of the 11 factors examined, there was sufficient evidence to reject the null hypothesis and conclude that there is a statistically significant difference between the respondents’ views on audit function in overseeing risk management.
Summary
This chapter presented the data collected using one-way ANOVA to analyse the statistical differences among the groups’ responses. SPSS software and a significance level of 0.05 were used for this analysis. The testing of hypotheses involved calculations at α = 0.05 and observation of the F-statistic and the p-value to determine significant differences. The observed differences were considered significant in cases where p ˂ 0.05. On the other hand, the differences were considered insignificant when p ≥ 0.05.
In addition, Tukey’s HSD post hoc tests were used to find the significant differences between the respondents’ perceptions about the factors under investigation. The results showed that there was a statistically significant difference in respondents’ views in 14 out 142 factors. There were statistically significant variations in 3 out of the 4 areas where causes of variation were investigated.
Correlation Analysis
Introduction
Correlation analysis is a statistical assessment technique employed when studying the strength of an association between two continuous variables (Pollock 2015). Correlation analysis determines possible links between variables. However, it does not identify the cause-effect aspect of the connection because it does not consider other variables may have affected the outcomes (Gelman et al. 2014). The correlation between two variables implies that a change in one variable leads to a systematic change in the other over time. A positive correlation occurs if the value of one variable increases as the value of the second rises. Conversely, negative correlation happens when the value of one variable decreases as the value of the second reduces.
Correlation coefficients, which range from +1 to -1, are used to quantify the strength of the association (Johnson 2017). Coefficient values that are close to +1 indicate strong positive associations, whereas those close to -1 indicate negative relations. A correlation coefficient of 0 indicates that no association exists between variables. The purpose of this chapter is to examine the strength of the relationship between risk governance determinants and the effectiveness of public projects.
Ten determinants were investigated in the research each of which contained 2 to 3 clusters based on factor analysis. Spearman’s correlation was performed for all the variables at two levels of significance (0.01 and 0.05). The findings of the analyses are reported in the following sections.
Association between the new latent cluster and the project success
Association between Strategy (S) and Project Success (RG)
There are two latent clusters for strategy construct: SG1 and SG2. Table 1 shows the correlation values for these relationships. The largest positive correlation at 0.01 significance level is 0.537 with a significance of 0.0. This correlation is between SG1 “risk alignment process” of strategy cluster and RG4 “issuance of consolidated reports of disparate risk at board level” of RG. The lowest positive correlation at 0.01 significance level is 0.254. This correlation is between SG2 of strategy cluster and RG11 of RG. SG2 is “risk oversight practices”, whereas RG11 is “capability to take on critical risks in order to get greater reward”.
Table 1. Association between strategy (S) and project success (RG)
Association between Risk Appraisal and Insight (RAI) and Project Success (RG)
There are two latent clusters for “risk appraisal and insight” (RAI) construct: RAIG1 and RAIG2. Table 2 shows the correlation values for these relationships. The largest positive correlation at 0.01 significance level is 0.605. This correlation is between RAIG1 “risk guidelines” of RAI cluster and RG17 “early identification and understanding of internal and external issues pertaining to projects” of RG. The lowest positive correlation at 0.01 significance level is 0.264. This correlation is between RAIG2 “risk assessment process” and RG11 “capability to take on critical risks in order to get greater reward”.
Table 2. Association between risk appraisal and insight (RAI) and project success
Association between Risk Management and Governance (RMGG) and Project Success (RG)
There are two latent clusters for “risk management and governance” (RMGG) construct: RMGG1 and RMGG2. Table 3 shows the correlation values for these relationships. The largest positive correlation at 0.01 significance level is 0.657. This correlation is between RMGG1 “risk governance” and RG20 “adoption of risk-based audit has enabled optimal utilization of financial resources” of RG. The lowest positive correlation at 0.01 significance level is 0.350. This correlation is between RMGG2 “risk control” of RMGG cluster and RG26 “risk-based audit helps to identify the risk appetite adequately” of RG.
Table 3. Association between risk management and governance (RMGG) and project success
Association between Review Risk Development and Decision (RRD) and Project Success (RG)
There are three latent clusters for “review risk development and decision” (RRD) construct: RDG1, RDG2, and RDG3. There are 84 possible correlations as indicated in Table 4. The largest positive correlation at 0.01 significance level is 0.571. This correlation is between RDG2 “effectiveness assurance” of RRD cluster and RG20 “adoption of risk-based audit has enabled optimal utilization of financial resources” of RG. The lowest positive correlation at 0.01 significance level is 0.294. This correlation is between RDG1 “monitoring guidelines” of RRD cluster and RG26 “risk-based audit helps to identify the risk appetite adequately” of RG.
Table 4. Association between review risk development and decision and project success
Association between Risk Communication (RC) and Project Success (RG)
There are three latent clusters for “risk communication” (RCG) construct: RCG1, RCG2, and RCG3. The 84 possible correlations are possible as indicated in Table 5. The largest positive correlation at 0.01 significance level is 0.580 with significance of 0.0. This correlation is between RCG2 “risk documentation” of RCG cluster and RG25 “ability to identify the emerging risks associated with strategic plans” of RG. The lowest positive correlation at 0.01 significance level is 0.350. This correlation is between RCG1 “risk communication” of RCG cluster and RG21 “risk-based audit has increased the accountability” of RG.
Table 5. Association between risk communication (RCG) and project success
Association between Risk Culture (RCU) and Project Success (RG)
There are two latent clusters for “risk culture” (RCU) construct: RCUG1 and RCUG2. Table 6 shows the correlation values for the 56 possible relationships. The largest positive correlation at 0.01 significance level is 0.445. This correlation is between RCUG2 “risk culture awareness” of RCU cluster and RG25 “ability to identify the emerging risks associated with strategic plans” of RG. The lowest positive correlation at 0.01 significance level is 0.242. This correlation is between RCUG1 “risk culture development” of RCU cluster and RG18 “increased likely of delivering projects on scope, on time, and on budget”.
Table 6. Association between risk culture (RCU) and project success
Association between Risk Appetite (RA) and Project Success (RG)
The “risk appetite” (RA) construct has two latent clusters: RAG1 and RAG2. Table 7 shows the 56 possible correlation values for these relationships. The largest positive correlation at 0.01 significance level is 0.608. This correlation is between RAG1 “risk appetite” of RAG cluster and RG3 “improvement of understanding of key risks and their wider implications” of RG. The lowest positive correlation at 0.01 significance level is 0.379. This correlation is between RAG2 “risk appetite alignment process” of RAG cluster and RG28 “fewer operational surprises”.
Table 7. Association between risk appetite and project success
Association between Risk based audit Project success (RGP) and Project Success (RG)
The “project success” (RGP) construct has three latent clusters: RGP1, RGP2, and RGP3. Table 8 shows the correlation values for these relationships. The largest positive correlation at 0.01 significance level is 0.929. This correlation is between RGP3 “effective project risk management” of RG cluster and RG4 “issuance of consolidated reports of disparate risk at board level” of RG. The lowest positive correlation at 0.01 significance level is 0.665. This correlation is between RGP1 “efficient project delivery” of RGP cluster and RG26 “risk-based audit helps to identify the risk appetite adequately” of RG.
Table 8. Association between Risk based audit project success and project success
Association between the Occurrence of Negative Events of Projects and Project Success (RG)
The two latent clusters for “occurrence of negative events of projects” (IN) construct are INP1 and INP2. Table 9 shows the correlation values for these relationships. The largest positive correlation at 0.01 significance level is 0.246. This correlation is between INP2 “project failure” of IN cluster and RG1 “the achievement of strategy objectives” of RG. The lowest positive correlation at 0.05 significance level is 0.185. This correlation is between INP2 “project failure” of IN cluster and RG15 “increased project control to maximize efficiency” of RG. The highest negative correlation is -0.196, which is between INP1 “governance failure” cluster of IN and RG18 “increased likely of delivering projects on scope, on time, and on budget” of RG. The lowest negative correlation is -0.184, which is between INP1 cluster of IN and RG17 “early identification and understanding of internal and external issues pertaining to projects”.
Table 9. Association between the occurrence of negative events of projects and project success
Association between Internal Audit Function (IAF) and Project Success
The three latent clusters for “internal audit function” (IAF) construct are IAFR1, IAFR2, and IAFR3. Table 10 shows the 84 possible correlation values for these relationships. The largest positive correlation at 0.01 significance level is 0.588. This correlation is between IAFR1 “role of internal audit” of IAF cluster and RG13 “reassurance of adequate implementation of risk management processes” of RG. The lowest positive correlation at 0.01 significance level is 0.186 with significance of 0.0. This correlation is between IAFR2 “auditing of risk governance function” of IAF cluster and RG2 “delivering projects on time and budget” of RG.
Table 10. Association between internal audit function (IAF) and project success
The association between new latent cluster and the occurrence of negative events of projects
Association between Strategy (S) and the Occurrence of Negative Events of Projects (IN)
Table 11 shows the correlation values for the relationship between the two latent clusters of “strategy” and IN. The largest negative correlation at 0.01 significance level is -0.261. This correlation is between SG1 “risk alignment process” of strategy and IN8 “lack of reporting to board and executives” of IN. The smallest negative correlation at 0.01 level of significance is -0.188. This correlation is between SG1 “risk alignment process” and IN9 “our organization is experiencing failure to achieve the business objectives”.
Table 11. Association between strategy (S) and the occurrence of negative events of projects (IN)
Association between Risk Appraisal and Insight (RAI) and the Occurrence of Negative Events of Projects (IN)
Table 12 shows the correlation values for the relationship between the two latent clusters of “risk appraisal and insight” and IN. The largest negative correlation at 0.01 significance level is -0.254. This correlation is between RAIG1 “risk alignment process” and IN8 “lack of reporting to board and executives” of IN. The smallest negative correlation at 0.01 level of significance is -0.194. This correlation is between SG1 “risk alignment process” and IN9 “our organization is experiencing failure to achieve the business objectives”.
Table 12: Association between risk appraisal and insight (RAI) and the occurrence of negative events of projects (IN)
Association between Risk Management Governance (RMG) and the Occurrence of Negative Events of Projects (IN)
Table 13 shows the correlation values for the relationship between the two latent clusters of RMG and IN. The largest negative correlation at 0.01 significance level is -0.285. This correlation is between RMGG2 “risk control” of RMG and IN8 “lack of reporting to board and executives” of IN. The smallest negative correlation at 0.05 level of significance is -0.190. This correlation is between RMGG1 “risk governance” and IN5 “governance model fails to manage key projects”.
Table 13. Association between risk management governance (RMG) and the occurrence of negative events of projects (IN)
Association between Review Risk Development and Decision (RDG) and the Occurrence of Negative Events of Projects (IN)
Table 14 shows the correlation values for the relationship between the three latent clusters of RDG and IN. The largest negative correlation at 0.01 significance level is -0.257. This correlation is between RMDG2 “effectiveness assurance” of RDG and IN8 “lack of reporting to board and executives” of IN. The smallest negative correlation at 0.01 level of significance is -0.226. This correlation is between RDG3 “monitoring of risk exposure” and IN8 “lack of reporting to board and executives”.
Table 14. Association between review risk development and decision (RDG) and the occurrence of negative events of projects (IN)
Association between Risk Communication (RC) and the Occurrence of Negative Events of Projects (IN)
Table 15 shows the correlation coefficients for the relationship between the three latent clusters of RCG and IN. The largest negative correlation at 0.01 significance level is -0.281, which is between RCG1 “risk communication” of RDG and IN6 “existence of unresolved issues and disputes” of IN. The smallest negative correlation at 0.05 level of significance is -0.197. This correlation is between RCG3 “risk coordination” and IN6.
Table 15. Association between risk communication (RCG) and the occurrence of negative events of projects (IN)
Association between Risk Culture (RCU) and the Occurrence of Negative Events of Projects (IN)
Table 16 shows the correlation values for the relationship between the two latent clusters of RCU and IN. The only negative correlation at 0.01 significance level is -0.210. This correlation is between RCUG1 “risk culture development” of RCUG and IN6 “existence of unresolved issues and disputes” of IN.
Table 16. Association between risk culture (RCU) and the occurrence of negative events of projects (IN)
Association between Risk Appetite (RAG) and the Occurrence of Negative Events of Projects (IN)
Table 17 shows the correlation values for the relationship between the two latent clusters of RAG and IN. The only negative correlation at 0.05 significance level is -0.196. This correlation is between RAG1 “risk appetite” of RAG and IN8 “lack of reporting to board and executives” of IN.
Table 17. Association between risk appetite (RAG) and the occurrence of negative events of projects (IN)
Association between Project Success (RGP) and the Occurrence of Negative Events of Projects (IN)
Table 18 shows the correlation values for the relationship between the three latent clusters of RGP and IN. The highest positive correlation at 0.01 significance level is 0.311. This correlation is between RGP1 “efficient project delivery” of RGP and IN1 “our organization is experiencing schedule delays” of IN. The smallest positive correlation at 0.05 significance level is 0.192. This correlation is between RGP2 “efficient risk monitoring” of RGP and IN4 “our organization experienced projects failure in the past” of IN. The smallest negative correlation at 0.05 significance level is -0.200, which is between RGP2 “efficient risk monitoring” and IN7 “lack of independent monitoring of progress”. The largest negative correlation at 0.05 level of significance is -0.210, which is between RGP3 “effective project risk management” and IN7.
Table 18. Association between project success (RGP) and the occurrence of negative events of projects (IN)
Association between the new latent clusters of Occurrence of Negative Events of Projects (INP) and the Occurrence of Negative Events of Projects (IN)
Table 19 shows the correlation values for the relationship between the two latent clusters of INP and IN. The highest positive correlation at 0.01 significance level is 0.917. This correlation is between INP1 “governance failure” and IN7 “lack of independent monitoring of progress” of IN. The smallest positive correlation at 0.01 significance level is 0.413, which is between INP1 “governance failure” and IN2 “our organization is experiencing cost overrun” of IN.
Table 19. Association between occurrence of negative events of projects (INP) and the occurrence of negative events of projects (IN)
Association between Internal Audit Function (IAF) and the Occurrence of Negative Events of Projects (IN)
Table 19 shows the correlation values for the relationship between the three latent clusters of IAF and IN. The highest positive correlation at 0.01 significance level is 0.359, which is between IAFR1 “role of internal audit” and IN2 “our organization is experiencing cost overrun” of IN. The smallest positive correlation at 0.05 significance is 0.186, which is between IAFR1 and IN4 “our organization experienced projects failure in the past” of IN. The largest negative correlation is -0.277, which is between IAFR3 “provision of audit reports” and IN7 “lack of independent monitoring of progress”. The smallest negative correlation at 0.05 level of significance is -0.192, which is between IAFR3 and IN5 “governance model fails to manage key projects”.
Table 20. Association between internal audit function (IAF) and the occurrence of negative events of projects (IN)
Summary
Correlation analysis has revealed the existence of relationships between risk governance determinants and the effectiveness of public projects. There were more positive relationships between risk governance determinants and project effectiveness than between risk governance determinants and negative events.
Reference List
Australian National Audit Office [ANAO] 2014, Better practice guide – public sector governance: strengthening performance through good governance, Australian National Audit Office, Canberra.
Aven, T 2016, ‘Risk assessment and risk management: review of recent advances on their foundation’, European Journal of Operational Research, vol. 253, no. 1, pp. 1-13.
Beckers, F, Chiara, N, Flesch, A, Maly, J, Silva, E & Stegemann, U 2013, ‘A risk-management approach to a successful infrastructure project: initiation, financing, and execution’, McKinsey Working Papers on Risk, vol. 1, no. 52, pp. 1-18.
Brown, L & Osborne, S 2013, ‘Risk and innovation’, Public Management Review, vol. 15, no. 2, pp. 186-208.
Dodson, K & Westney, R 2014, Predictable projects in a world of black swans, Web.
Ellul, A 2015, ‘The role of risk management in corporate governance’, Annual Review of Financial Economics, vol. 7, pp. 279-299.
Florea, R & Florea, R 2016, ‘Internal audit and risk management: ISO 31000 and ERM approaches’, Economy Transdisciplinarity Cognition, vol. 19, no. 1, pp. 72-77.
Hajikazemi, S, Ekambaram, A, Andersen, B & Zidane, Y 2016, ‘The black swan – knowing the unknown in projects’, Procedia – Social and Behavioral Sciences, vol. 226, pp. 184-192.
Hudin, NS & Hamid, AB 2014, ‘Drivers to the implementation of risk management practices: a conceptual framework’, Journal of Advanced Management Science, vol. 2, no. 3, pp. 163-169.
Huibers, CJ 2013, ‘The role(s) of the auditor in projects: proactive project auditing’, The EDP Audit, Control, and Security Newsletter, vol. 47, no. 5, pp. 1-14.
Joslin, R & Muller, R 2016, ‘The relationship between project governance and project success’, International Journal of Project Management’, vol. 34, no. pp. 613-626.
Kenett, RS 2013, Managing risks with data, Web.
Muller, R & Lecoeuvre, L 2014, ‘Operationalizing governance categories of projects’, International Journal of Project Management, vol. 32, no. 8, pp. 1346-1357.
Pinto, JK 2014, ‘Project management, governance, and the normalization of deviance’, International Journal of Project Management, vol. 32, no. 3, pp. 376–387.
Polk, D 2014, Risk governance: visual memorandum on guidelines adopted by the OCC, Davis Polk & Wardwell LLP, New York, NY.
Reding, KF, Sobel, PJ, Anderson, UL, Head, MJ, Ramamoorti, S, Salamasick, M & Riddle, C 2013, Internal auditing: assurance & advisory services, 3rd edn, The IIA Research Foundation, Boston, MA.
Serra, CE, Kunc, M 2014. ‘Benefits realisation management and its influence on project success and on the execution of business strategies’, International Journal of Project Management, vol. 33, no. 1, pp. 53–66.
Shad, MK & Lai, F 2015, ‘A conceptual framework for enterprise risk management performance measure through economic value added’, Global Business and Management Research: An International Journal, vol. 7, no. 2, pp. 1-12.
Too, EG &Weaver, P 2014, ‘The management of project management: a conceptual framework for project governance’, International Journal of Project Management, vol. 32, no. 8, pp. 1382–1394.
Werther, GF 2013, ‘When black swans aren’t: on better recognition, assessment, and forecasting of large scale, large impact, and rare event’, Change, Risk Management and Insurance Review, vol. 16, no. 1, pp. 1-23.