Introduction
The objective of the assignment is to compare the thickness of plywood sheets manufactured by Winsor Plywood and Royal Plywood companies and determine which one is thicker.
Conditions, Rejection Criteria, and Hypotheses
Conditions
- Compare the means of the thickness of the two types of plywood sheets.
- The hypothesis test will use paired-samples t-test.
- The assignment used a sample size of 100 (N = 100) for both types of plywood sheets.
Rejection Criteria
The hypothesis test will use a significance level of 0.05 (α =0.05) in determining the statistical significance of the difference in thickness of plywood sheets.
Hypotheses
- H0: There is no statistically significant difference in the means of plywood sheets manufactured by Winsor Plywood and Royal Plywood (µ1 = µ2).
- H1: There is statistically significant difference in the means of plywood sheets manufactured by Winsor Plywood and Royal Plywood (µ1 ≠ µ2).
The Sample Size Determination
The assignment sampled plywood sheets from the stores of the respective companies, which manufacture the two types of plywood sheets. The assignment sampled 100 plywood sheets from each company and measured their thickness. The sample 100 is sufficient to represent the population and feasible to measure within a reasonable time.
The sampling methodology used is the convenience sampling technique because it involved a sampling process of selecting and measuring plywood sheets that were easily accessible.
Table 1. Descriptive Statistics.
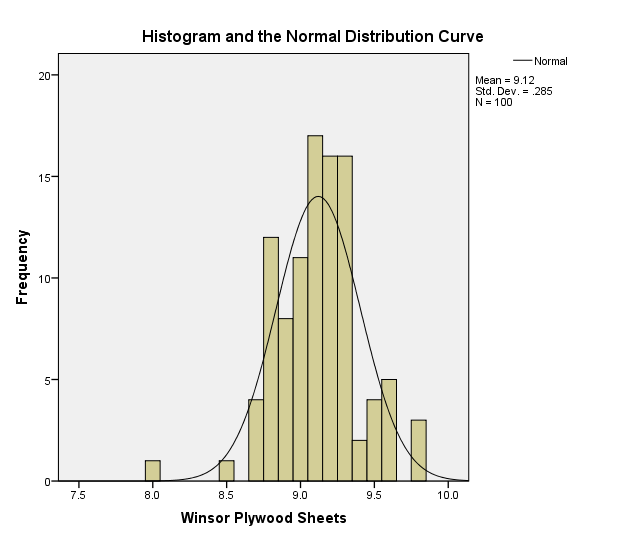
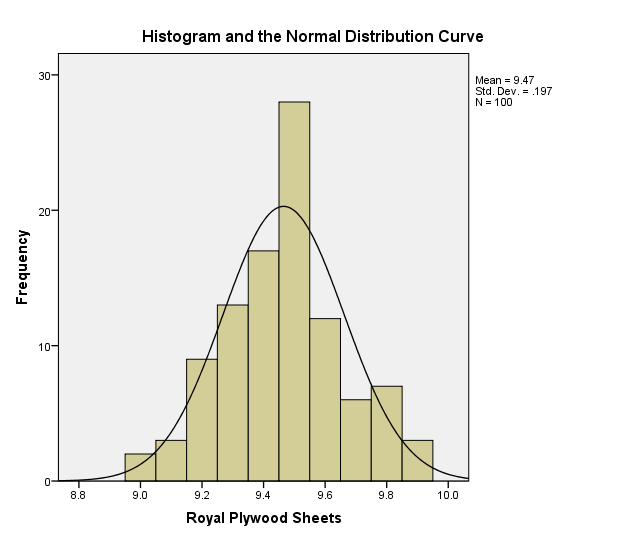
The descriptive statistics indicates that there is an apparent difference in the means of the thickness of plywood sheets manufactured by Winsor Plywood and Royal Plywood. Evidently, the mean of plywood thickness manufactured by Winsor Plywood (M = 9.120) is less than the mean of plywood thickness manufactured by Royal Plywood (M = 9.465).
The measures of dispersion indicate that the thickness of plywood sheets manufactured by Winsor Plywood (SD = 0.2846, variance = 0.081, range = 1.8) is more diverse than the plywood sheets manufactured by Royal Plywood (SD = 0.1966, variance = 0.39, and range = 0.90).
The distribution of data closely follows the normal distribution as demonstrated in Figure 1 and Figure 2.
Calculation of T-Test
Montgomery, Runger, and Hubele state that significance level determines rejection or failure to reject of a null hypothesis (147). In this view, the t-test rejects the null hypothesis that there is no statistically significant difference in the means of plywood sheets manufactured by Winsor Plywood and Royal Plywood, t(99) = -10.744, p = 0.000.
Conclusion
The analysis of the thickness of plywood sheets manufactured by Winsor Plywood and Royal Plywood indicate that they have a noticeable difference. Evidently, the thickness of plywood sheets manufactured by Royal Plywood is thicker than the ones manufactured by Winsor Plywood.
Works Cited
Montgomery, Douglas, George Runger, and Norma Hubele. Engineering Statistics. London: John Wiley & Sons, 2009. Print.