Overview of the Problem
Quality of the door and window trims produced from a lumber is a top priority in the wood mill industry. As such, it is essential that The Woodmill Company places significant emphasis on quality. The company targets at purchasing the highest quality lumber to produce competitive door and window trims. However, Marcille et al. (2020) note that the quality of the lumber could be challenged by shakes, slope of grain, knots, or other natural characteristics. A professional view is required to get optimal number of quality trimmings from the lumber despite their shortcomings.
Traditionally, The Woodmill Company hires a professional and experienced operator who determines the size of the rip width to use after evaluating the lumber. The operator’s results are based on the number of knots and defects in the wood. The company solely depends on the operator and no other process is used to verify the accuracy of their judgement. This is a challenge to the company as the operator might not be in a position to determine the accurate dimensions for best quality trimmings. Also, an operator can only measure a limited lumber in a particular time (Marcille et al., 2020). Another significant challenge facing the company is that they can only employ experienced operators since the process requires mastery of all dimensions of the major trimmings. To overcome these limitations, the Woodmill Company has to adopt another way of determining the door and window rip dimensions.
As technology use of technology is prevalent and has changed processes in most industries, the wood company is not exceptional. Resultantly, the Woodmill Company identified an optical scanner that was developed by company in Oregon that can be applied in the process to establish the rip widths. The company programmed the scanner to identify defects and to recognize rip widths appropriate for optimal value of rip measured.
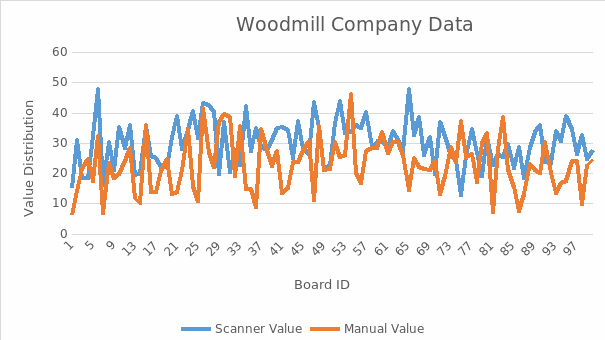
To evaluate the efficiency of the scanner, Wood mill put the scanner through a test to run 100 boards. The identified rip width was recorded but the boards were not ripped. Thereafter, a grader identified the value of the rip measurement recorded by the optical scanner for each of the 100 boards. An assumption that the rip had been cut was made. To compare the efficiency of the scanner, the same 100 boards were put through the normal processes where they were manually ripped. The grader also evaluated the value of the manually ripped wood and they were recorded. The recording and analysis of the resulting data is represented below.
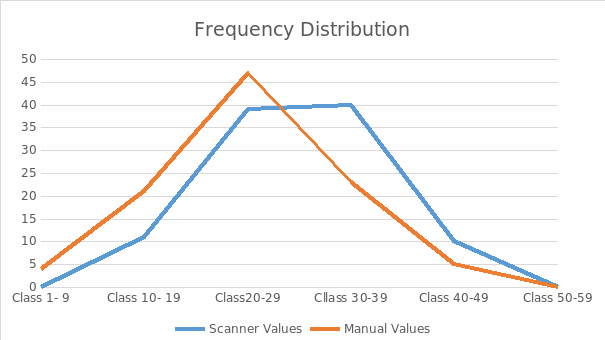
Frequency Distribution for the Scanner and Manual Values

Table 2: Frequency distribution table.

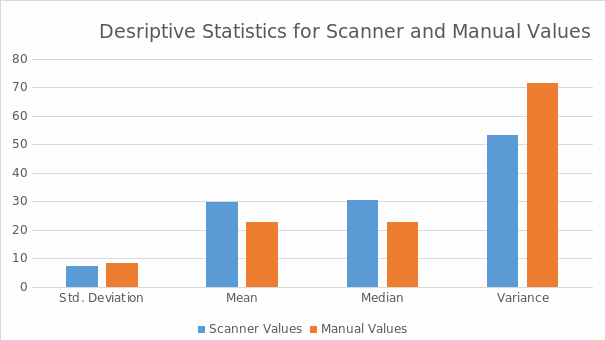
Descriptive Statistics for the Board Values for the Scanner and Manual Process
Table 3: Descriptive Statistics Data.

The above the frequency distribution and descriptive analysis of the scanner and manual values collected from the tests carried out to establish the difference in their efficiencies. From the data, it is clear that the scanner values are higher than the manual values from the frequency chart. This can also be observed from the difference in mean between the two values. The mean value from the data of the optical scanner is 29.9389 while the mean for the manual value is 22.77. The standard deviation of the manual process from the mean is higher than that of the scanner values. Likewise, the variance of the manual values is higher than the variance of the optical scanner values. The results of the scanner values have a less standard deviation hence has less variability than the manual values hence has a probability of being more reliable.
Recommendation
Smith (2019) believes that when choosing a method of production, a company targets at increasing efficiency, productivity, quality, and reducing cost and time used in production. The Windmill Company should put all these factors in consideration when choosing the method used to determine rip dimensions for doors and windows. From the analysis of the recorded tests conducted on the two processes, the optical scanner produces rip dimensions of a higher grade than the manual processes.
Without doubt, the adoption of technology in production activities has improved the profitability and ease of conducting business processes (Smith). The same case applies to Woodmill Company where a higher quality grade of door and window rip dimensions are produced by an optical scanner. The management should adopt the machine for efficiency and competitiveness of the operations in the company. Apart from the quality of rip dimensions produced, the optical scanner will reduce overreliance of an experienced operator paving way for incorporation of the youth employees in the company (Marcille et al., 2020). Since the scanner is programmed, it has the ability to produce uniform door and window trimmings than the manual scanner.
References
Marcille, K. C., Morgan, T. A., McIver, C. P., & Christensen, G. A. (2020). California’s forest products industry and timber harvest, 2016. US Department of Agriculture, Forest Service: Pacific Northwest Research Station. 58 p., 994. Web.
Smith N. J. (2019). CASE STUDY: STRUCTURAL ANALYSIS OF AN HISTORIC HEAVY TIMBER MILL. Web.