Human Resource
Human Capital Development
Organizational Structure
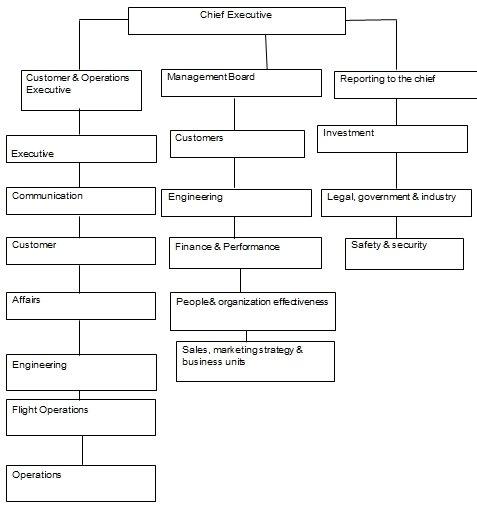
British Airways has a straightforward organizational structure in which managers’ report to the Board of Directors. British Airways, being a global company, has offices all over the globe. The firm has a unique method of recognizing and respecting its employees. Employees’ special days, such as birthdays and farewells, are celebrated. They have a vision of setting themselves apart from other ordinary airlines. The airline has employed a varied set of employees from different backgrounds to foster creativity and possible new ideas. British Airlines demonstrates diversity. They promote diversity in newspapers and via the organization’s publications. Every change in the company is conveyed to employees in BA (British Airways, 2019). The graphic below depicts the organizational structure of the BA.
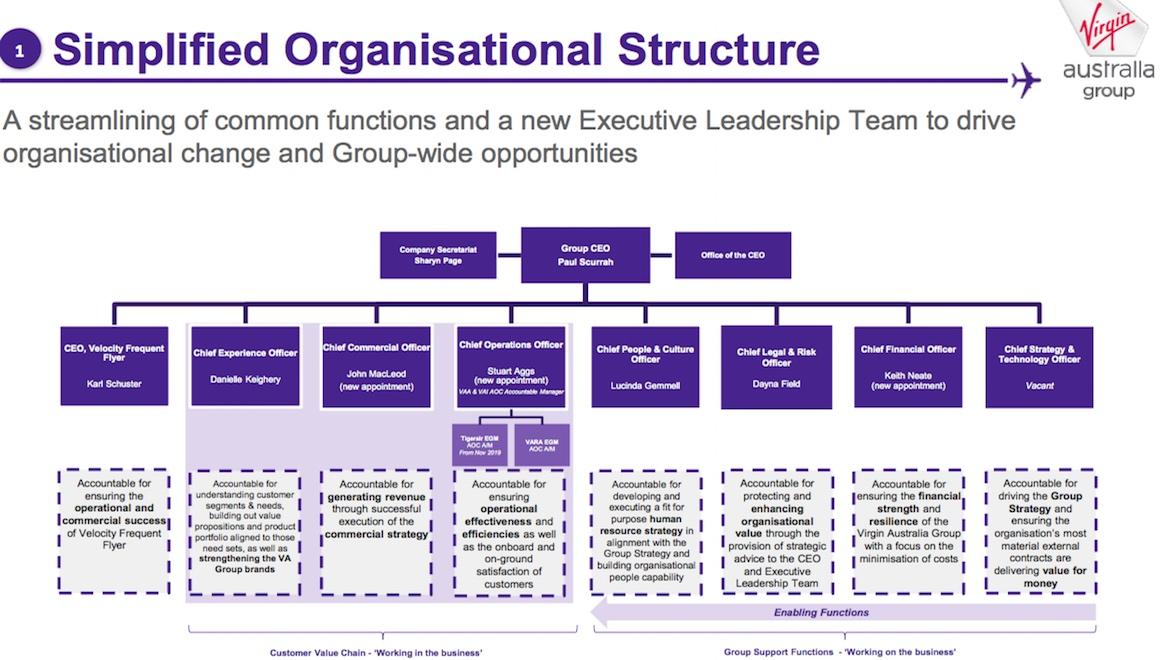
Virgin Atlantic Airlines is structured with a hierarchical organisation. Large organizations are more likely to utilize this model. The CEO heads the top chain of command, and then leadership is transmitted to a senior management, who is followed by managers, and so on. They have an easy-to-manage institutional framework. Because it is dynamic, it can adapt to changing company demands. Virgin Atlantic Airways has values that drive people to attain outstanding levels of performance. The company is well-known for its fundamental ideals and strong customer focus. Because of its outstanding human resource policies, the majority of employees in the United Kingdom (Virgin Atlantic, 2022) has favored the airline. The operational plan of the VA is shown in the figure below.
Motivational Theories
When it comes to motivating its personnel, British Airways depends on a number of motivational philosophies. For example, the corporation employs Maslow’s hierarchy of needs, which is executed as follows: the company offers “fringe benefits,” the Airways Pension Scheme (APS), the British Airways social clubs, and job stability. BA is beneficial to personnel’s career development and fulfillment of self-actualization desires (Kondalkar, 2020). For example, the corporation used the HPL (High Performance Leadership) program to assess its workers’ importance of leadership abilities (Brendel and Chou, 2016). McClelland’s theory of needs applied is another motivating theory. The theory’s emphasis is on establishing an employee’s affinity with BA. People have a strong desire to join a group, and the added financial and social possibilities reinforce this desire. (British Airways, 2018). Herzberg’s theory is another motivating theory employed in the company. The hypothesis is being used for hygienic reasons since BA is concerned about health and safety. The theory has strengthened the company’s ability to handle issues such as psychological risk management, health problems and fatalities, and risk-informed strategies.
British Airlines’ use of Maslow theory emphasizes employee training and development by presenting them with a variety of difficulties and challenging situations in order for them to discover their unique abilities. For example, the company offers excellent designations and positions to its employees to increase their self-esteem (Mira, Yap, and Chan, 2019. Another critical component of the theory’s execution is social needs. In BA, many cultural programs and organizations operating under several commands interact with each other to provide the demands of socializing and safety. BA has implemented a robust pension plan in this area to assure long-term safety and benefits. Finally, physiological needs include the BA paying its employees the right amount of money and giving them a good working environment.
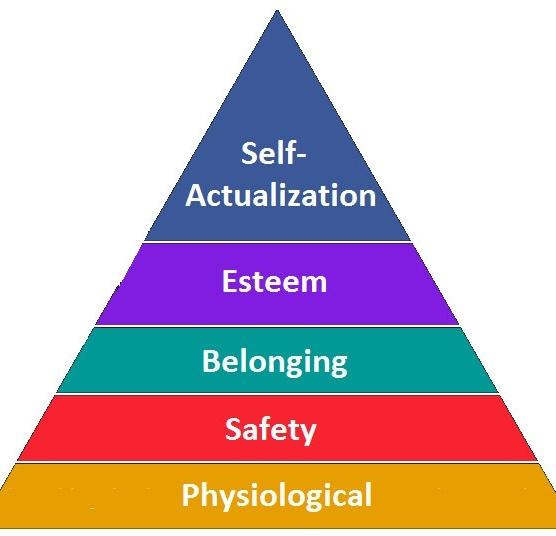
Virgin Atlantic, like British Airways, employs Maslow’s hierarchy of needs, McClelland’s theory of needs, and Herzberg theory. Maslow’s hierarchy of wants, as employed in VA, is specifically accomplished via the provision of freedom of business throughout employment (Mira, Yap, and Chan, 2019). The fundamental Maslow’s hierarchy of needs adopted by VA is the desire for relaxation and comfort at work, as well as sustenance during breaks, job stability, and entrepreneurial incentive to develop and start new businesses. In other words, the business provides healthy work conditions for both internal and external settings, as provided by the Maslow’s integration theory (Virgin Atlantic, 2021). Maslow’s hierarchy of needs is shown in the diagram below.
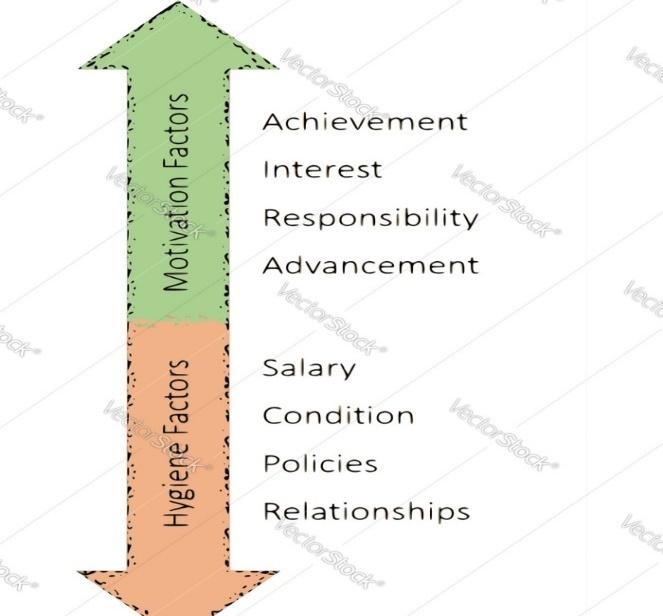
Using McClelland’s theory of needs, VA creates a working atmosphere that promotes psychological wellness in its workers. This creates a sense of belonging to the firm. (Virgin Atlantic, 2021). VA employs two components of Herzberg theory. One is the hygiene elements, which include the connection between the company and its employees, as well as their supervisors, the work environment, and their relationships with coworkers (Kondalkar, 2020). The other group is concerned with motivating aspects such as development, accomplishment, responsibility, job nature, and so on. However, VA emphasizes the motivation component above the hygiene factor (Virgin Atlantic Careers UK, 2020). The diagram below depicts the dynamics of Herzberg’s hypothesis in VA.
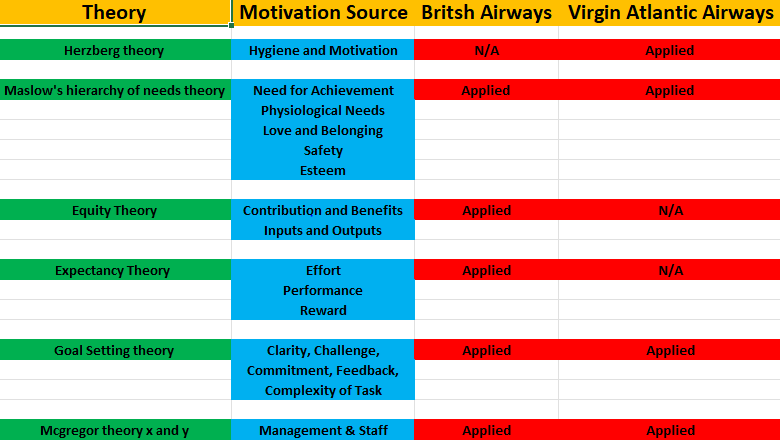
From the above analysis, both companies apply diverse motivational theories into their operations. A summary of the theories is as shown below.
Leadership Styles
Various leadership styles may be used in the administration of an organization. Every leader takes a unique approach. In fact, one may think that there are as many leadership styles as there are leaders. The table below provides an overview of several leadership styles. British Airways shifted from an autocratic to a transformational leadership style, allowing the firm to resume development that had been halted between 1996 and 2000, when the autocratic style was at its pinnacle (British Airways, 2021). They have implemented a contingency plan in which the leadership style changes in response to the company’s current condition.
Virgin Airlines is a company that uses transformational leadership to help the company grow through time. As indicated by the CEO’s letter to pilots, the firm has a vision for future growth, and management strives to encourage employees to contribute to that vision by delivering exceptional service and being loyal to the company. Because he is a real entrepreneur, Richard Branson epitomizes the culture of growth and technology (Virgin Atlantic, 2019)
Conflict Resolution
British Airways has developed a team leadership and personal management approach to address staff issues. They have implemented a program called “Manage People First,” which instructs team leaders to manage their own teams instead of criticizing others. However, in order to handle some tensions inside the business, management in VA places a strong emphasis on employee mental growth, personal and professional development, and involvement in particular problems. In the company, cross-cultural activities have been used to psychologically prepare personnel for confrontations.
The Effects of COVID-19
When the epidemic impacted the aviation industry, British Airways suffered considerably. Because flights were curtailed due to border closures, the airline industry was forced to shut its doors. The corporation suffered a loss of around €7.4 billion. The epidemic lost the firm around ten thousand jobs. The original goal was to lay off 12,000 people. Because of COVID-19, the corporation was only producing 25–30% of its regular revenues (Business Standard India, 2020). In reaction to COVID-19, Virgin Atlantic had to reduce 3500 employees out of 10,000 (BBC News, 2020). To guarantee its financial position during COVID-19, the firm planned a 1.2 billion investment (BBC News, 2020). In COVID-19, the firm lost 669 million pounds before taxes (Business Standard India, 2020). Virgin Atlantic Airways is pursuing sustainable measures such as frequent airplane maintenance to prevent toxic smoke emissions (implementation of materials that use less carbon). The supply chain is built in such a manner that additional gasoline is not used. The move is to encourage stakeholders who believe in environmentally friendly activities while working and preventing pollution.
Organizational Learning/Change Management
Change management is a systematic strategy to cope with the transition or transformation of an organization’s objectives, procedures, or technology. The goal of change management is to put in place techniques for bringing about change, regulating change, and assisting individuals in adapting to change. Managers can use these tactics by having a systematic way to ask for a change, as well as tools for responding to and following up on requests,
British Airways (British Airways)
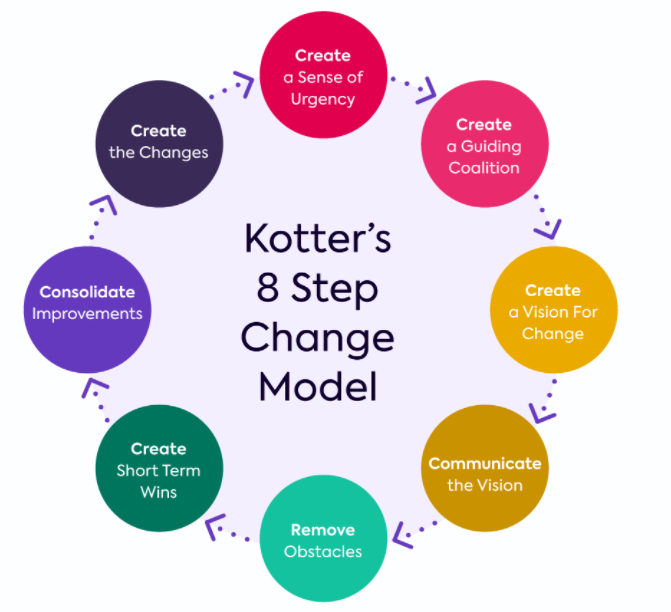
For leading change, British Airways uses Kotter’s 8-Step method. This paradigm, created by Harvard University professor John Kotter, consists of eight phases. The stages are as follows: raising the urgency for change; forming a strong coalition for change; developing a vision for change, articulating the vision; eliminating barriers; achieving short-term victories; building on them; and embedding the change in corporate culture. Kotter’s 8-Step Change Model is shown in the graphic below (see Figure 1).
Change management theory was created to address these issues. For example, the company developed a cost cutting and workforce reduction strategy. According to Seely (2020), BA established “Putting People First,” a training program that educated and restructured employees. A similar approach was used to change the company’s image. Finally, the business replaced rigid top management with culturally sensitive top management.
Virgin Atlantic
Based on business demands, the Virgin Group’s contingency plan has shifted. They realize that by breaking the ice, they can accomplish better results and provide better customer service. Changes in Virgin Group bureaucracy and hierarchy. As a result, Sir Richard Branson let the executives use their initiative, talents, and experience. The idea states that when management changes, groups split and employees work individually, speeding the process. Thus, resistance to change management hinders work.
Due to poor service and high production expenses like oil and maintenance, Virgin Atlantic is losing market share and profit margins. The company adopted Kotter’s 8-step approach for change management, starting with creating urgency and developing change management methods, then removing barriers and aligning resources. VA used a change model to improve management, operations, and customer service strategies.
Financial Ratios
Evaluation of Financial Performances
Below is a five-year overview of the BA and VA financial statements. These positive trends looked to have increased equity for both businesses during the last five years for BA (2020-2016).
Table 1: Five years summary of BA and VA financial statements (£ m)
To examine the financial ratios, two firms in the United Kingdom were set up, each with its own set of financial statements and ratio analysis from 2016 to 2020.
Liquidity Ratio
The capacity of every economic unit in a market economy to pay its obligations on time is the most important and visible feature of the market economy.
The current ratio. Current assets are divided by current liabilities to get the current ratio. The graphic above depicts the current ratios for BA and VA for the years (2016-20202) (see Figure 7; blue line), with calculated values as indicated in Appendix A table 2. According to the trends, both enterprises had significant current ratios by convectional norms. A ratio greater than one (or two) shows that working capital is positive (current assets exceed current liabilities). A working capital ratio of 1 (or 2) shows that it is negative (current liabilities exceed current assets). As a result, in contrast to VA, BA is operating within its present assets.
Quick Ratio/Acid test. The difference between current assets and inventory is divided by current liabilities to produce the quick ratio. According to the above diagram (see Figure 8, red line), or values shown in Appendix A table 3, VA’s quick ratio is marginally below conventional criteria, although it has sufficient liquid assets, indicating a business effort to balance financial responsibilities in contrast to BA, which has an above-average quick ratio.
Profitability Ratio
The profitability ratio is used to evaluate a company’s ability to produce revenue relative to its costs. Profitability ratios such as gross profit margin (GPM), return on equity (ROE), and return on capital employed (ROCE) have been computed for British Airways and Virgin Atlantic. The graphic below (see Figure 9) depicts the two firms’ ROE (Table 4) and GPM (Table 5). High ROE values are favored since the higher the ratio, the larger the return on shareholders’ capital.
British Airways’ profitability ratios were constant prior to the pandemic, however Virgin Atlantic’s profitability ratios have deteriorated significantly since 2016, although remain positive in 2020. Between 2016 and 2018, ROCE increased steadily (see figure 11, Table 6). There was no major shift between 2018 and 2019, but given the relatively high valuations in for both organizations, there is potential for corporate effort.
Efficiency Ratios
With a few variations, the efficiency ratio displays costs as a percentage of income. It shows how much money a corporation spends to produce one dollar. Companies are required to have the lowest efficiency ratios feasible. Asset turnover and working capital ratio are examples of efficiency. The graph below (figure 12, table 7) shows the Asset Turnover and Working Capital ratios for both BA and VA.
According to the above pattern (see Figure 12, table 7), both asset turnover and working capital ratios were declining and reached their lowest point in 2020. Furthermore, both had negative outcomes when compared to conventional criteria in the United Kingdom.
Solvency Ratio
A solvency ratio assesses the degree to which assets support future payment obligations, or liabilities. As shown in the graphic below, the solvency ratios covered in this section are the Debt to Equity ratio (see Table 9)and the Debt to Asset ratio see Table 8 (see Figure 13 ).
From the above diagram, the Debt to asset ratio for BA was increasing from 2016 to 2019 before a sharp increase in 2020. However, the same ratio was decreasing in VA from 2017 to 2020. This indicates that BA has a higher degree of leverage (percentage of total assets funded through debt as compared to VA.
Gearing Ratio
Gearing ratio is a financial ratio, which compare some sort of owner’s equity (or capital) to debt, or cash, borrowed by the company. The diagram below (see Figure 15, Table 10) shows the gearing ratios for the two companies. Both companies had reduced or lower gearing ratios compared to conventional standards across the 5 years.
Investment Appraisal/ Budgeting
In terms of financial performance, BA has been a good place to put your money. For example, prior to COVID-19, the corporation had a greater ROE of more than 5% and above when compared to VA. This demonstrated that the company provided a superior return on shareholders’ investments. However, based on the industry’s average results, other organizations were doing equally well or better. In this situation, the whole sector was participating a greater likelihood in economically advantageous flights. One of the reasons for the poor ROE from 2019 to 2020 might be the flying limitations imposed by the COVID-19 pandemic. However, as the industry average implies, both organizations should continue to benchmark with other competitors. As a result, capital budgeting is the ideal budgeting strategy to use in this case. Capital budgeting would make it easy for an investor to choose BA over VA because of the high return on investment for shareholders.
Recommendation and Conclusion
Every business wants to make money and compete positively in the market. Companies that take care of their workers, see them as a valuable asset, and use their appropriate abilities, on the other hand, always prosper in every way. Furthermore, in order to succeed in the market, good resource utilization with a modest approach is required. Every company has its own set of strengths and disadvantages. Those that succeed, on the other hand, never miss an opportunity to transform opportunities into strengths and threats into weaknesses through logical decision-making.
Reference List
BBC News. (2020) Virgin Atlantic to cut 1,150 more jobs. Web.
Brendel, W. T. and Chou, C. (2016) ‘Transforming organizational change through collaborative digital storytelling’, Journal of Educational Technology Development and Exchange, 9(1), pp. 13-28.
British Airways (2018). British Airways – Apprentices. Web.
British Airways (2019) Privacy policy: our privacy promise. Web.
Business Standard India. (2020). British Airways says COVID-19 pandemic likely to cost 10,000 jobs. Web.
Kondalkar, V.G. (2020) Organizational behaviour. New Age.
Mira, M.S., Yap, V.C. and Chan, K.T. (2019) ‘The impact of human resource practices on employees’ performance through job satisfaction at Saudi Ports authority based on the Assumption of Maslow Theory’, International Journal of Engineering and Advanced Technology, 8(5), pp. 245-253.
O’Neill, B. (2018) Developing future leaders at British Airways. In The Photofit Manager (pp. 72-89). Routledge.
Özsoy, E. (2019) ‘An empirical test of Herzberg’s two-factor motivation theory’, Marketing and Management of Innovations, 1(1), pp. 1-10.
Seely, S. (2020). What does it truly mean to put your people first? Web.
Virgin Atlantic (2022) Protecting our planet. Web.
Virgin Atlantic Careers UK. (2020). Leadership roles with Virgin Atlantic. Web.
Virgin Atlantic. (2021). Our people. Web.
Appendix A
Table 2: Describes the calculations of the current ratios based on values in table 1
Table 3: Describes the calculations of the quick ratios based on the values in table 1
Table 4: Return on equity calculated values
Table 5: Gross profit margin calculated values
Table 6: ROCE calculated values
Table 7: Total Asset Turnover and Working Capital
Table 8: Debt to Asset ratios
Table 9: Debt to equity ratios
Table 10: Gearing ratios