Executive summary
The purpose of this report is to investigate the position of Nordic American Tankers to suggest the bank about the application of loan. However, the recommendation of this report is based on few issues such as external business environment, adverse impact of global financial crisis on the company, the cash inflow and outflow, income statement of last three years, ratio analysis, external threats, and risks management plan. However, this company experienced strong financial situation in 2008, but the present condition is the worst and there is no future prospect at this stage. Therefore, this report suggests the bank not to sanction the loan to the company because of its disappointingly declining financial strength, deteriorating current ratio, weakening gross profit margin, dwindling net profit margin, diminishing return on assets (ROA), shrinking total assets turnover and return on capital employed, and increasing debt equity ratio.
Organizational Overview of Nordic American Tankers
Nordic American Tanker Shipping Ltd is a global tanker business that incorporated itself in Bermuda in early 1995; moreover, this company started to sell securities to the public in the United States from September 1995; however, according to NAT (2011), at present, these shares are also traded at the New York Stock Exchange (NYSE). This business owns Suezmax tankers and has agreed to acquire new buildings; conversely, it also runs diverse vessels, comprising of Gulf-Scandic, Nordic-Hawk, Nordic-Hunter, Nordic-Voyager, Nordic-Discovery, Nordic-Saturn, Nordic-Grace, Nordic-Moon, Nordic-Mistral, Nordic-Sprite, Nordic-Fighter, Nordic-Cosmos, Nordic-Passat, and Nordic-Vega; the firm joined three of these vessels in a 7-year bare-boat charter to British Petroleum immediately after delivery in 1997 with minimum guaranteed rate. However, NAT’s bye-laws constrained the firm from acquiring supplementary vessels or concluding other business during the charter to BP; as the charters were close to termination, Extraordinary General-Meeting was called to settle whether NAT should persist as an actively operating business; here majority of the shareholders voted to continue, and in October 2004 the charter to BP expired (NAT, 2010).
Nevertheless, NAT recently chartered sixteen out of seventeen vessels in the spot market pursuant to mutual arrangements with third parties; conversely, in 2010, it chartered other two vessels on bare-boat charters that terminated in June and October of 2010; additionally, Nordic-Harrier (former Gulf-Scandic) is redelivered to the corporation in October 2010 that went directly into dry-dock for repairs (NAT, 2010). The stock price chart of NAT below shows that after the recovery from the international economic slowdown of 2009 in early 2010, the firm is again facing a decline the share prices. This may be a result of the latent impact of the Eurozone crisis.
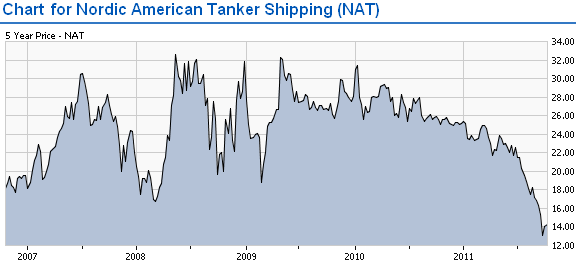
Researchers suggest that the impact of the Eurozone crisis will worsen in the upcoming months and result in even tougher trading conditions than that of the recession of 2009; this has reflected through NAT’s second quarter 2011 losses of USD 0.21 per share.
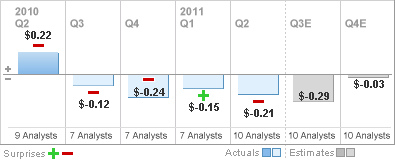
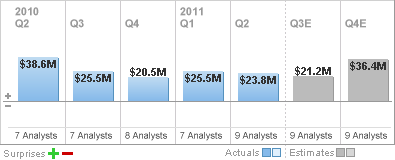
NAT has second quarter 2011 turnover of USD 23.8 million – although this is healthier than the USD 23.5m estimation of the nine analysts covering the firm, still this is 6.6 percent lower than the second quarter turnover of 2010:
External Analysis
Porter’s Five Forces Analysis of NAT
The financial position of Nordic American Tankers is not good enough and there are many external factors influence the business operation of the company; therefore, this credit analysis report concentrates on Porter’s five forces model to assess the tanker market.
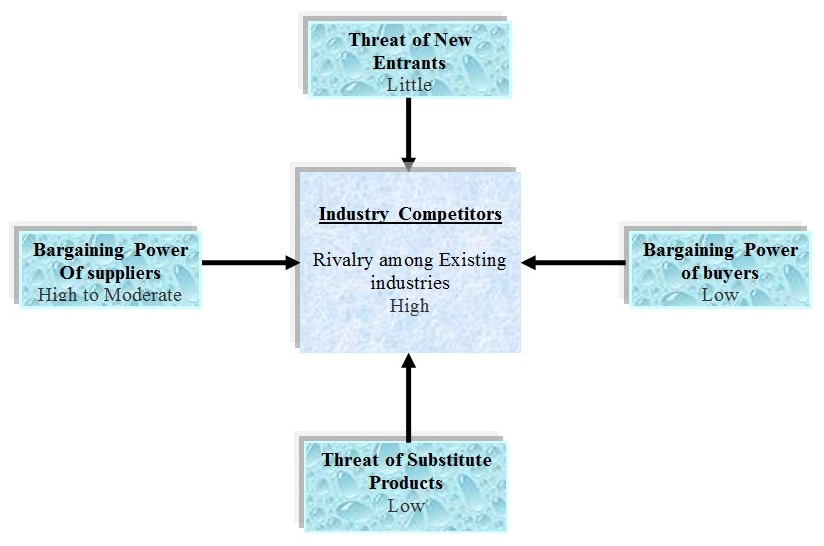
- Bargaining Power of Suppliers: According to the annual report 2010 of NAT, it has tried to build two new vessels to expand its business, but the suppliers are not providing prompt services; therefore the costs of the production are increasing, which indicates the bargaining power of suppliers are comparatively high to moderate;
- Bargaining Power of Customers: This power is comparatively low because of high switching off costs;
- Threat of New Entrants: According to the annual report 2010 of NAT, the entire industry faced severe financial problems and liquidity risks due to adverse impact global financial crisis; therefore, investors is not interested to invest for any loss project. In addition, the threats of new entrants in the tanker industry is lower while banks would not provide loan as most of the banks in liquidity crisis and other banks have no interest to take such risks though NAT (2010) reported that new companies have financial capabilities to capture the market share of NAT;
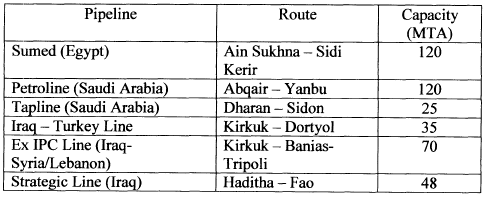
- Threat of Substitutes: Lee (2011) pointed out that many pipelines have already constructed for either transporting crude oil from oil fields to export terminals or delivering refined products, which can reduce the demand of Tanker if the companies ask high price for oil transportation. At the present moment, the threat of substitutes is comparatively low because pipelines construction involves huge capital expenditures and pipelines are highly vulnerable to act of sabotage, but investors may invest if they estimate that passing through the canals save time and costs; however, the following figure shows some routes of pipeline in Arabian zone –
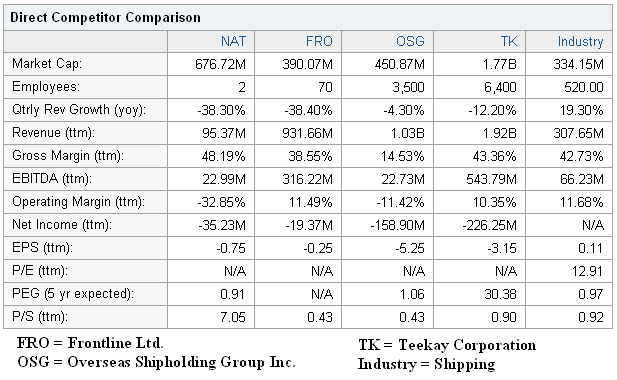
- Competitive Rivalry: According to the Yahoo Finance (2011), Industry rivalry is relatively high for this company which Overseas Shipholding Group Inc., Frontline Ltd., Teekay Corporation and other companies are offering crude oil transportation services along with similar cost effective strategies and service facilities.
SWOT Analysis of Nordic American Tankers
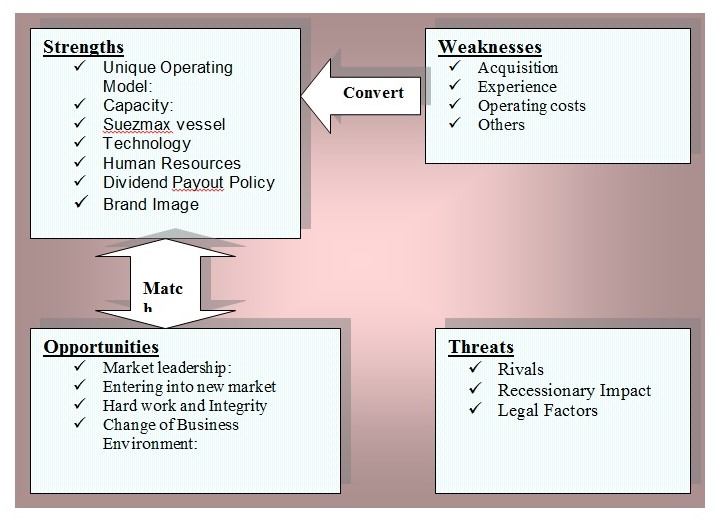
Strengths
- Unique Operating Model: Ellefsen (2011) stated that NAT has a unique operating model, which differentiates the company from the competitors of this industry;
- Capacity: It has only one type of vessels that is suezmax vessel, which can carry 1 million barrels of oil though it has very large crude carriers (VLCCs) with capacity of deadweight tons (DWT) 300,000 tones);
- Suezmax vessel: Ellefsen (2011) pointed out the advantages of these vessels and stated that suezmaxes are earning between $7000 and $14000 every day dependent on the route and he estimated that average earning from these vessels is about $11000;
- Brand Image: NAT has already established company and created brand image successfully in the global tanker market,
- Human Resources: however, human resource management plan of NAT is excellent, which helps the company reduce operating costs;
- Dividend Payout Policy: It has a full dividend payout policy, which designed by the Board of Directors; however, it paid dividend of $0.30 per share in the second quarter 2011;
- Technology: In order to ensure safety, technology plays vital role for NAT;
- Routes: NAT has business operation in most of the long haul trade routes.
Weakness
- Acquisition: NAT (2010) reported that NAT may not be able to expand or to successfully manage the company if the management failed to identify suitable tankers for acquisition or effectively integrate any acquired tankers;
- Experience: As the company incorporated in 1995, this company has not long experience to operate in competitive shipping industry. Therefore, the decision-markers failed to hold their strong financial position for the long-time;
- Operating costs: According to the annual report 2010 of NAT, its operating expense was more than $125.63 million whereas this cost was about $106 million in 2008, which is another problem of the company to gain profit;
- Others: At the same time, other weaknesses of the company are secondhand vessels, older vessels, and volatility of crude oil price, adverse economic position, decrease earnings and dividends per share, restrictive covenants which limit our liquidity and corporate activities, potential disruption of shipping routes because of accidents or political events, tanker market can change rapidly and unpredictably, volatility in LIBOR rates and so on.
Opportunities
- Market leadership: Nordic American Tankers has the opportunity to capture market leading position in near future if they get sufficient loan from the bank or other investors invent for the future development and expand business all over the world; however, they need to use the fund properly.
- Entering into new market: Lack of Tankers to provide service is one of the weaknesses of NAT, but this company can easily enter in new market by following acquisition strategy and can expand business in true sense; however, it agreed the acquisition of its eighteenth vessel in 2009;
- Hard work and Integrity: This Company has opportunity to maximize its annual profits by working hard with honesty; therefore, the management of NAT needs to implement corporate strategies and follow independent auditors’ report. In addition, NAT has to follow the new disclosure requirement of Financial Accounting Standards Board (FASB) in order to attract shareholders, banks and other investors by disclosing real information about the company;
- Change of Business Environment: According to the annual report 2010 of NAT, the financial position of this company was outstanding in 2008 and the company can regain their position if this company get suitable business environment.
Threats
- Rivals: The competitors of new market enter with excellent financial strength and there are many strong competitors established their companies in global market; as a result, it is considered one of the most difficult problems for the business operation of Nordic American Tankers. However, the biggest oil tanker operating companies like Overseas Shipholding Group Inc., Frontline Ltd., Gemini Tankers LLC, and Teekay Corporation are the main threat of NAT (Yahoo Finance, 2011);
- Impacts of Recession: According to the report of yahoo Finance (2011), the position of entire shipping industry is under threat due to adverse impact of global financial crisis and there is no company in this industry, which operates without financial risks; therefore, the company experienced severe loss in the fiscal year 2010. In addition, recession can hit the market in the future; however, the following figure shows the financial and competitive position of the key players in shipping industry:
- Legal factors: Frequent change of law is another barriers for the NAT because new creates hindrance in the business operation system and increase costs, for example, foreign companies would be considered passive foreign investment company (PFIC) in the US market and they have to pay more tax than the local companies and this status would impose over burden for the foreign companies. However, there is a chance that IRS or a court of law declared NAT as a foreign company, then it needs to pay tax under this new law and company would fall under severe problems as new tax system would be counted from 2005;
- Demand: On the other hand, many other external factors such as changes in demand in the tanker market along with demand for oil and oil products, supply and demand for tanker capacity are also threats for the company;
- Other: In addition, NAT needs to consider other factors such as changes in OPEC’s petroleum production levels, excessive operating expenses, vessels breakdowns, and so on.
Corporate level strategy
It is noteworthy that in the pace of globalization and rapid industry growth, NAT is to some extent unsuccessful to match up with its competitors and engage in more trading activities that can result in massive growth. Nevertheless, owing to a disappointingly declining financial strength and weakening ratios, it would be nearly impossible for Nordic American Tanker to growth through acquisitions with other companies, as this require loads of investments. In addition, presently, it has not undertaken any joint venture strategies to boost its growth.
Business level strategy
Nordic American Tanker’s business level strategy is to improve and expand its current facilities and service in terms of enlargement of its vessels like Nordic-Hawk, Nordic-Hunter, Nordic-Voyager, Nordic-Discovery, Nordic-Saturn, Nordic-Grace, Nordic-Moon, Nordic-Mistral, Nordic-Sprite, Nordic-Fighter, Nordic-Cosmos, Nordic-Passat, and Nordic-Vega, and diversifying in some other forms of storage and shipment, which are heavily reliant on superior technologies. Moreover, it also focuses on integration of cloud computing and extra IT amenities in its day-to-day operations. It estimates that with the strategy to include better IT infrastructural facilities, the operational costs of the company will greatly reduce helping the business to achieve economies of scale and attain cost leadership.
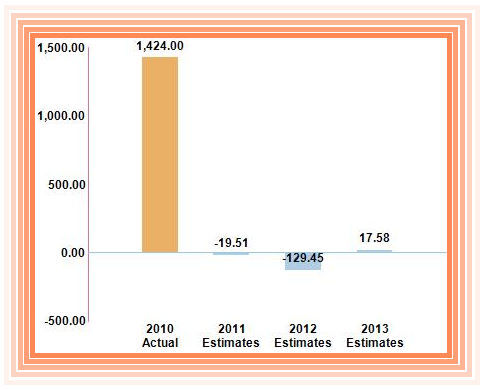
Corporate Forecast of Nordic American Tanker
The following chart shows the growth projections of the Nordic American Tanker by assessing a number of phases through which an illustration of the financial position of the firm in the next five years would be achievable to evaluate the prospect of lending the loan. This provides a guesstimate approach of what the likely position of the business would be in the upcoming five years. Some analysts has anticipated that due to the adverse impact of the Eurozone crisis over the economy of the countries in which Nordic American Tanker operates, the expenses of the day-to-day running can possibly increase. These possible increases in expenses, coupled with rising inflation rates, will nearly double the corporate expenses, further worsening the company’s cash flows. The chart contains a comparison of the future growth of the company in contrast to the industry:
Table 1: Upcoming Growth Projections
The table below shows the sales or turnover projections of the Nordic American Tanker for finding out that how strong will be the company’s position in future and whether it would be a good decision for the bank to lend the finance:
Table 2: Turnover Projections of Nordic American Tanker
In addition, it is important to note that the earning projections of the Nordic American Tanker will greatly influence the decision-making regarding the loan; the table below contains the company’s future earning positions:
Table 3: Earning Projections of Nordic American Tanker
Price or earning ratios have extensive uses for stock appraisal calculations; the graph below shows the projected trends in this ratio of Nordic American Tanker for a better understanding of the company’s position in the upcoming periods:
Considering all the factors discussed above, it is important to state that owing to worsening financial prospect in the upcoming years, it is unlikely for NAT to enter into new markets with the help of its own resources. Therefore, in order to expand its business outside the existing markets, it would be necessary for the company to rely on the bank loan, which is also quite doubtful to come about due to the unpleasant financial situation.
The data provided below shows an evaluation of the difference between the future anticipations of NAT for financial year 2011 regarding its own valuation, opportunities, balance sheet, margins, and growth provided earlier and score of it actual performance in 2011. It is notable from the chart that NAT’s total score is four out of nine, as it has remained unsuccessful in most of the predictions:
Table 4: – Evaluating the difference between anticipation and real performance
Financial Assessment
Quarterly Financial Overview
In contrast to the same quarter of financial year 2010, NAT’s newly reported quarterly turnover shows a plunge from USD 38.6 million to USD 23.8 million; this, besides of a boost in the cost of goods sold outlay has escorted to a decline in the sub structural column from sprawling of USD 7.9 million to loss of USD 10.0 million:
Table 5: Quarterly Financial Overview 2011 of NAT
Table 6: Financial Overview 2008 to 2010 of Nordic American Tankers
Current ratio
Table 7: Working Capital and Current Ratio analysis of Nordic American Tankers
Current ratio is a common and quick evaluation of liquidity of Nordic American Tankers, as it shows the margin of safety or cushion accessible to the creditors; moreover, it is an index for NAT’s financial stability and practical solvency and a directory of the strength of its working capital. As shown in the table above, from 2008 to 2010, there has been a sudden decrease in the current ratio of Nordic American Tankers (15.14628259 in 1999, 16.18223201 in 2000, and 10.24349442 in 2001). Although the current ratio increased in 2009, it fell again in 2010. As this kind of fall in the ratio demonstrates the deterioration of the liquidity position of the business, it is notable that the liquidity position of Nordic American Tankers had fluctuated and then weakened over these three years. On the other hand, if there was a boost in the current ratio, it was quite natural that the liquidity position of the business had strengthened with time and that it should be viable for the bank to lend the money to the company. However, as the liquidity position of Nordic American Tankers is deteriorating, it is likely to affect adversely a positive decision from the bank regarding the loan.
Gross Profit Margin
Table 8: Gross profit margin of Nordic American Tankers
The gross profit margin is the proportion of the turnover, which a business preserves following the direct-expenses linked to generating the materials traded throughout a certain period; moreover, a rising profit margin means that the firm has good pricing strategy (it is able to lift prices with small or no effect on sales) or that it possesses a rising productivity. However, as illustrated in the table above, there has been a substantial decrease in the gross profit margin from 2008 to 2010, which were consecutively 79.98, 58.11, and 62.73 – decreasing margin could indicate that variable costs have risen while selling price has remained constant; it could also mean that NAT has cut prices to make an augmentation in sales. It is important to argue that even though in 2010, the gross profit margin has increased in contrast to the previous year’s gross profit margin; still it is quite lower than that of 2008. Moreover, some analysts suggested that owing to the upcoming financial downturn, it is unlikely that this gross profit margin will strengthen for the business in the next few years. Under this circumstance, it is not wise for the bank to consider this gross profit margin with an optimistic view, and rather, it should re think a number of times before sanctioning the loan based on the GPM.
Net Profit Margin
Table 9: Net profit margin
High net profit margin ratio shows how successful the firm is at changing sales into profit, and that the firm is capitalizing on some competitive-advantage, which can give it some additional capability and suppleness throughout the difficult financial periods; conversely, low net margin means the firm is not generating enough sales or it is not keeping your operating-expenses under control. It is quite surprising that for Nordic American Tankers, throughout 2008, 2009, and 2010, the net profit margin has decreased so much that it took on a very low figure (52.1245614 in 2008 decreased to 0.813701053 in 2009, and 0.639950639 in 2010). Such a decline in the net profit margin ratio throughout the three stated financial years might point out cost binges, which necessitate competence development; in addition, the Nordic American Tankers, having a low ratio, might need to take on debt to pay its expenses. All these factors indicate that once again it is not a practical or proficient decision for the bank to lend the fund.
Debt Equity Ratio
Table 10: Debt Equity Ratio of Nordic American Tankers
This ratio is an appraisal of firm’s financial power projected by dividing its total liabilities by shareholders’ equity; it specifies what proportion of equity and debt the firm is using to finance its assets; a high ratio commonly denotes that a firm was antagonistic in financing growth with debt; so, this can result in volatile earnings because of additional interest-expense. The above table demonstrates that in 2010, the debt equity ratio of Nordic American Tankers was quite greater than the past two years; so, presently, its position is not quite strong in terms of debt equity ratio to allow the loan.
Liabilities to assets ratio
Table 11: Liabilities to assets ratio
The liabilities to assets ratio declines while cash or account obtainable balances reduce, devoid of an equivalent diminish in current-liabilities, or boost in a current liability devoid of an equivalent boost in cash or accounts obtainable (for example, cash spent to buy fixed assets, cash spent to give off a long- term debt, or cash spent to disburse dividends). From 2008 to 2009, the liabilities to assets ratio diminished respectively from 0.031075911 to 0.013199124 and it again recovered to 0.083214306 in 2010; this shows that although Nordic American Tankers has a better liquidity ratio than the previous year, the liquidity position needs further amplification, without which the bank may not allow substantial fund to the firm. However, if the acid- test ratio of the firm is also showing such an increase, then the banker will get a hiker based on which the loan can be granted. Acid- test ratio is a rigid meter that settles on whether a business has an adequate amount of quick-fix assets to cover up its urgent liabilities devoid of selling inventory; in addition, this test ratio is lot more exhausting than that of the working capital ratio, principally since the working capital ratio permits the insertion of inventory assets. It is essentially notable that firms with acid- test ratios lower than one may not reimburse their current-liabilities; so, investors must consider investing on such a business with intense level of vigilance; additionally, if the acid- test ratio is quite lower than the working capital ratio, this indicates that current- assets are greatly reliant on inventory.
Return on assets (ROA)
Table 12: ROA of Nordic American Tanker
From 2008 to 2010, return on assets (ROA) of the company decreased consecutively from 15.01687, 0.32031, to 0.1302; conversely, it is arguable that ROA is a meter of how lucrative a corporation is comparative to its total assets, and increasing ROA gives an idea that the firm is competently handling its assets to engender earnings. Therefore, once again, this ratio is not quite attractive to the banker.
Total assets turnover
Table 13: Total assets turnover
Total assets turnover of Nordic American Tankers has lowered successively from 0.280140267 and 0.131389067 to 0.116718663; it is notable that asset turnover considers a business’s competence in utilizing its assets in creating an augmentation in the income – the superior the figure the better; consequently, again, this ratio is not satisfactory to convince the banker.
Return on capital employed
Table 14: Return on capital employed of Nordic American Tanker
As demonstrated in the table, return on capital employed of the firm has lowered gradually throughout the three years; however, before lending a loan, the banker always expects this ratio to be superior to the rate at which the firm borrows, or else an augmentation in borrowing would lessen stockholders’ retributions.
Long-Term Debt to Assets Ratio
Table 15: Long-Term Debt to Assets Ratio
Long-term debt to assets ratio of Nordic American Tankers has lowered sequentially from 0.084376034 to 0.01366017; as a reduction in this ratio indicates that the corporation is increasingly becoming less dependent on debt to grow its trading activities, this would seem quite convincing to the banker for considering funding its operations.
Long-Term Debt Ratio
Table 16: Long-Term Debt Ratio of Nordic American Tanker
The table above shows that the long-term debt ratio of the firm has lowered steadily from 2008 to 2010 (that is from 0.087 to 0.015); it is noticeable that as a firm with a higher ratio is considered riskier than one with a lower ratio, this seems to be a positive side of the business.
Risk Assessment
According to the annual report 2010 of NAT, this company faces many challenges those adversely affect the securities market, business operation, financial statements, and business structure of the company; however, this report includes following risk factors:
- Cyclical Industry: The tanker industry is both cyclical and unstable particularly in case of charter rates and profitability; therefore, NAT experienced loss if any sector of its operation hampered for external business environment.
- Supply and Demand for Tankers: This is one of the most important and unpredictable risk factors that influence the company and there are many significant factors include demand for oil and oil products, national and international economic and political circumstances, the distance oil and oil products, the number of tanker, demand for vessels and services in transporting oil, the price of steel and vessel equipment, technological advances;
- Global Financial Crisis: According to the annual report 2010, global economic downturn has changed the business environment and it is considered one of the most significant risk factors for the company. However, the share price in stock market is decreasing though company received credit facilities;
- Unable to Pay Dividend: NAT operates a fleet of 17 vessels and acquire two new building vessels to control the spot market, but this market is very volatile along with challenging because company can meet corporate commitments if charter rates decrease;
- Acts of piracy: These incidents always affected ocean-going commercial vessels specifically in the South China Sea and Gulf of Aden off the coast of Somalia, for instance, tanker vessel M/V Sirius Star was carrying crude oil captured by pirates in the Indian Ocean, which increased costs for premiums payable, and decreased cash flows;
- Fuel Price: Fuel is unpredictable and fluctuates based on events, which negatively affects this industry, and this problem has no solution to the companies as it is international issues;
- Environmental Factors: Many countries are committed to reduce greenhouse gas emissions by following legal framework and the articles of Kyoto Protocol, which adversely affects on profits generation and strategic growth opportunities;
- Repair Costs: Unexpected events increase repairing costs of this company because vessels will be at risk of being damaged or lost due to events for instance tankers are exposed to a higher risk of damage and loss by fire, terrorist attack, collision, marine disasters, human error, war, bad weather and other acts of God. However, The costs of dry-dock repairs are unpredictable;
- Delay: The US Coast Guard issued regulations intended to enhance vessel security and impose additional financial and legal obligations as international shipping is subject to security and customs inspection; however, it may cause delay in the loading, offloading or trans-shipment, which is another reason to increase legal costs;
- Safety Issues: the ISM Code imposed over burden on the shipping industry in terms of development of “Safety Management System”; thus, violation of this ISM Code may invalidate existing insurance, and increase liability of the company;
- Value of Vessels: decrease in the value of tanker could affect on investment, financial statement, stock market and so on;
- Other factors: Other risk factors include political instability, terrorist or other attacks, the smuggling of drugs or other contraband, requisition of vessels by the Government during a period of war or emergency, less fuel-efficient older vessels, increase rates of Cargo insurance, unable to borrow or raise funds for vessel replacement, volatility in LIBOR rates by 0.70% to 1.20%. At the same time, the risks of NAT would increase because of temporary emergency regulations of the US Securities and Exchange Commission (SSE), inherent operational risks, insurance may not be adequate to cover losses, non-cooperative attitude of the foreign countries, exchange rate fluctuations, subject to taxes in Bermuda after 2016, PFIC beginning with the 2005 taxable year and so on.
Recommendation
In the previous sections of this report have considered strategies of NAT, strengths, weakness, opportunities and threats, Porter’s five forces, financial position, and risks assessment in order to find out the prospects of the company. However, I have recommended my bank not to sanction loan to NAT considering following factors:
- Recessionary impact on the company was severe and it is difficult for the company to recover from this situation with this loan;
- There is a chance to be bankrupt;
- Volatility of fuel price, terrorist attacks, exchange rate, political and economic factors;
- The company would not gain its position due to PFIC rules and other regulations;
- Moreover, cash flow statement, balance sheet and income statement are not impressive
In this context, it is strongly recommended to the bank for not allowing any financial support to the Nordic American Tanker, as the prospect of this business is incredibly deplorable. To specify particularly, this firm is currently suffering from poor cash flows and worsening financial ratios (for example, current ratio, GPM, NPM, return on assets, total assets turnover, return on capital employed, and escalating debt equity).
Reference List
Bloomberg Businessweek. 2011. Nordic American Tankers Ltd (B3o:Berlin). Web.
Ellefsen, Jacob. 2011. Nordic American Tankers Limited (NYSE:NAT) – A different company with a strong balance sheet and a unique operating model. Web.
Fool. 2011. Is Nordic American Tankers the Perfect Stock. Web.
InvestorGuide. 2011. Nordic American Tanker Shipping (NAT). Web.
Lee, TaeSoo. 2004. The Dynamics of the Oil Tanker Industry. Web.
NASDAQ. 2011. Stock Research – Analyst PE estimates. Web.
NASDAQ. 2011. Stock Research – Earnings forecast. Web.
NAT. Annual Report 2010. Web.
NAT. 2011. Nordic American Tankers: Overview. Web.
Yahoo Finance. 2011. Direct Competitor Comparison. Web.
Yahoo Finance. 2011. Nordic American Tanker Shipping Ltd: Analyst Estimates. Web.