The current study employs a quantitative design to explore the relationship between demand and supply in the Hawaii housing market. The independent value is housing supply, and specifically, the number of residential units constructed annually between 1993 and 2015 and annual commercial building permit value between 2002 and 2013. The scarcity of available official online reports has put constraints on the quality and quantity of data. It was impossible to locate the exact numbers of commercial building permits per year, which is why their value was chosen to provide an insight into the economic health of the housing market.
The dependent variable is housing demand that is interpreted differently in economic literature. One interpretation is the number of houses purchased annually, the retrieved data on which spans between 2008 and 2015. However, a more insightful interpretation of demand is the number of households and, in particular, a change in the number of households (%) as they reflect socioeconomic and demographic trends in a more precise manner. Household growth is not the same as population growth as these two variables do not always move in the same direction. New households emerge for various reasons, including grown children leaving their childhood homes, divorces, separations, and new migrants setting up residence.
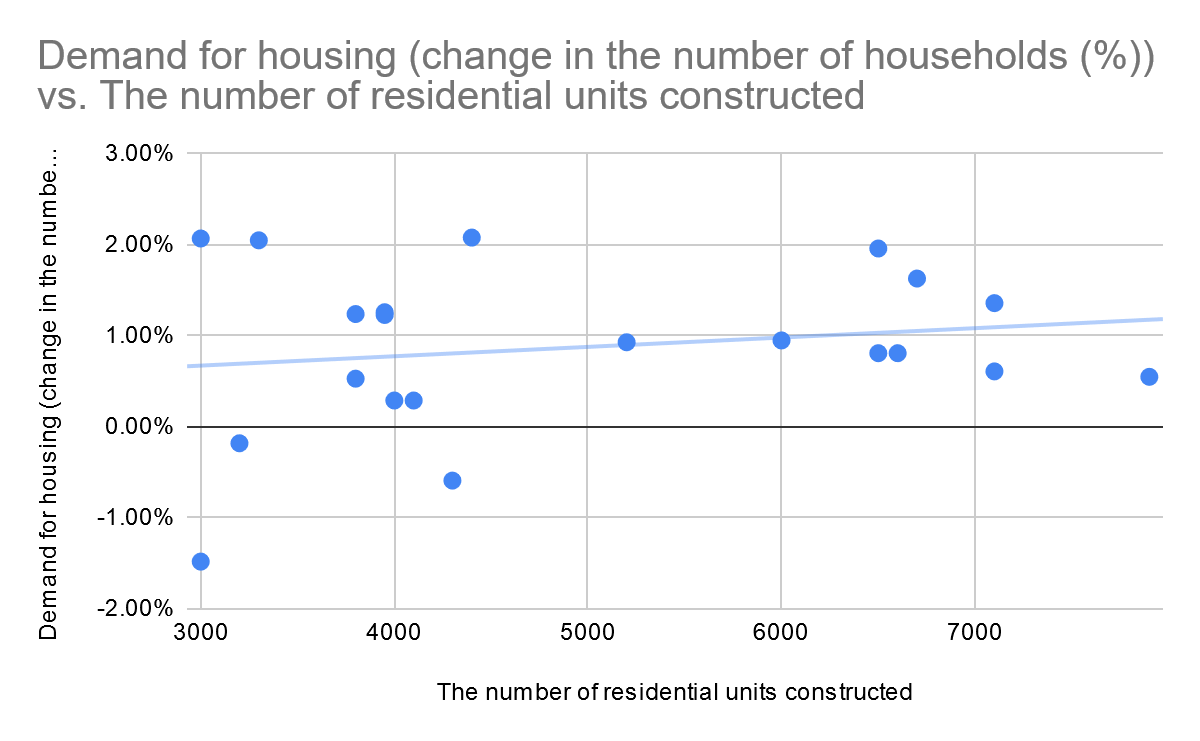
This study uses linear regression modeling, a statistical approach that helps to identify a relationship between a scalar response (or dependent variable) and one or more explanatory variables (or independent variables). The first case for analysis is the association between the number of residential construction permits and the change in the number of households between 1993 and 2015 (see Graph 1). Graph 1 shows a slight positive relationship between variables, however, the breakdown of data analysis makes us reject the alternative hypothesis (R^2 < 0.7, p > 0.05). Therefore, there is no significant relationship between how many units are built and how many new households form in Hawaii.
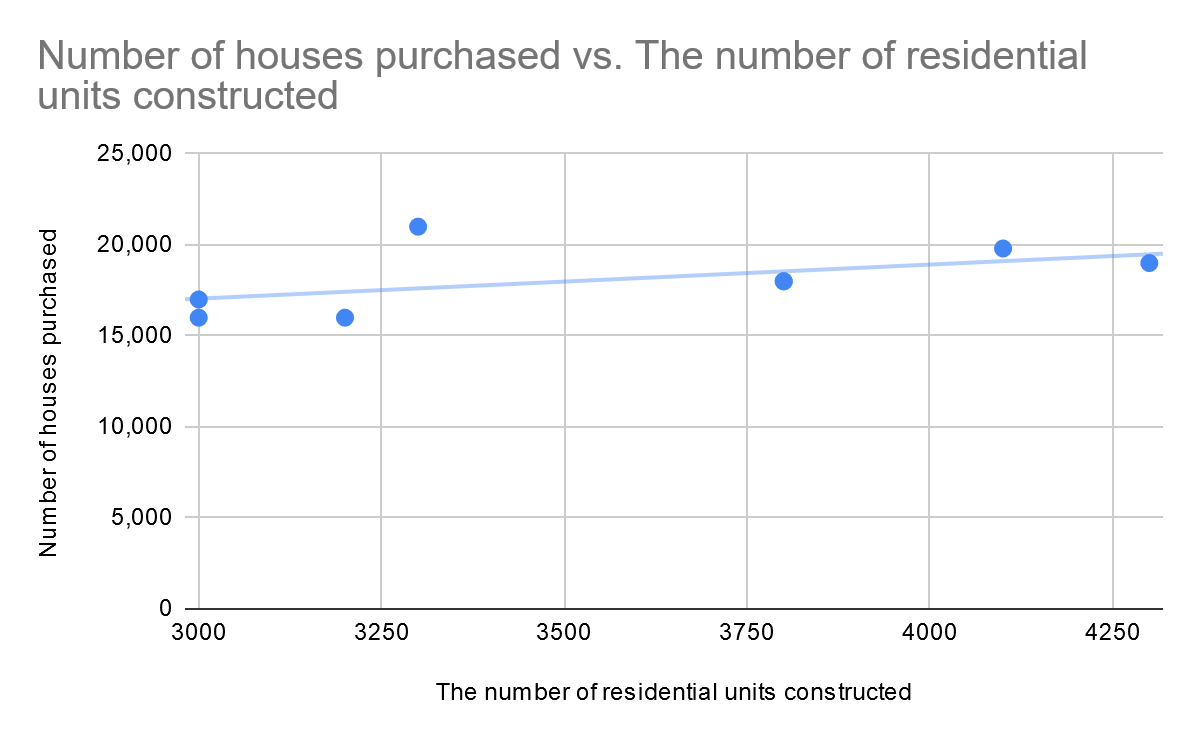
The relationship between the number of residential units constructed and the number of houses purchased is somewhat stronger, as there is a 95% chance that the regression slope is not zero (p = 0.05). However, the R^2 value showing the fitness of the model to the data provided equals 0.28, which is too low to speak of any significant relationship (Graph 2). Likewise, the value of construction permits affects neither the changes in household numbers (R^2 = 0.22, p = 0.5) or the number of houses purchased (R^2 = 0.06, p = 0.002). To conclude, the null hypothesis is confirmed: increasing the supply of housing units does not lead a spike in demand in the Hawaii housing market.