Introduction
The present report was commissioned by the president of People’s Choice Bank. The People’s Choice Bank is a small community bank with three local branches in Blue Ash, Delhi, and Anderson Hills. The purpose of the present report is to analyze the cash flow of People’s Choice Bank using the database of transactions in August. The data was analyzed using pivot tables in Microsoft Excel 2016.
Summary of Cashflow by Branch
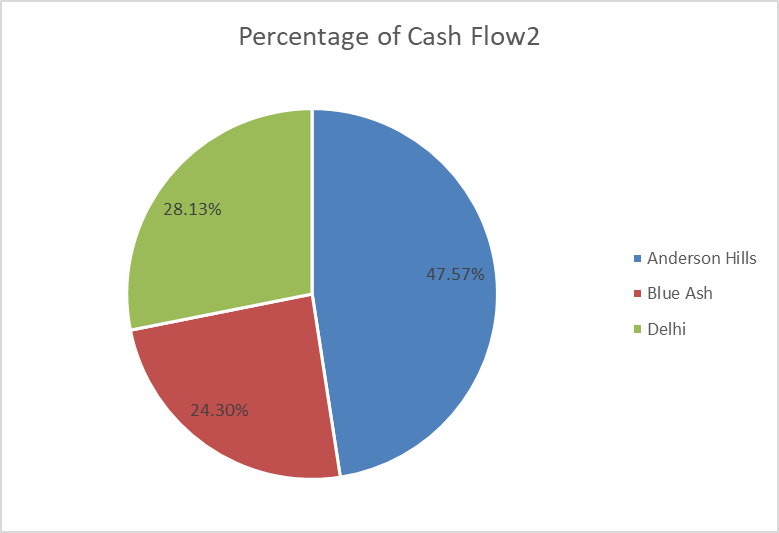
This section summarizes cash flow data from three divisions of People’s Choice Bank in August. The analyses revealed that the Anderson Hills branch had the highest cash flow among the three branches, while the Blue Ash branch had the lowest cash flow. In particular, Anderson Hills had a net cash flow of 1,877,970, which accounted for 47.57 % of the bank’s cash flow, while the Delhi branch had accounted for 28.13% of cash flow, and the Blue Ash branch accounted for 24.3% of cashflow. This information is summarized in Figure 1 below.

The maximum and minimum cash flow from a single transaction were similar among all the branches. The detailed results of the analysis are demonstrated in Table 1 below.
Table 1. Cashflow analysis by branch.
Efficiency Analysis
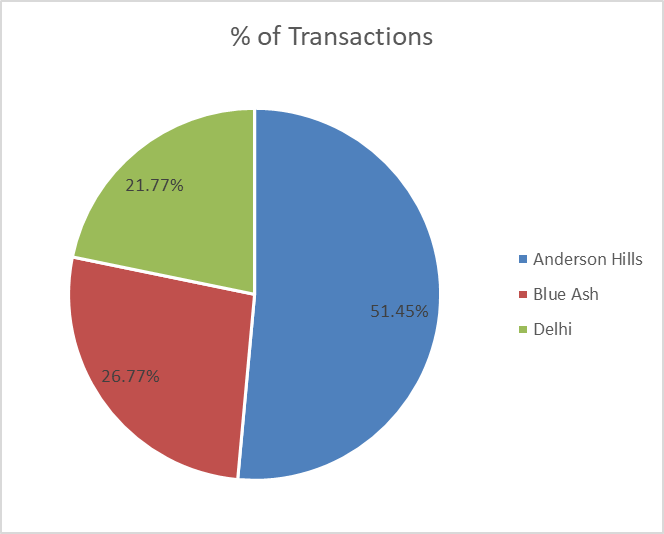
This section of the report aims at analyzing the efficiency of all the branches. Efficiency is understood as an average of cash flow for a single transaction. To start the analysis of efficiency, the number of transactions by branch was analyzed. The results revealed that Anderson Hill had the highest number of transactions in August (51.45%), while Delhi had the lowest number of transactions (21.77%). The percentage of transactions by the branch is provided in Figure 2 below.

The distribution of the number of transactions was inconsistent with the distribution of cash flow. In particular, while 51.45% of transactions were registered in Anderson Hill, only 47.57% of cash flow was attributed to the branch. Similarly, the cash flow of Blue Ash (24.3%) was disproportionate with the number of transactions (26.77%). Finally, the percentage of transactions attributed to Delhi was 21.77%, while the branch had 28.13% of cash flow. Further analysis demonstrated that while Anderson Hills and Blue Ash had similar cashflows per transaction, Delhi was outperforming the other two branches by 40%. This implies that Delhi’s efficiency was the highest among the three branches. The details about the analysis are provided in Table 2 below.
Table 2. Efficiency analysis by branch.
Trends in Cashflow
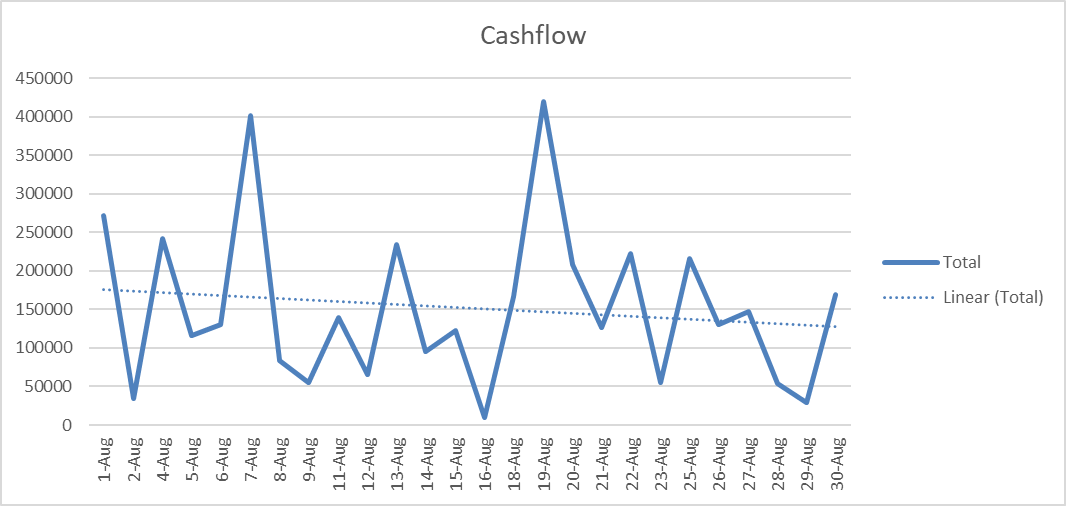
Historical analysis was used to understand the tendency in the cash flow of the company. Thus, a graph was created to observe the daily fluctuations in net cash flow in August. A trendline was added to the graph to make predictions for future changes in the cash flow. The standard method for constructing a trendline in Excel is linear regression analysis, which is one of the most frequently used approaches to forecasting cash flow (Shields, 2018). The historical data is visualized in Figure 3 below.

Observations of Figure 3 led to two conclusions. First, cash flow was always the highest on Mondays, while Saturdays were not associated with significant changes in cash balance. Second, the overall trend in the daily cashflows was negative. In other words, if the current tendency remains unchanged, average daily cashflows will continue to decrease. Cashflow by date is presented in Table 3 below.
Table 3. Cashflow by date.
References
Shields, G. (2018). Business valuation: The ultimate guide to business valuation for beginners, including how to value a business through financial valuation methods. CreateSpace Independent Publishing Platform.