Population means a whole group that is under investigation (Anderson, Sweeney, and Williams, 2009). As a result, we select a sample that is representative of the population. We associate the statistics of the sample to the population. Calculation of Sample means depends on the population from which they are drawn. The distribution of the mean is also normally distributed for all random samples taken at intervals from the population when a population has a normal distribution. On the other hand, when the population distribution is not normal, the theorem of the central limit is applied in the estimation of mean. It is a well known fact that as the sample size, n, increase, the sampling distribution of mean changes shape and looks more like that of the normal distribution and less of the population.
General statistics assumes that the distribution of sample means can be estimated by a normal distribution whenever the sample size (n) is 30 or more. The sampling distribution of mean for strongly uneven date becomes more normal as the sample size increases. For normal population distribution, the sample means are normally distributed (Anderson, Sweeney, and Williams, 2009). If the distribution is close to normal, the mean distribution will be approximately normal for small sample sizes. Lastly, if the sampling distribution is not normal, one may be required to increase the sample sizes to provide satisfactory estimates for the population distribution.
The following diagrams demonstrate central limits theorem;
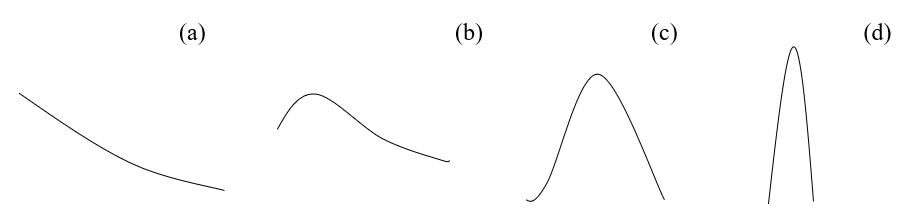
Diagram (a), represent a population distribution with, n=2, diagram (b), n=5, diagram (c), n=10 and diagram (c), n=30. This demonstrates that as the sample size increases, the distribution of mean become more normal.
Confidence intervals represent a standard way of measuring precision for estimates of values calculated from a given sample of data. They usually give estimate range in which a given parameter may lie. Confidence intervals are used along confidence levels which shows how certain one is that the observed parameter lie between the intervals. The range of confidence interval describes to what extent certain about a given population parameter (Anderson, Sweeney, and Williams, 2009). For example, a measurement 10 plus or minus 3, with 95% confidence; this means we are 95% certain that the parameter lies between 7 and 13.
Precision in confidence intervals is regarded important. Large confidence intervals may increase your confidence in the parameter, but give you a low precision. To measure the extent of precision, we examine the width of confidence intervals. The higher the confidence levels, the wider the confidence intervals. This lowers precision.
Dispersion is one of the major ways to determine precision. Precision will vary as a function of standard deviation in uneven distributed population. Larger sample sizes leads to smaller standard deviation and narrower confidence intervals. The width of the confidence interval decreases with the increasing sample size. The larger the sample size, the narrower the confidence intervals. Significance testing is related to confidence intervals. If the given estimated parameter at 95% confidence level, does not fall in the confidence interval, then it means that the estimated parameter is significant at 0.05 (1-0.95). On the other hand, if the confidence interval has a null value, then it means that there is no statistical significance at the given level of confidence.
Reference
Anderson, D. R., Sweeney, D. J., and Williams, T. A., (2009) Essentials of statistics for business and economics, New York: Cengage Learning,