Review of Literature
Historical Perspective
Procedures and rules for manufacturing cost accounting have grown in significance since the Industrial Revolution, when manufacturing became a key economic activity. This growth has resulted in managers becoming more and more distant from shop-floor activities. According to Riggs (1994), it was during this time that managers began to “question things like what does a product cost, how efficient is a section of the manufacturing department, should a product be redesigned, or phased out, or promoted more aggressively than a related product.” Most of today’s standard cost accounting procedures were developed prior to 1925. According to Riggs (1994), “these procedures are built around three product expenses: direct material, direct labor, and overhead.”
During that time period, overhead was low when compared to direct labor and material, resulting in product costs that were dominantly variable. Because of that, cost accounting procedures that were developed then provided relatively useful information to managers. Riggs (1994) states that since that time period, manufacturing has changed a great deal, but unfortunately not much has changed regarding cost accounting procedures. Although it has become progressively less satisfactory, industry standard still defines product expenses by using direct material, direct labor, and overhead.
Introduction
There are a lot of things that you should know about Quality Management in manufacturing. Quality management, also known as QM, is one of the popular forms of improving the production and quality results not only within the workplace, but also in the final products which are eventually delivered to the customers. This article discusses some of the things that you need to know about total quality management in manufacturing.
First of all, you need to know the mission and purpose of quality management. The whole idea of quality management is to find ways to improve the quality of return (to satisfy the needs of the shareholders of your company), to focus on the quality of the products which are produced by your company, and also to improve the quality of life. In regards to quality management, the quality of life refers to the environment of employees within the workplace, and also outside of the workplace. Essentially, quality management is a way to focus on the organization and participation within your company in order to meet the needs of customer satisfaction, and also to meet the needs of satisfaction for all members within the company. Another thing that you should know if that total quality management can prove very beneficial to your business. Total quality management can improve the customer reviews and ratings which you receive, because of the high-quality products which you are able to produce through total quality management. In addition, total quality management is also effective and beneficial because it improves the level of production for your employees. However, you should be aware that in order to boost morale and get employees excited about total quality management, you may have to add other incentives, such as a salary or wage increase. Therefore, some of the side effects of this management system can be a little costly, albeit that they can prove successful in the long run.
In addition to all of these positive benefits, there is another aspect of total quality management which you also need to know. Lately, some researchers and specialists have begun to question is total management control is really the best option for management. Some current researchers have argued that total quality management is actually on the decline, and it appears to be a fad that was left- over from the 1990s. Even in the late 1990s, the power and influence of total quality management had begun to slow down. In fact, in some areas, it appears that total quality management was thought of negatively. Some individuals today think that total quality management still has value and promise, but it is now better used in conjunction with other management theories and techniques, such as Reengineering. Others find that some of the core management concepts of total quality management can still find application, although the whole system may not be as useful in a 21st-century environment.
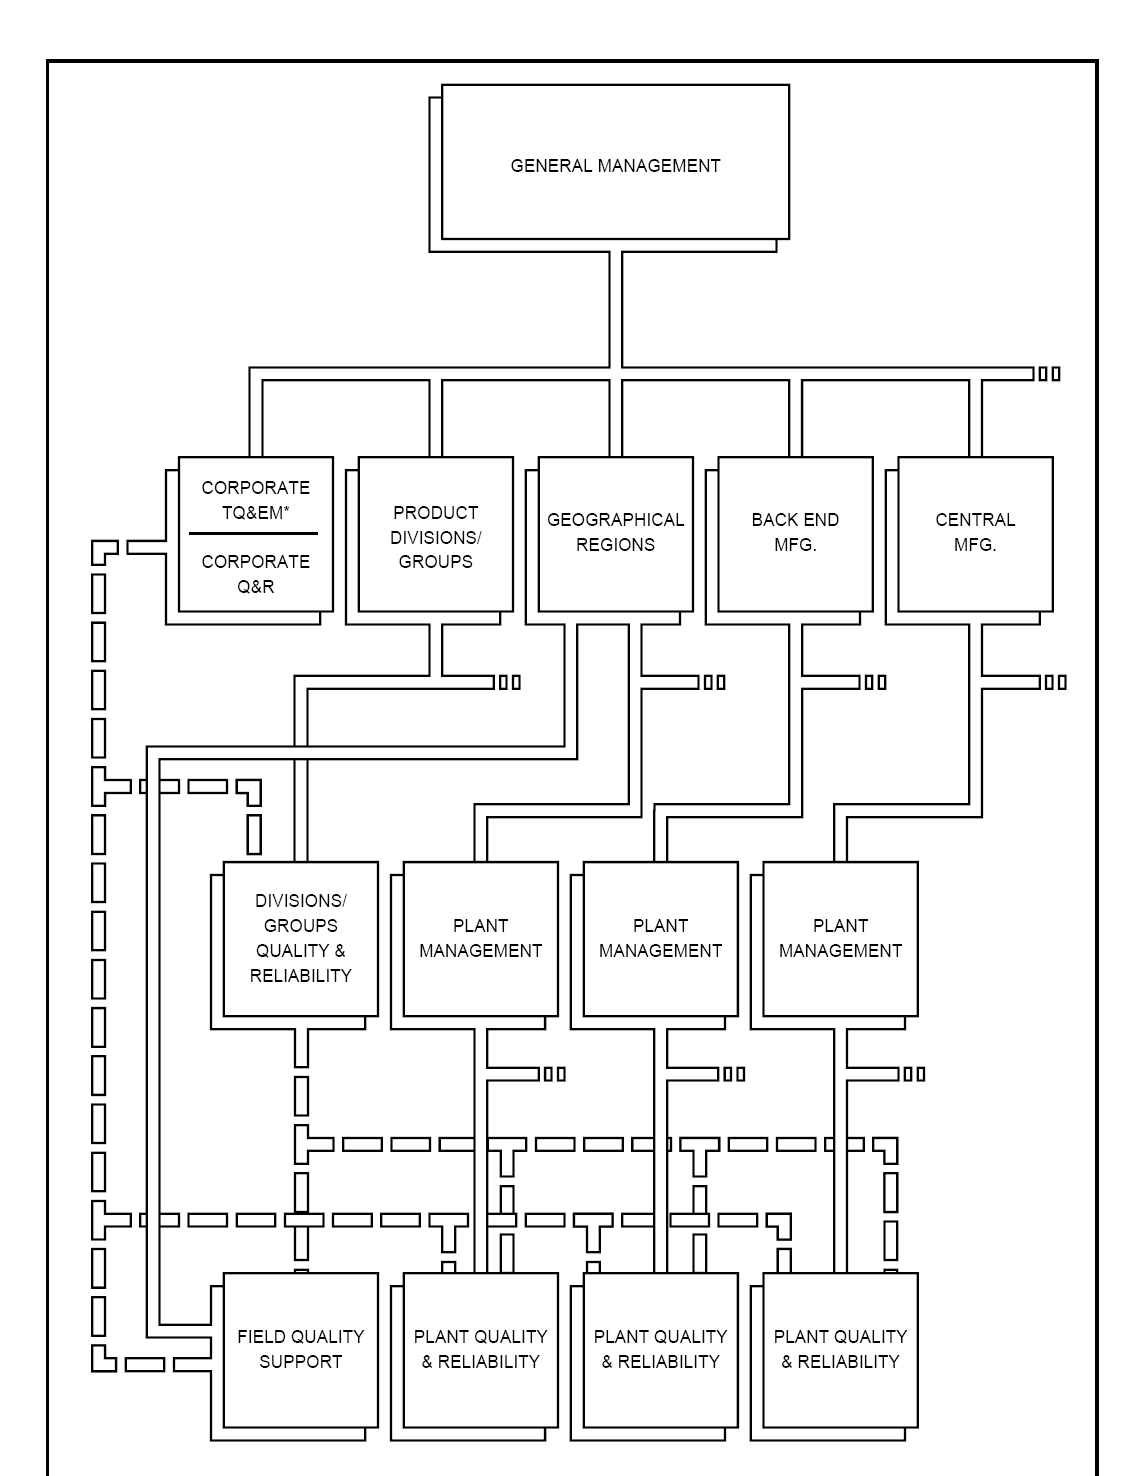
Plant Quality and Reliability
- Assure the quality and reliability of all manufactured products.
- Regular self-auditing on processes, SPC, specifications, and procedures of application.
- Achieve Q&R targets and uniform quality approach throughout the company, by maintaining a close liaison with Corporate and Group/Divisional Quality departments.
- Coordinate corrective and preventive actions in the plant, based on the feedback from Quality and Reliability tests, field data, and Failure Analysis results.
- Assure that adequate process controls are performed at the plants including incoming, SPC, outgoing, reliability testing, and failure analysis.
- Assure the correct distribution and updating of specifications received through the central document control system and updating the plant quality manual.
- Liaise with the other plants in order to assure common quality approaches.
- Interface with customers particularly for audit and certifications.
- Assure the correct training and certification of all manufacturing personnel.
P-Chart
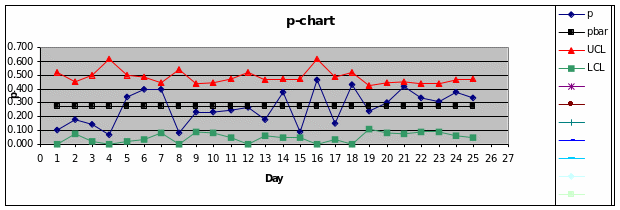
Control Limits
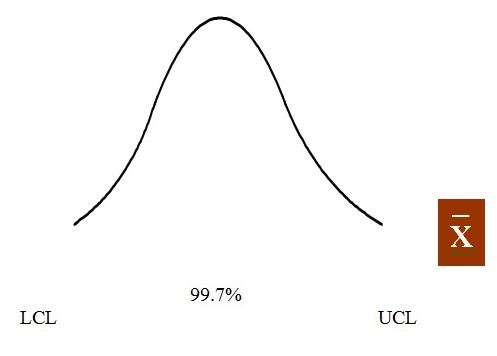
We establish the Upper Control Limits (UCL) and the Lower Control Limits (LCL) with plus or minus 3 standard deviations from some x-bar or mean value. Based on this we can expect 99.7% of our sample observations to fall within these limits we establish control limits at +/- 3 standard deviations, then we would expect 99.7% of our observations to fall within these limits.
Use of p-charts
Control of:
- A single quality characteristic.
- A group of quality characteristics on the same part.
- An entire product.
Measure quality of:
- An operator or machine.
- A work center.
- A department.
- An entire plant.
- An entire company.
Provide information for improving product quality:
- Measure performance at all levels.
- Identify the cases where variable control charts should be used.
- Variable charts are more sensitive to variations and are useful in diagnosing causes, even before defectives occur.
- P-chart is more useful in locating the source of the difficulty.
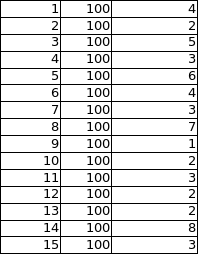
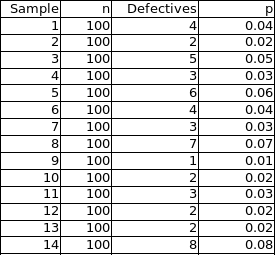
P-Chart for the analysis of manufacturing process of plant: Required Data
Sample No. No. of Samples Number of defects found in each sample
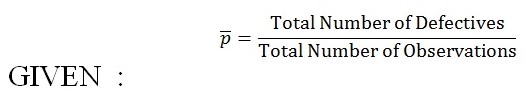
Statistical Process Control Formulas: Attribute Measurements (p-Chart)
p-bar = mean fraction defective in the sample
z = number of standard deviations (2 or 3)
σP = standard deviation of sampling distribution =
![]()
Compute control limits
UCL = P + ZSP
LCL = P – ZSP
P-Chart for the analysis of manufacturing process of plant
Step 1
Calculate the sample proportions, p (these are what can be plotted on the p-chart) for each sample;
Steps 2 & 3
Calculate the average of the sample proportions:
![]()
Calculate the standard deviation of the sample proportion:
![]()
o.036 ± 3(o.0188)
Step 4
Calculate the control limits:
UCL = P + ZSP
LCL = P – ZSP
o.036 ± 3(o.0188)
UCL = 0.0924
LCL = -0.0204 (or 0)
Step 5
Plot the individual sample proportions, the average of the proportions, and the control limits:
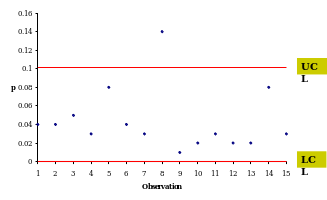
Analysis of Patterns on P- Charts
A control chart may indicate an out-of-control condition either when one or more points fall beyond the control limits, or when the plotted points exhibit some nonrandom pattern of behavior.
The process is out of control if one or more of the criteria is met. One or more points outside of the control limits. This pattern may indicate: A special cause of variance from a material, equipment, method, or measurement system change.
- Mismeasurement of a part or parts.
- Miscalculated or misplotted data points.
- Miscalculated or misplotted control limits.
A run of eight points on one side of the centerline. This pattern indicates a shift in the process output from changes in the equipment, methods, or materials or a shift in the measurement system.
Two of three consecutive points outside the 2-sigma warning limits but still inside the control limits. This may be the result of a large shift in the process in the equipment, methods, materials, or operator or a shift in the measurement system. Four of five consecutive points beyond the 1-sigma limits. An unusual or nonrandom pattern in the data. A trend of seven points in a row upward or downward. This may show Gradual deterioration or wear in equipment. Improvement or deterioration in technique. Cycling of data can indicate temperature or other recurring changes in the environment. Differences between operators or operator techniques. Regular rotation of machines. Differences in measuring or testing devices that are being used in order. Several points near a warning or control limit.
References
Garrison, R. H., & Noreen E. W. (2000). Managerial Accounting (9th ed.). Boston: Irwin McGraw Hill.
Hansen, D. R. (1990). Management Accounting. Boston: PWS-KENT Publishing Company.
Morse, D.C., & Zimmerman, J. L. (1997). Managerial Accounting. Chicago: Irwin McGraw Hill.
Riggs, H. E. (1994). Financial and Cost Analysis for Engineering and Technology Management. New York: John Wiley & Sons, Inc.
Weygandt, J. J., Kieso, D. E. & Kimmel, P. D. (1999). Managerial Accounting: Tools for Business Decision Making. New York: John Wiley & Sons, Inc.