Background of France
France is located in the Eurozone and the western part of Europe. France has a history of kingship, feudal lords, and a number of revolutions. Price (2014) describes that the emergence of the Ile-de-France’s authority was a key feature in its history.
In the current situation, France does not have plenty of minerals. Historically, France used to mine iron ore and coal. Currently, its natural gas reserves are likely to be depleted in the near future. The country relied on its fertile agricultural land. Later, manufacturing companies increased in the country. The northern parts were more industrial than the southern parts. The income inequality in France has been derived from its historical development. There was a poor transport network to allow the distribution of resources (Hanes & Wolcott, 2013).
Areas closer to natural resources were more developed than those further away from resources. Hanes & Wolcott (2013) explain that Nord and Palais-de-Calais accounted for “66 percent of France’s coal output, 18 percent of steel, 31 percent of cast iron, 60 percent of cotton mills, and 90 percent of all flax mills in 1911” (p. 87). In the same period, the Lorraine region produced 66 percent of all the cast iron produced in France and 10 percent of the world’s iron ore production. Bouches-du-Rhone (Marseille) was leading in chemical production and processed food. Lyon relied on manufacturing chemicals and silk production. In other parts of the country, such as the Midi, agriculture flourished because of fertile lands. France’s exports were low compared to its key competitors, who were Germany and Britain. Its coal production was also lower compared with Britain and Germany (Hanes & Wolcott, 2013). Coal mining was more expensive in France than in its counterparts. High coal prices led to innovation of alternative energy sources.
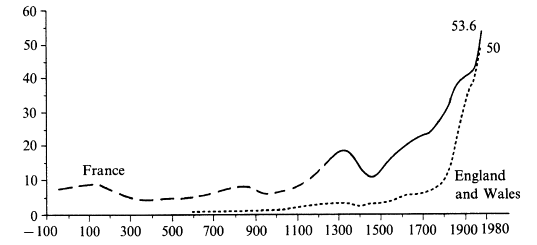
A historical analysis of its population shows that France had a slightly higher population than Britain (see Appendix A). Their populations were almost equal in size at the beginning of the 20th century. A majority of the rural populations relied on agriculture for their livelihoods (Price, 2014). According to the 2011 census, France had a population of 63.1 million people, excluding its overseas territory. It had 65.8 million when the overseas territories are included (World Population Review, 2014). In 2014, the estimated population was 66.3 million people, including overseas territories, and 62.8 million without overseas territories (Index Mundi, 2015). The current age structure shows that people aged 25-54 years formed a larger part of population, at 38.6 percent of the population (see Appendix B). It is followed by those aged between 0 and 14 years14 years, at 18.7 percent (Index Mundi, 2015). Based on gender parity, the structure is balanced. In 2014, it was estimated that males formed 48.44 percent of the population and females took 51.56 percent (World Population Review, 2014). The urban population forms 85.8% of the total population. The ethnic groups found in France include Celtic and Latin with Teutonic, Slavic, North African, Indochinese, and Basque (Index Mundi, 2015). Roman Catholic is the main religion, accounting for about 83 percent of the population. Muslims account for 5 percent and Protestants about 5 percent of the population (Index Mundi, 2015). The official language is French. The literacy level is estimated at 99 percent of the population.
State of the Economy
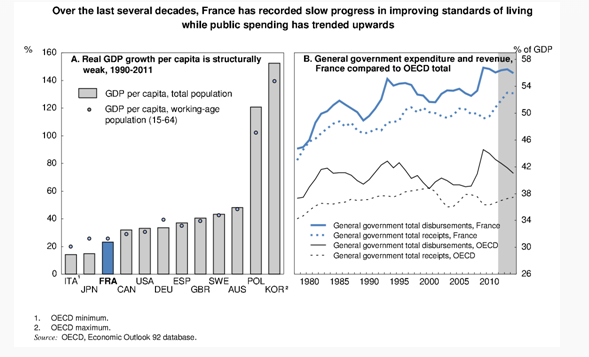
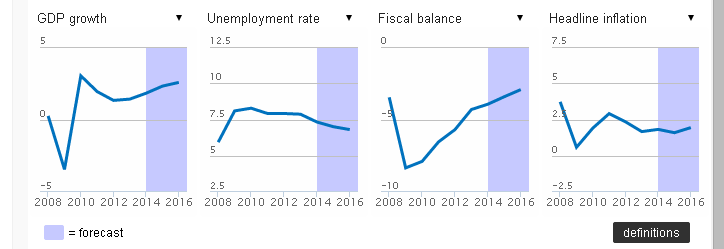
In the recent years, the country’s economic growth has stagnated. France’s economy is the fifth largest in the world. It was estimated at $2.8 trillion in 2013 (Olivier, 2015). OECD (2014a) elaborates that France’s real GDP is expected to grow at a slightly higher rate in 2015. In 2014, the GDP grew by 0.4 percent. It is expected to grow by 0.8% in 2015 and 1.5% in 2016 (OECD, 2014a).
The reforms about to be implemented by the government are promising to create better investment conditions. The Employment Competitiveness Tax Credit reform and the labor market agreements are likely to encourage investment in the country (OECD, 2013). Public spending, as a percentage of GDP, is considered to be very high. It has resulted in higher tax rates and a distortion in the tax structure. Some sectors and corporations are taxed higher rates than others.
The budget deficit is one of the major concerns. The targeted reduction was not achieved at the end of 2013. The government has set a lower target for the 2014-2016 periods than the original 3% (OECD, 2014). Reduction in government spending is expected to enable a reduction in tax rates. According to the OECD (2013), France government’s spending and receipts are higher than the average of OECD countries (see Appendix C). The unemployment rate and the budget deficit are declining as shown in Appendix D. The inflation rate is below 2.5 percent (OECD, 2014).
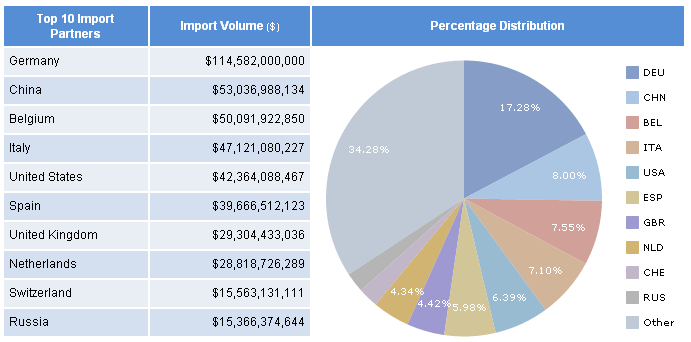
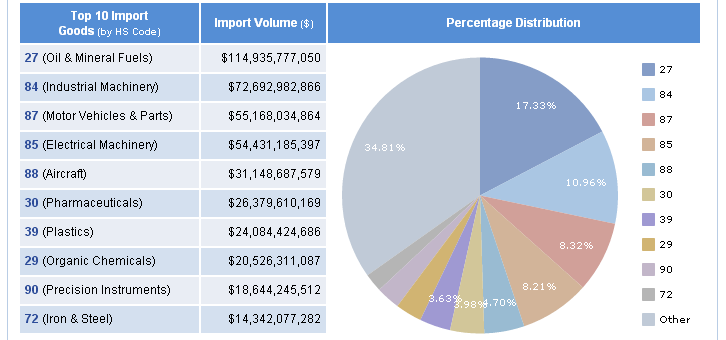
In the balance of payments, France operated in 2012 and 2013. Total exports amounted $556.6 billion and imports 663.3 billion in 2012 (France: Trade statistics, 2013). There was a trade deficit of $106 billion. In 2013, the trade deficit was $81 billion from the total trade value of $1.2 trillion (Olivier, 2015). Of these trade values, 58.7 percent was conducted with EU-27 countries. In 2012, its largest trade partner, both imports and exports, was Germany (see Appendix E to Appendix H). Other major trade partners included Italy, Belgium, and China among others. Its leading export commodity was industrial machinery (Global Edge, 2015). The manufacturing sector portion of the GDP dropped from 16 percent to 12.5 percent between 1999 and 2014. Its key sectors included agriculture, luxury market, health, and high-tech sector. In 2012, agriculture had a trade surplus of 11.5 billion Euros. The health field had a trade surplus of 5.34 billion Euros (Consulate General of France in New Orleans, 2013). It also exported aircrafts.
Trade Specific Issues
The U.S. is the largest source of foreign direct investment. There are about 4,200 firms that are owned by US-owned entities. There are more than 20,000 foreign firms operating in France (Olivier, 2015). The main barriers to foreign investment are regulations, which do not favor new entrants. The country distribution and retail channels are controlled by dominant firms. The high concentration and dominance of the large firms is making it difficult for SMEs to survive (OECD, 2014b). Considering bilateral agreements, France is a member of the EU, the G-8, the WTO, NATO, and the OECD (Olivier, 2015).
The government seeks to encourage investment through its corporate tax credit program (CICE) by setting aside €20 billion to support firms (Olivier, 2015). The government also plans to spend €35 billion in a ten-year program targeting SMEs in green technology, industrial sector, and digital sector (Olivier, 2015). The Consumption Law is another reform that seeks to increase competition in the pharmaceutical sector, by limiting monopoly sales (OECD, 2014b).
The barriers to business entry in France exceed those found in most of the OECD countries. Trade restrictiveness index by sector shows that France exceeds benchmarks in all sectors (see Appendix I). Restrictiveness has been intensified by market concentration of large firms, segmentation of policies in municipalities, tax structure distortions, and labor market conditions (OECD, 2014b). Air transport is the most restrictive sector for new entrants in France. Telecommunication and construction are the least restrictive sectors to engage in trade.
Labor laws that require employers to pay social contributions and minimum-wage are associated with high unemployment rate. The minimum wage is set at a monthly payment of €1,445 (Olivier, 2015). There are reforms to reduce the amount paid as a social contribution (OECD, 2014b). Income tax rates are higher in France compared with other developed economies (see Appendix J and Appendix K). Corporate tax is one of the areas that raise concern for investors. It is set at 33.3% and the government intends to lower it to 28% by 2017 (OECD, 2014b). The government plans to leave out the corporate social solidarity tax. The carbon tax is set to increase rapidly from 7 Euros per tone of emission in 2014 to €14.50 in 2015 and €22 in 2016 (OECD, 2014b).
The large number of municipalities creates a distortion in regulation and policy implementation. France has 36,700 municipalities, making it among the highest in the OECD countries (OECD, 2014). The legislative arm of government has proposed reforms to reduce the number of regions (OECD, 2014b). The law requires prompt compensation in the case of expropriation (International Business Publication, 2014). Most products attract a duty rate of 17% on imports and a VAT of 20% (OECD, 2014b). The rates may be higher or lower depending on products that the government wants to control. For example, digital technology products are imported duty free.
One of the legal disputes that touched around subsidies involved a legal battle between the U.S. and the European Community. It was a complaint about the subsidy issued by EC countries to Airbus (Kienstra, 2012). It affected Germany, France, UK, and Spain, against the United States. Airbus is relevant to the analysis of France’s trade specific issues because it forms a significant percentage of its GDP. In 2012, France’s Airbus sold 588 aircrafts to 89 customers (Consulate General of France in New Orleans, 2013). France and Germany were the only partners in the formation of Airbus (Kienstra, 2012). The U.S., filing a case on Boeing’s behalf, disputed the use of subsidies by EC countries to increase Airbus’ competitiveness (Kienstra, 2012).
Issues regarding the use of subsidies have occurred several times in the past. In 2004, it culminated when the U.S. filed a case requiring a resolution from the WTO regarding Airbus’ subsidies. Later, the EC countries filed a countersuit, after realizing that Boeing also benefitted from subsidies (Kienstra, 2012). The existing trade agreements between the U.S. and the EC were the SCM Agreement and the GATT of 1994. The agreements sought to regulate subsidies in the Large Civil Aircraft industry of member countries. The GATT was supported by further agreements through the WTO to eliminate subsidies in the Large Civil Aircraft industry involving exports. Kienstra (2012) discusses that the best way to prevent a cycle of complaints on subsidies is to completely eliminate subsidies in the Large Civil Aircraft industry.
Analysis of Trade
France is an attractive country to engage in trade because it has few barriers to international trade. It is an active trading partner with the EU member countries. As shown above, they account for 58 percent of its international trade value. The duty and tariffs on trade are less restrictive compared with other countries.
Investment in the country is reduced by regulatory lapses that allow dominant firms to control retail and distribution channels. The high concentration of the market by a few firms has made new entrants to require large amounts of capital to be able to compete with already existing firms. It creates a barrier to new entrants. The government’s “Investment for the Future” program may rejuvenate SMEs in the targeted green and high-tech sectors. Reforms to minimize monopoly sales in the pharmaceutical sector will increase efficiency and productivity. Investment in the country is affected by the distorted tax structures and the high number of municipalities. Corporate tax also favors some sectors and large-size corporations. The government has ownership in some of the large-size corporations, which may affect implementation of the proposed reforms.
The standard of living will improve following governments plan to reduce tax rates and the deficit on spending. The country has a population with an attractive proportion of highly-skilled labor. The country has a history of flourishing in agriculture and manufacturing chemicals. The country can focus on pharmaceuticals, aeronautics, luxury products, and agriculture because they indicate a higher growth rate as well as competitive advantages. Considering that 85 percent of the population is urbanized, the country needs to continue providing subsidies in the agricultural sector to meet the demand for food.
The country is carrying out a number of reforms in response to its slow economic growth rate. They include corporate tax rate, labor laws, reduced social contributions by employers, harmonization of municipalities’ policies, and other regulatory reforms. With the large number of reforms, the country is likely to improve and gain momentum for a higher economic growth rate.
References
Consulate General of France in New Orleans. (2014). Leading-edge economic sectors: France’s trump card. Web.
Global Edge. (2015). France: trade statistics. Web.
Hanes, C., & Wolcott, S. (2013). Researching in economic history (Volume 29). Bingley, UK: Emerald Group Publishing.
Index Mundi. France demographics profile 2014. Web.
International Business Publication. (2014). France: Company law and regulations handbook: volume 1, strategic information and basic laws. Washington, DC: International Business Publication.
Kienstra, J. (2012). Cleared for landing: Airbus, Boeing, and the WTO dispute over subsidies to Large Civil Aircraft. Northwestern Journal of International Law & Business, 32(3), 569-606.
OECD. (2013). Economic survey of France. Web.
OECD. (2014a). France – Economic forecast summary. Web.
OECD. (2014b). France structural reforms: impact on growth and options for the future. Web.
Olivier, C. (2015). Doing business in France. Web.
Price, R. (2014). A concise history of France (3rd ed.). New York, NY: Cambridge University Press.
World population review. (2014). Web.
Appendices
Appendix A
Historical population: comparative evolution of population (in millions) between France and England & Wales
Appendix B
Appendix C
Appendix D
Appendix E
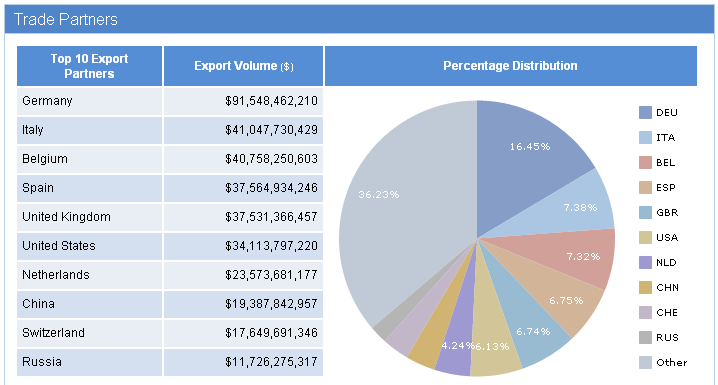
Appendix F
Appendix G

Appendix H
Appendix I
France’s service trade restrictiveness index by sector and regulatory field:
Appendix J
Appendix K
France tax rate compared with other countries:
