The statistical analysis process was undertaken using the SPSS software package, which analyses data in batches (Davis 2013). The main types of statistics applicable in the base software include bivariate statistics, prediction of numerical outcomes, the prediction for identifying groups, Geospatial analysis, GUI (R extension) and descriptive statistics (Pallant 2016). The researcher used the descriptive statistical method to analyse the findings of this paper. The method focuses only on the basic features of data (Cleff 2013). Based on the descriptive nature of the data collection method, the findings presented in this paper will be simple summaries of the respondent’s views. The goal of employing this data analysis technique is to assess the quantitative descriptions of the research variables in a manageable way. Coupled with simple graphical analysis, the contents of this review provide what Abbott (2016) describes as the foundation of a quality quantitative study.
In the first part of the questionnaire, respondents had to rate the likelihood that specific risk management processes exist in their organisations. In this assessment, they gave their opinions about nine aspects of strategy that affected risk management processes. The nine aspects of strategy include the existence of a process to align risks with strategic objectives, the availability of a risk identification process, the existence of a process for alignment of a risk profile with business plans, the existence of procedures for integrating risk management processes in the decision-making framework and the existence of a risk management body. Other aspects of strategy that were investigated included the availability of a mechanism for understanding and enforcing risk practices by the board, the existence of processes for compliance with regulatory requirements, the presence of internal audit systems to implement a formal risk management program, and the availability of financial crisis impact drives to implement a risk management program. The results appear below.
Result Findings
Table 1 below outlines a general overview of the statistical information relating to the variables investigated.
Table 1: General Statistical Findings
An assessment of the “strategy” variable shows a general standard deviation of 1.1 in the data. This figure indicates that the respondents’ views were closely related (Wetcher-Hendricks 2014). The distribution of the same variable is also negatively skewed for all the nine factors assessed, meaning that strategy could potentially have a negative impact on risk governance.
The likelihood of the research variables occurring ranged from a low of “1” to a high of “5.” These values were obtained from the rating measures outlined in the 5-point Likert scale tool. An index of “4” means that it was “likely” to occur. At the same time, a majority of the respondents indicated that “strategy” was likely to have an impact on risk governance and project objectives because the mode was “4.” Since this variable was negatively skewed, it would be correct to assume that the risk factor will likely occur. The data obtained also shows a strong level of consistency of the mean, median and mode. This is a strong indication that the data is “normal” because Reddy (2014) says these indices should be close to one another. The mean, median and mode obtained from the strategy variable were in the range of 3.47, 4, and 4 respectively. Their difference is negligible, meaning that they satisfy the requirement outlined by Reddy (2014) above. A detailed assessment of the nine issues analysed in the strategy variable appears below.
Existence of Process to Align Risks with Strategic Objectives
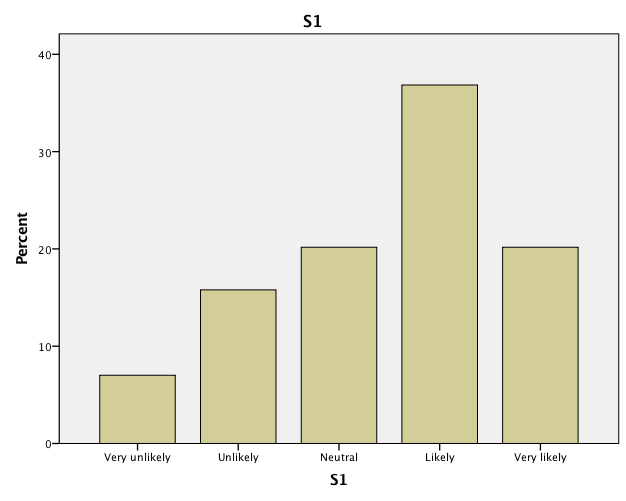
When the respondents were asked to state whether they believed there was a process to align risks with their organisation’s strategic objectives, most of them responded affirmatively. In detail, 36% respondents said it was “likely” that such processes existed in the company; while only 7% said it was “very unlikely” that such a system existed. Figure 1 below presents a graphical depiction of the holistic findings.

Existence of Identification Process of Potential Risk
Regarding the item S2 in the questionnaire, most of the respondents sampled said there was a high likelihood that the organisation had an identification process for potential risks. Relative to this view, 43% of them stated that such an identification process “likely” existed in the organisation. The percentage of those who were “neutral” about this view and those who believed the identification system “very likely” existed in the organisation was the same at 16.7%. Comparatively, 19.3% of the respondents believed that such an identification system was “unlikely” to feature in their firms’ processes. The least number of respondents (4%) believed such a system existed in their organisations. Table 2 below summarises these findings.
Table 2: Response for the possible existence of identification process of potential risk
Existence of Process for Alignment of Risk Profile with Business and Capital Management Plans
When the respondents were asked to give their views regarding the existence of a process for the alignment of risk profiles with business and capital management plans, the majority of them said it was “likely” that this statement was true. The percentage of respondents who thought this way was 34.2%. The least number of them said it was “very unlikely” that this statement was true. The percentage of people who felt this way was 6.1%. Comparatively, 18.4% and 14% of them said the statement was “unlikely” or “very likely,” respectively. Lastly, the percentage of respondents who were “neutral” about the statement was 27.2%. Table 3 below shows a summary of the respondents’ views.
Table 3: Response for the possible existence of a process for alignment of risk profile with business and capital management plans
Existence of Procedure for Integrating the Risk Management into Strategic Decision-Making
A review of the respondents’ views regarding the existence of procedure for integrating the risk management into their organisation’s strategic decision-making process showed that most of them were optimistic that such a system existed. In detail, a majority of them (36%) believed that it was “likely” the risk management process was a critical part of the organisation’s decision-making focus. Those who were “neutral” about the existence of such a process were 25.4% of the total sample, while those who believed the existence of such a system was “very unlikely” and “unlikely” was 7% and 15.8% respectively. The table below presents a summary of the findings.
Table 4: Response for the possible existence of procedure for integrating the risk management in strategic decision-making
Existence of Risk Management Oversight Body
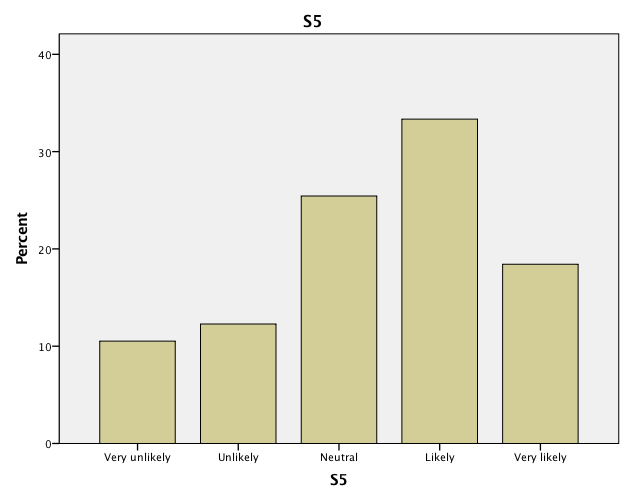
When the respondents gave their views about the existence of a risk management body in their organisations, a majority of them (33.3%) said such a body likely existed in the workplaces. Those who were “neutral” about the statement were 25.4%, while those who thought it was “unlikely” or “very unlikely” that such a system existed were 12.3% and 10% respectively. Figure 2 below summarises the findings

Existence of Mechanism for Understanding and Enforcement of Risk Practices By Board
Regarding the existence of a mechanism for the enforcement of risk management policies, most of the respondents said the likelihood that such a body existed was high. A majority of them (34.2%) thought this way. Those who believed that it was “unlikely” or “very unlikely” that such a mechanism existed were 17.5% and 7.9% respectively. Respondents who held “neutral” views were 25.5%, while those who said it was “very likely” that such a mechanism existed were 14.9% of the sample. Table 5 below presents a summary of the findings.
Table 5: Responses for the possible existence of a mechanism for understanding and enforcement of risk practices by board
Existence of Process for Compliance with Regulatory Requirements
In an unrelated question, most of the respondents sampled (42.1%) said it was likely that a process for compliance with regulatory systems existed in their organisations. An equal percentage of people (20.2%) was “neutral” about this view and believed it was “very likely” a compliance system existed in the organisation. The same is true for the percentage of respondents who said such a system “unlikely” or “very unlikely” existed in their organisations because both were 8.8% of the total sample. Table 6 below summarises these findings.
Table 6: Responses for the possible existence of a process for compliance with regulatory requirements
Existence of Internal Audit Process to Implement Formal Risk Management Program
Most of the respondents sampled said it was “likely” that an internal audit process to implement formal risk management programs existed in their organisations. The percentage of people who felt this way was 35.1%. The second biggest population of respondents sampled said it was “very likely” that such a system existed in their organisations. Comparatively, those who held opposing views were 14.9% and 7.9% and they said it was “unlikely” and “very unlikely” such a system existed in their workplaces. Those who held “neutral” views on the same issue were 18.4% of the total sample. The comprehensive findings appear in table 7 below.
Table 7: Responses for the possible existence of an internal audit process to implement a formal risk management program
Existence of Financial Crisis Impact Drives To Implement Risk Management Program
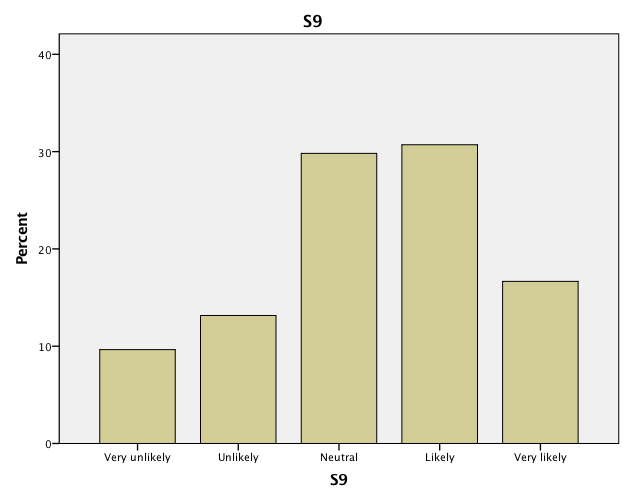
The last question asked in the strategy section of the survey was whether the respondents believed there was a financial crisis impact that would help in the implementation of risk management programs in their workplaces. A majority of them (30.7%) said it was “likely” such a program existed in the organisations. Those who held similar views said it was “very likely” that the program existed and they comprised 16.7% of the total sample. Respondents who held a “neutral” view on the same issue were 29.8%, while those who said it was “unlikely” or “very unlikely” that such an impact assessment helped in the implementation of a risk management program were 13.2% and 9.6% respectively. Figure 3 below provides a graphical representation of these findings.

Reference List
Abbott, M 2016, Using statistics in the social and health sciences with SPSS and excel, John Wiley & Sons, London.
Cleff, T 2013, Exploratory data analysis in business and economics: an introduction using SPSS, STATA, and excel, Springer Science & Business Media, New York, NY.
Davis, C 2013, SPSS Step by step: essentials for social and political science, Policy Press, New York, NY.
Pallant, J 2016, SPSS survival manual: a step by step guide to data analysis using IBM SPSS, Allen & Unwin, New York, NY.
Reddy, V 2014, Statistical methods in psychiatry research and SPSS, CRC Press, London.
Wetcher-Hendricks, D 2014, Analyzing quantitative data: an introduction for social researchers, John Wiley & Sons, London.