Introduction
In the past years, many businesses and companies have experienced the devastating effects of COVID-19. Business managers and Chief Executive Officers (CEO) have tried several businesses’ resiliency methods to control a slew of the impacts of the pandemic but with evidence of failure in the majority of the companies. The methods included such activities as ascertaining the health safety of both the clients and the employees, reorientation of business activities, cash and liquidity bolstering, and the incorporation of federal support systems (Juliani and Rahadi, 2020). The effect of the pandemic adds to the economic damage and business uncertainty, thus, managing a firm’s long-term viability and resiliency requires an understanding of the shifting market dynamics (Ivanov and Dolgui, 2020). Moreover, the majority of the firms have also considered federal business policies during the COVID-19 pandemic. As such, it is imperative to understand the operation of companies to gauge the viability and performance during such pandemics as COVID-19.
Therefore, this report assesses the prospective future financial budgeting plans for Barnwell Industries Inc. regarding the lately experienced effects of COVID-19. The analysis of the report was divided into three parts. Firstly, the financial performance and the overview of the economic trends were analyzed based on the New York Stock Exchange (NYSE) regarding the oil and gas industry. In the financial analysis, such financial ratios as profitability, efficiency, liquidity, and investment were conducted to reveal the trends of the Company during the past couple of years. However, the limitation of the use of such ratios was also discussed in the report.
Problem Identification
Background Information of Barnwell Industries, Inc.
Barnwell Industries, Inc. and its affiliates are predominantly engaged in several industrial activities. Apart from its major activity of oil and natural gas, the company participates in both land investment and water well drilling (Barnwell Industries Inc, n.d.). In the oil and natural gas component, the firm is engaged in both oil and natural gas development, production, and its subsequent sales to such markets as the U.S. and Canada. However, the Company subsector of land investment enables the firm to invest in resort property development in Hawaii as indicated in the company’s profile (Barnwell Industries Inc., n.d.). For the water well drilling section, the firm is involved in the provision of well-drilling facilities and connection and installation of water pumping and repairs in Hawaii.
Barnwell Industries Inc. is listed as a public company with its location in Honolulu, U.S., and was founded in 1956 with more than 42 employees as of December 2019 (Barnwell Industries Inc, n.d). Moreover, the firm is listed on the New York Stock Exchange (NYSE) as NYSE American: BRN in the category of Oil and Gas Industries. According to Craft (n.d), as of September 2021, BRN has a market capitalization of $19.4 million. In this regard, the firm counts itself as one of the major players in the oil, energy, and gas industries. Additionally, according to Craft (n.d.), in the fiscal year 2020, the firm generated revenue stood at $18.3 million, indicating a rise of about 52%.
Effect of COVID-19 on the Company
The current COVID-19 pandemic has caused business-related problems in most oil and natural gas industries. For instance, because of the social distance policies and forced shutdown measures, most corporations have had difficulties in both the day-to-day operations and productions in both the downstream and upstream markets. Notably, the price collapse for crude oil during the pandemic period has been the major devastating effect of the pandemic. For instance, based on the NYSE, as of January 2020, a barrel of crude oil was priced at $67.05 compared to March 15, 2020, when the same barrel of oil was exchanged for $30.00. Though the company had made a significant increase in revenue for the fiscal year 2021, the price of crude oil as of 2020 had significantly impaired its market capitalization.
Apart from the pandemic, the company had also registered massive losses before the inception of COVID-19 disease. For instance, Barnwell Industries Inc. posted a loss of $4.6 million in the fiscal year 2018 compared to a loss of $1.017 million for the same period in 2017 (Magin, 2019). According to CEO Alexander Kinzler, the loss of revenue was largely due to a $2.17 million non-cash impairment on the company’s oil and natural gas properties in Canada (Magin, 2019). According to the CEO, due to the low oil and natural gas production, the prices were reduced as compared to the prior year (Magin, 2019). Therefore, since low production of oil and natural gas production can result in a reduction in oil prices, the effect of COVID-19 is worth analysis. In this regard, evaluation of the financial performance of the company using ratio analysis is an important procedure in ensuring that the company remains afloat in the event of future pandemics.
Financial Performance Analyses Techniques
In business management, financial performance is a method of analyzing how financial goals are met. It is a financial method of evaluating a company’s policies and activities to gauge the financial health of a firm over a specific period. It can also be used to compare a firm with other companies in the same market performing similar operations. To enable ease of performing financial analysis. Financial statements are used from each year’s reports (Atrill and McLaney, 2015). Because financial statements are a reasonable and coherent set of data, which are structured for accounting procedures, the data are aimed at conveying an understanding of the most prominent business’s financial aspects. There are several methods of financial performance analyses. However, for this report, ratio analysis has been used in most parts of the financial performance analysis. According to Dance and Imade (2019), ratio analysis is a quantitative procedure of attaining an insight into a business’s liquidity, operational efficiency, and profitability by evaluating its financial statements from such books of accounts as the balance sheet and income statement. Therefore, the ratios involved in this analysis include profitability, efficiency, liquidity, and investment ratios.
Profitability Ratio
Return on invested capital
The return on invested capital (ROIC) between the five financial years in Barnwell Industries, Inc. is as indicated in Figure 1. It is significant for many investors to evaluate a business’s future profitability using the ROIC or other such ratios as return on equity as the most significant measure of performance (Boisjoly, Conine Jr, and McDonald IV, 2020). ROIC is calculated by dividing the difference between net income and dividends by the sum of debt and equity. Conversely, the firm initially presented ROICs in annual reports, which were evaluated as earnings before interest and tax, divided by average net assets adjusted as intangible tax, and retirement benefits assets. Therefore, the calculated ROICs values are as shown in Figure 1 below for the current 5 years.
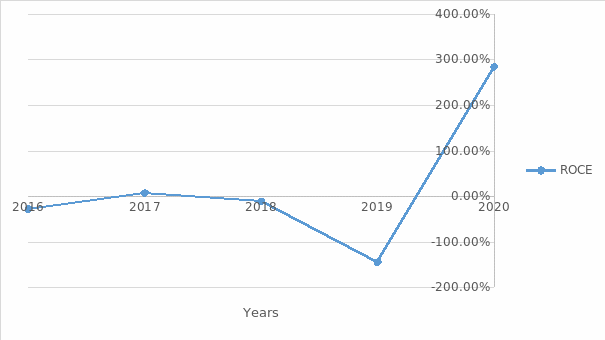
From the above figure, the values had been steadily increasing between 2016 and 2017 and a subsequent increasing negative ROIC in 2018 and 2019. There was a huge positive change in the year between 2019 and 2020, indicating a steady increase in the year 2020. However, considering that relatively high values of ROIC calculated using the formula above were documented in other companies, it was indicated that there could be room for communal effort.
Net Profit Margin (NPM)
The net profit margin is another type of profitability ratio which enables an investor to assess the trading performance after the actual deduction of operating business expenses. As such, NPM is a measure of operating profit relative to revenue collected within a fiscal year; hence, it is used to evaluate how a firm has performed within the fiscal year (Nariswari and Nugraha, 2020). The ratio is calculated by dividing the operating profit by revenue. The NPM for Barnwell Industries Inc. is as indicated in Figure 2 below.
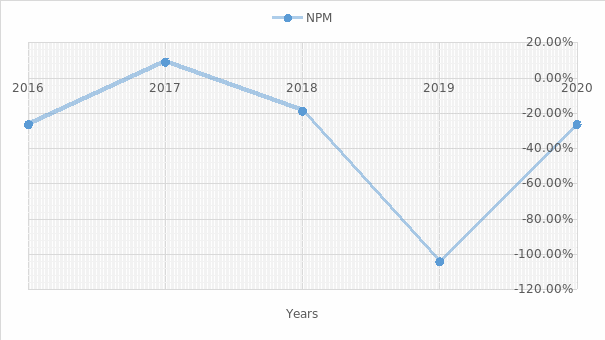
From the above analysis, the company only registered a positive NPM in the year 2017, rising from a negative NPM in 2016. Notably, the NPM has been reducing year by year from 2017 to 2019. However, in the aftermath of the COVID-19 pandemic, the NPM has gradually risen, which seems to be a continuation of corporate efforts. Despite the rise, a comparison of NPM for Barnwell Industries Inc. should be considered with a comparison done for the company against other corporations operating in the same line of goods.
Efficiency Ratios
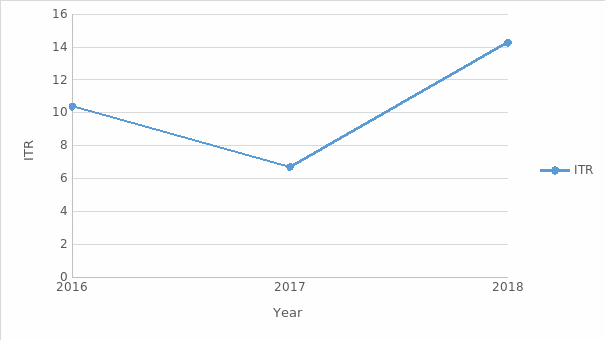
Efficiency ratios are performance techniques used to evaluate a firm’s capacity to use its assets to generate income. For instance, an efficiency ratio examines a range of such aspects of a corporation as the time taken for the company to collect cash from its clientele or the total time it takes a firm to translate its inventory to cash (Figura, 2017). Efficiency ratios include the inventory turnover ratio (ITR), asset turnover ratio (ATR), and receivables turnover ratio (RTO). Inventory Turnover Ratio, ITR tells an investor how long it takes a business to keep its average stock item intact. It is calculated by dividing the average amount of inventories from both the opening and closing inventories by the cost of sales for a given fiscal year (Farooq, 2019). The ITR for the company during 2016-2018 is shown in Figure 3. The ITR was gradually decreasing between 2016 and 2018. However, favorable financial efficiency was shown in Barnwell Industries Inc.
Liquidity Ratios
Liquidity ratios are performance techniques used to deliver investors an understanding of the short-term position of a firm. According to Farhan et al. (2019), ratios are used to evaluate whether a corporation has applied short-term assets effectively. The liquidity ratios include such ratios as the current ratio and quick ratio, among others.
Current ratio
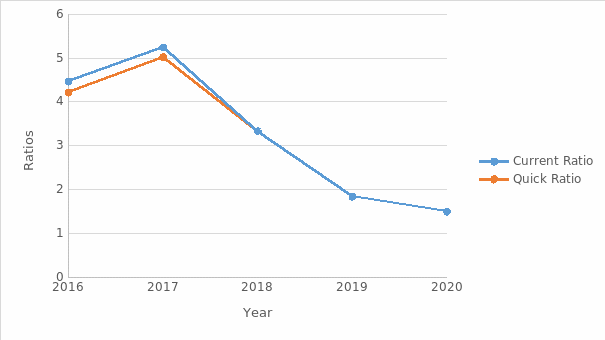
The current ratio is calculated by dividing all the current assets of a firm by its current liabilities. According to Farhan et al. (2019), in the past, a current ratio of 2:1 was regarded as the best for a business. The calculated current ratios for Barnwell Industries Inc. during the past 5 years are shown as indicated in Figure 4. The values were on the average of 3.27, thus, as per the conventional standards.
Quick ratio/Acid test
The quick ratio is calculated by dividing the difference between current assets and inventories by current liabilities. The ratio focuses on the liquid assets, hence providing a proper way of viewing a business can pay off its obligations (Farhan et al., 2019). Though the ratio increased from 4.21 to 5.02 in the years 2016 and 2017, indicating the presence of corporate effort for the financial liquidity of the firm, the general decreasing trend (3.33, 1.83, and 1.49) for the years 2018, 2019, and 2020 respectively provides a cause for analysis.
Investment
Earnings per share (EPS)
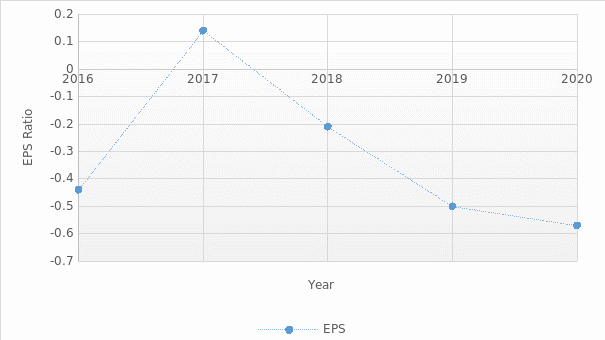
EPS is an investment ratio that is calculated by dividing (all profits owned by the stakeholders) by ( the weighted mean number of shares outstanding during the fiscal years). As such, the calculated values for Barnwell Industries Inc. as indicated in Figure 4 were calculated for the years 2016 to 2020. EPS had been steadily increasing during 2016 to 2017 but with a gradual decrease from 2017 to 2020, which result to a reduction of share price and the firm’s continuous advantage.
Apart from the above-listed ratios, another ratio used to analyze how well a firm’s cash flow can be used to recover all its long-term debt is known as the Solvency ratio. The ratio is a key metric as it is used to evaluate the financial health of a corporation, thus, can be used in the determination of the likelihood of defaults during debts. They include such ratios as debt to asset ratio and debt to equity ratio.
Limitation of the financial ratios
Financial ratio analysis is encompassed by several challenges. Consequently, it is imperative to understand its limitations to avoid future incorrect conclusions. For instance, ratio analysis bases its evaluation on historical data. However, since companies might conceal some information during financial reporting, ratio calculation metrics might not provide an accurate predictor of future business projections. Moreover, ratio analysis has an inflationary effect because of the several gaps during daily financial reporting. Hence the firm should consider capital budgeting (Clark, Menifield and Stewart, 2018; Graham and Sathya, 2020; Sarwary, 2020). Consequently, valid values are lost in financial statements, especially during inflation, making the compassion over time invalid.
Conclusion
In conclusion, the effect of the COVID-19 pandemic has made Companies reevaluate their future business operation. For instance, in the case of Barnwell Industries, Inc. there has been a sharp drop in commodity prices in the stock market. From the analyses of the ratios for the past 5 years, the Company is indicated to be well-versed in responding to external challenges as indicated. However, because of the limitations indicated in using the ratio analyses for financial performances, the firm should consider other such methods as capital budgeting techniques. With capital budgeting, the firm can assess the best method of investing its revenue in the most appropriate projects as a method of business resiliency during a future pandemic or any other external challenges.
Reference List
Atrill, P., and McLaney, E. (2015) Accounting and finance for non-specialists. 9th edn. London: Pearson.
Barnwell Industries, Inc (n.d.) Barnwell industries, Inc.
Boisjoly, R. P., Conine Jr, T. E., and McDonald IV, M. B. (2020) ‘Working capital management: financial and valuation impact’, Journal of Business Research, 108(1), pp. 1-8. doi:10.1016/j.jbusres.2019.09.025
Clark, C., Menifield, C. E. and Stewart, L. M. (2018) ‘Policy diffusion and performance-based budgeting’, International Journal of Public Administration, 41(7), pp. 528-534.
Craft. (n.d.) Barnwell Industries.
Dance, M. and Imade, S. (2019) ‘Financial ratio analysis in predicting financial conditions distress in Indonesia Stock Exchange’, Russian Journal of Agricultural and Socio-Economic Sciences, 86(2), pp. 1-11. doi: 10.18551/rjoas.2019-02.18
Farhan, N. H. et al. (2019) ‘Does corporate governance moderate the relationship between liquidity ratios and financial performance? Evidence from Indian Pharmaceutical Companies, Academic Journal of Interdisciplinary Studies, 8(3), pp. 144-144. doi:10.36941/ajis-2019-0013
Farooq, U. (2019) ‘Impact of inventory turnover on the profitability of non-financial sector firms in Pakistan’, Journal of Finance and Accounting Research, 1(1), pp. 34-51. doi:10.32350/JFAR.0101.03
Figura, P. (2017) ‘Formation of the level of efficiency ratios by small and medium enterprises depending on the achieved return on assets’, Research on Enterprise in Modern Economy theory and practice, 1(20), pp.43-58. doi:10.19253/reme.2017.01.004
Graham, P. J. and Sathye, M. (2020) ‘The relationship between national culture, capital budgeting systems and firm financial performance: evidence from Australia and Indonesia’, International Journal of Management Practice, 13(6), pp. 650-673.
Ivanov, D. and Dolgui, A. (2020) ‘Viability of intertwined supply networks: extending the supply chain resilience angles towards survivability: a position paper motivated by COVID-19 outbreak’, International Journal of Production Research, 58(10), pp.2904-2915.
Juliani, M. and Rahadi, R. A. (2020) ‘Improving financial performance using capital budgeting method towards cleaner eyewear product: a case study of Nasho’, Malaysian Journal of Social Sciences and Humanities (MJSSH), 5(6), pp. 128-135.
Magin, J. L. (2019) Barnwell Industries posts $4.6M loss, execs agree to pay cut.
Nariswari, T.N. and Nugraha, N.M. (2020) ‘Profit Growth: impact of Net Profit Margin, Gross Profit Margin and Total Assets Turnover’, International Journal of Finance & Banking Studies (2147-4486), 9(4), pp.87-96. doi:10.20525/ijfbs.v9i4.937
Sarwary, Z. (2020) ‘Strategy and capital budgeting techniques: the moderating role of entrepreneurial structure’, International Journal of Managerial and Financial Accounting, 12(1), pp. 48-70.