With one of the most open and business-friendly environments in the world, Hong Kong offers excellent opportunities for companies. Hong Kong is a major center for British business in the region. In 2010, UK exports of goods to Hong Kong were valued at £4.2. Billion, up by 20% over 2009, making Hong Kong the UK’s 2nd largest market in Asia (after the Mainland) and our 12th largest export market worldwide Not only is Hong Kong an attractive market in its own right and a springboard in to the Mainland China market, it is also an ideal base for regional operations.
Current Economic Situation
- The world’s freest economy
- The world’s most competitive economy
- The world’s most services-oriented economy (services sectors accounting for more than 90% of GDP)
- The world’s second highest per capita holding of foreign exchange reserves
- The largest source of foreign direct investment (FDI) in Asia
- The second largest recipient of FDI in Asia
The goals
Before I invest in China life insurance Company, I will need to set realistic goals. These goals include the following:
- I want to make a minimum return of 20% in the next three years
- The least potential profit I will be ready to make must be three times greater than the risk
- The annual profit target on my portfolio is $120,520. This will be re-assessed on regular basis.
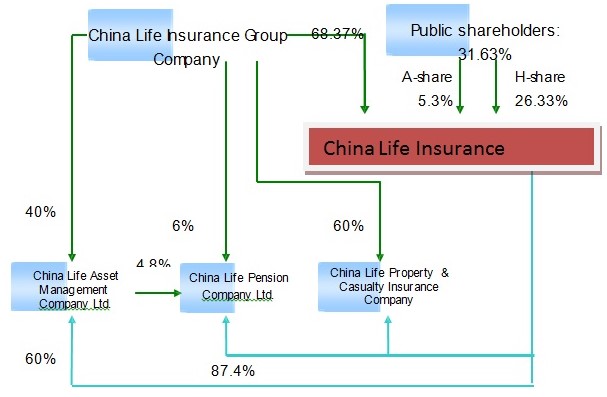
Company Structure
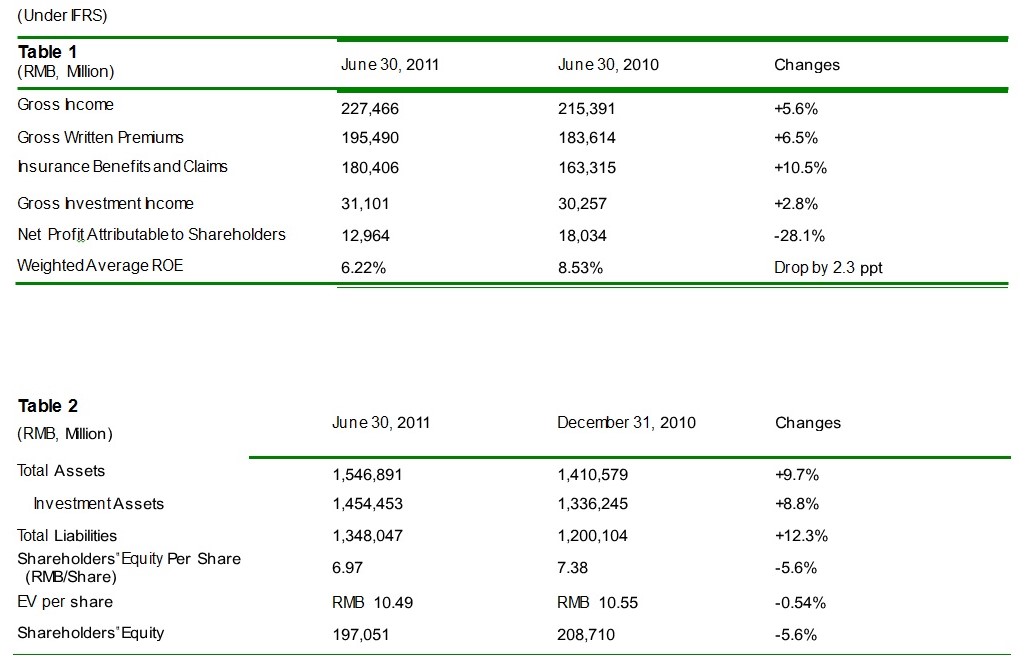
Overview of major business performance
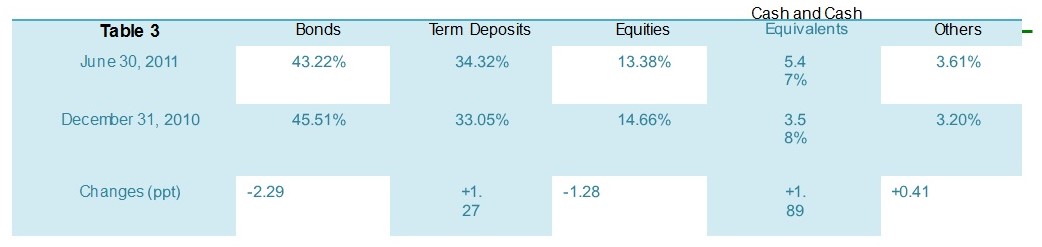
Investment Portfolio
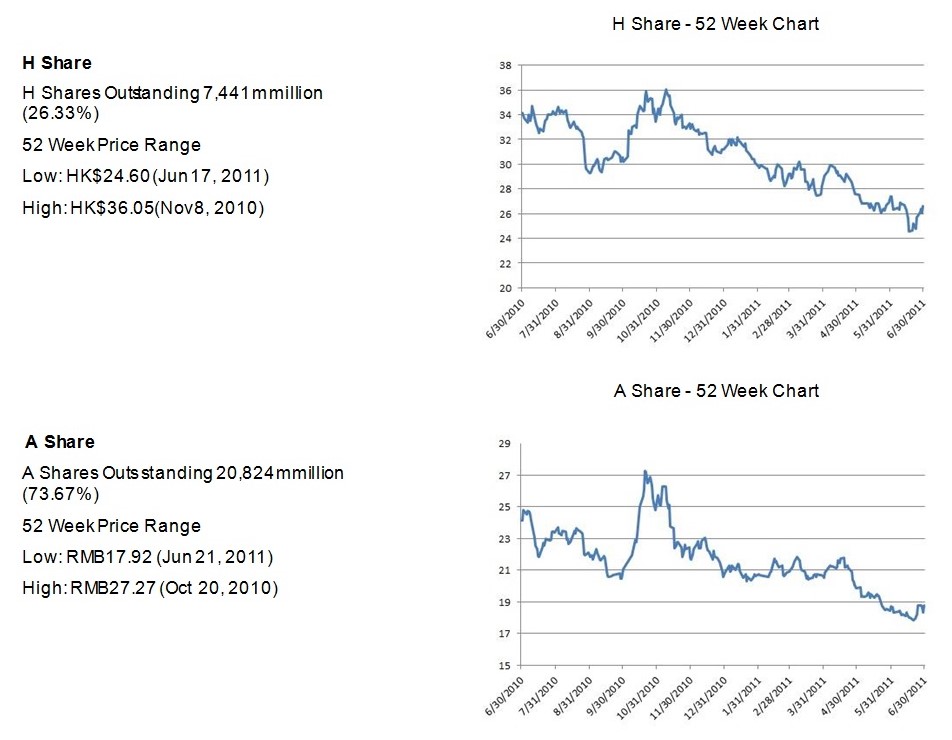
Stock Performance
Economic and Trade Information on Hong Kong for the current year;
- Hong Kong’s economy sustained strong momentum in the first half of 2011, with real GDP leaping by 6.3%, after growing by 7% in 2010.
- Consumer prices increased by 2.4% in 2010 and 5.1% year-on-year in January-August 2011.
- The unemployment rate was 3.2% for June-August 2011, compared to 4.4% in 2010.
- The value of retail sales increased by 25.6% year-on-year in the first eight months of 2011, after increasing by 18.3% in 2010.
- Total exports increased by 22.8% in 2010 and 13.3% year-on-year in the first eight months of 2011.
- A total of 36 million visitors, or more than five times the size of local population, came to Hong Kong in 2010, representing a 22% increase from 2009. In 2010, mainland arrivals reached 22.7 million, up 26% from 2009.
- The Supplement VII to CEPA were signed on 27 May 2010, providing 35 market liberalization, and trade and investment facilitation measures in 19 sectors, bringing the total number of liberalized service sectors under CEPA to 44. Services-related trade between Hong Kong and the mainland will be further liberalized.
Major Economic Indicators
Service Trade Performance
Bibliography
Amihud, Y, B Christensen & H Mendelson, Further Evidence on the Risk- Return Relationship, Working Paper, New York University,1992.
Bernstein, P, Against the Gods, John Wiley & Sons, New York,1996.
Bernstein, P, Capital Ideas, The Free Press, New York, 1992.
Black, F. & M Scholes, ‘The Valuation of Option Contracts and a Test of Market Efficiency’, Journal of Finance, Vol 27, 1972, pp. 399-417.
Chan, LK, & J Lakonsihok, ‘Are the reports of Beta’s death premature?’, Journal of Portfolio Management, vol.19, 1993, pp. 51-62.
Chen, N, R Roll & SA Ross, ‘Economic Forces and the Stock Market’, Journal of Business, vol.59, 1986, pp. 383-404.
Choi, FDS & RM Levich, The Capital Market Effects of International Accounting Diversity, Dow Jones Irwin, New York, 1990.
Damodaran, A, Investment Valuation, 2nd Edition, John Wiley & Sons. New York, 2002.
Elton, EJ & MJ Gruber, Modern Portfolio Theory and Investment Management, John Wiley & Sons, New York, 1995,
Fama, EF & KR French, ‘The Cross-Section of Expected Returns’, Journal of Finance, vol.47, 1992, pp. 427-466.
Jensen, M C, ‘Risk, the Pricing of Capital Assets, and the Evaluation of Investment Portfolios’, Journal of Business, vol.42, 1969, pp 167-247.
Kothari, SP & J Shanken, ‘In Defense of Beta’, Journal of Applied Corporate Finance, vol. 8, no.1, 1995, pp. 53-58.
Lintner, J, ‘The Valuation of Risk Assets and the Selection of Risky Investments’ in R Roll, A Critique of the Asset Pricing Theory’s Tests: Part I: On Past and Potential Testability of Theory, Journal of Financial Economics, vol.4, 1977, pp.129-176.
Markowitz, HM, ‘Foundations Of Portfolio Theory’, Journal of Finance, vol.46, no.2, 1991,pp. 469-478.
Matt, B, ’10 Steps to Building a Winning Trading Plan?’, Journal of Portfolio Management, vol.19, 1999, pp. 51-62.
Ross, SA, ‘The Arbitrage Theory Of Capital Asset Pricing’, Journal of Economic Theory, vol.13, no.3, 1976, pp. 341-360.
Sharpe, WF, ‘Capital Asset Prices: A Theory of Market Equilibrium under Conditions of Risk’, Journal of Finance, vol.19, 1964, pp. 425-442.
Stickney, C.P. Financial Statement Analysis, Dryden, Fort Worth.
‘Stock Portfolios and Capital Budgets’, Review of Economics and Statistics, vol.47, 1965, pp. 13-37.
White, GI, A. Sondhi & D Fried, The Analysis and Use of Financial Statements, Wiley, New York, 1993.
Williams, JR, GAAP guide, , Harcourt Brace, New York, 1998.