Company background
Dell Corporation established in 1984 by Michael Dell is the sixth largest producing factory in the world. The multinational corporation manufactures electronic device, multimedia tools, and computer peripherals. The list of products includes XPS, Dell Inspiron, servers, smart phones, gaming consoles, desktop computer, storage device, printers, and communication equipment. In 2013, the company’s workforce was 115,800 while its revenue reached 90 billion dollars. Consequently, the operating income and net income were 23 billion and 17 billion dollars respectively. As a result, the master budget can predict the financial growth of the organization.
Dell Corporation is preparing a 12-month budget for the year ending December 31, 2014. The master budget will include eight components.
- Sales budget & schedule of cash receipts
- Production budget
- Direct materials budget & schedule of cash disbursements
- Direct labor budget
- Manufacturing overhead budget
- Ending finished goods inventory budget
- Detailed selling and administrative expense budget
- Completed cash budget
The company’s data fact will be summarized in every sheet. The company’s data facts were based on assumptions and study forecast. As a result, the master budget will provide a detailed report of Dell products in Texas plant. The organization should expand the production of Dell Inspiron to meet customers demand. As a result, the master budget will cover two products for a 12-month period.
Dell product
Dell Inspiron
Sales budget & schedule of cash receipts
The estimated figures are based on student assumptions for 2014. The sales budget reveals the market pattern of Dell products for the fiscal year. The percentage distribution of annual sales revealed that product demand increased each month. Consequently, the expected sale was based on market demand for current and previous months.
Consequently, the expected sales in units increased from February to December. The account receivable for previous months was used to forecast the expected cash collections. As a result, the schedule of expected cash collections reflected the percentage sales from January to December. The assumptions were based on student forecast. Consequently, the production and direct labor budget were based on sales forecast.
The sales budget & schedule of cash receipts for Dell Inspiron will improve the functioning of the organization. The cash projections for Dell Inspiron increased monthly as reflected in the master budget. As a result, January annual sales in percentage differed from December projections. Consequently, January-December sales were 3% and 89% respectively. Consequently, the budgeted sale for Dell Inspiron from January to December was 215.82 billion dollars. The schedule of expected cash collections varied across each month. The estimation was based on the current month sales (55%). However, the previous month sale was 9.5% as estimated.
Production budget
The estimate for the production and manufacturing budget was based on the sales forecast for a 12-month period. As a result, the budgeted sales in January and December were 40,000 and 445,000 respectively. The beginning and ending inventory revealed that the required production exceeds the monthly budget for each product.
The Corporation manufactured 40,000 units in January against 445,000 units in December. Consequently, the ending inventory for January-December was 16,750 and 120,000 respectively. The opening inventory for January-December was 10,000 and 453,750 respectively. Consequently, the variable overhead rate, ending inventory, beginning inventory and production in units facilitated the budget forecast.
Manufacturing overhead budget
The manufacturing overhead budget revealed the firm’s total budget for a 12-month period. As a result, cash expenditure and production quantity were based on the overhead budget. The overhead budget revealed that direct labor in hours varied across months. Consequently, the variable overhead rate per unit was 90 dollars. The production units for Dell Inspiron influenced the overhead cost of December 31, 2014. Consequently, the variable overhead rate per unit was 90 dollars. Items in the manufacturing overhead budget include variable overhead, production units, amortization on equipment, insurance, supervisor salaries, properties and business taxes. The manufacturing overhead budget correlated all production components for Dell Inspiron.
Direct materials budget
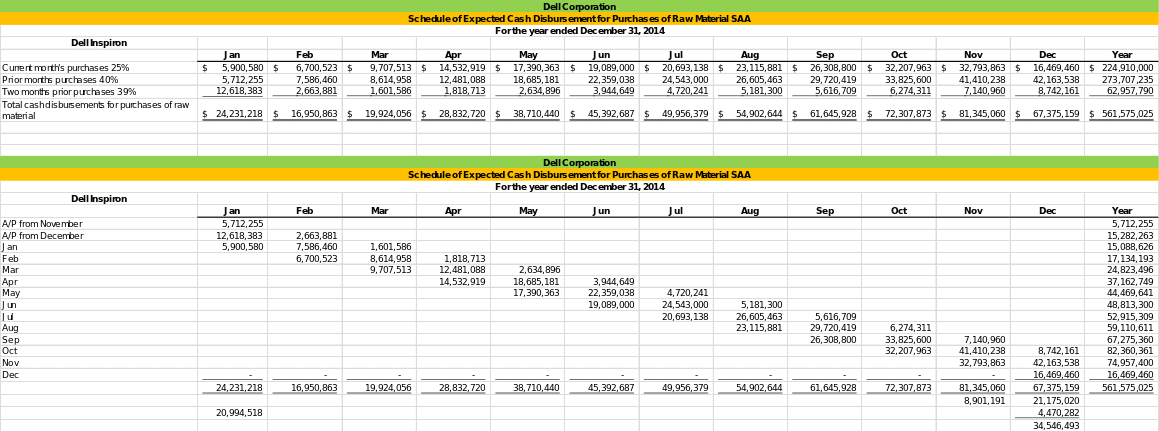
The raw materials used for production include silicon and aluminum. As a result, the cost of silicon materials was 30 dollars. The total purchases made for each month were based on the assumed sales. However, the current sales in percentage for previous months revealed the cash disbursements of Dell Corporation. The cost of materials reflected the production capacity for the manufacturing plant. However, product demand influenced the 12-month budget forecast. As a result, the production unit was multiplied by the quantity of raw materials in kilogram.
Schedule of expected cash disbursement for purchases of raw materials
The accounts payable in January and December were 24,321,218 and 67,375159 respectively. As a result, the production manager can evaluate the production rate based on cash disbursement from January to December. The budget expenditure for raw materials aligned with the current month purchases. As a result, payments will be based on the production capacity. The schedule of payment for purchases was based on previous and current monthly payments.

Direct labor budget
The scheduled payment was calculated based on production hours and units. The components of the direct labor budget include production volume, number of hours and employees. As a result, Dell Corporation estimated $6 per hour as a direct labor cost. The components of the direct labor budget include production units, labor time, and labor cost. The figures were assigned based on the estimated labor hours. As a result, labor time per unit was the same for the corresponding months. Consequently, the cost per labor was $30.

Ending finished goods inventory budget
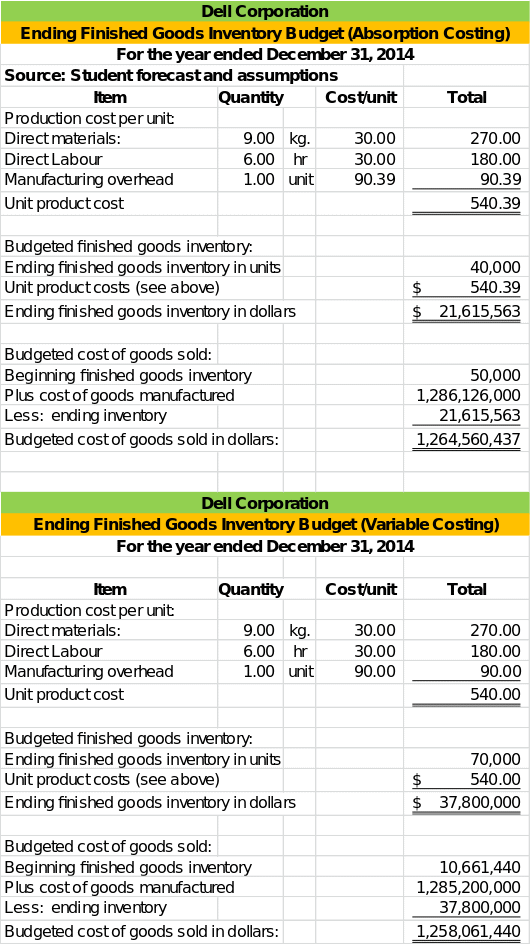
The ending finished goods inventory budget described the absorption and variable cost of the organization. The manufacturing overhead cost revealed that all cost variables were used in production. As a result, cost expenditures were assigned to all the manufacturing units. However, the variable cost was not assigned to all the manufactured products. The ending finished goods inventory budget has two sections in the excel sheet. The absorption cost and the variable cost. Each section was based on the cost of materials, quantity, manufacturing overhead, and unit cost. The components of the ending finished goods include direct materials (kg), labor time, and manufacturing unit.

Detailed selling and administrative expense budget
The detailed selling and administrative expense budget depend on the firm’s sales budget. As a result, the product variable expense, and administrative expenditures were computed in the excel sheet. The selling and administrative expense budgets consist of non-production expenses carried out in the current month. The list of expenses includes bad debts, warehouse rentals, and non-manufacturing expenditures. However, the company’s fixed expenses for the projected budget was 947,460 dollars.

Completed cash budget
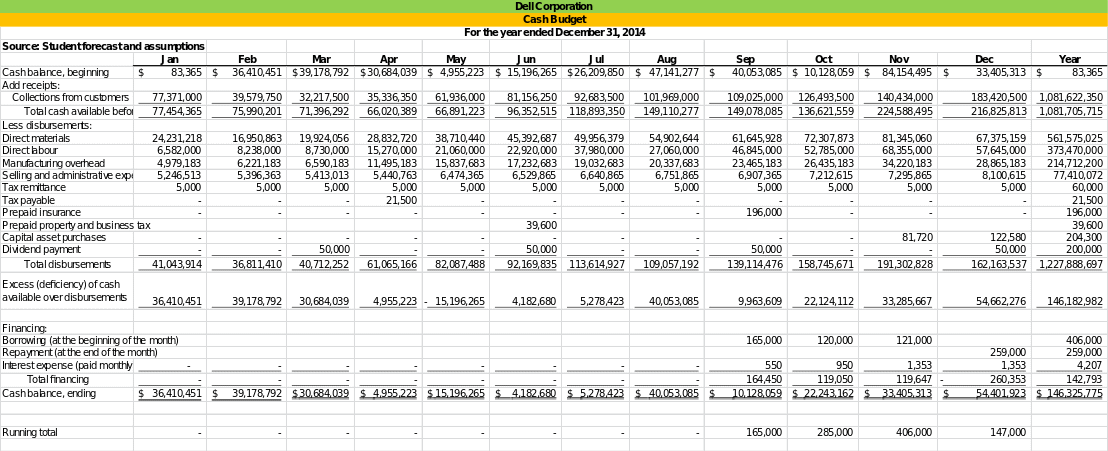
The completed cash budget comprises all manufacturing variables. Consequently, tax deductions and payments reflected in the completed cash budget. Items in the completed cash budget section include direct materials, less disbursement, tax payable, tax remittance, manufacturing overhead, direct materials and prepaid insurance. Consequently, dividend payments, capital asset purchase, and interest expense were summarized in the excel sheet.

Conclusion
The sales budget reveals the market pattern of Dell products for the fiscal year. The percentage distribution of annual sales revealed that product demand increased each month. Consequently, the expected sale was based on market demand for current and previous months. The schedule of expected cash collections revealed the revenue collection pattern for dell Inspiron. However, the account receivable for November and December was reflected in the budget. Consequently, the variable overhead rate, ending inventory, beginning inventory and production in units facilitated the budget forecast.
The manufacturing overhead budget correlated all production components for Dell Inspiron. Product sales varied between 9.5% and 55% for the current month. The production unit was referenced from the production & manufacturing budget. However, the cost of raw materials (Silicon and Aluminum) was $30. Thus, the budget analysis was based on the listed variables.
The components of the direct labor budget include production units, labor time, and labor cost. The figures were assigned based on the estimated labor hours. As a result, the labor time per unit was the same for the corresponding months. Consequently, the cost per labor was $30. The components of the ending finished goods include direct materials (kg), labor time, and manufacturing unit.
Recommendations
- Plant expansion is guaranteed based on the current forecast.
- Additional products for the Texas plant will increase the production capacity of the organization.
- The beginning and ending inventory revealed that the company’s operation is balanced.
- The master budget for the Texas plant must be replicated to improve productivity.
- Bad debts must be lowered to avoid company losses.