Introduction
SOA – Service Oriented Architecture and ERP – Enterprise Resource Planning are two domains in IT that have changed how organizations interact with applications. SOA provides a means to unify massive business processes by creating structures of large applications into services or smaller modules. Once the application has been split into smaller integrated modules, then individual departments or people can access these modules and carry out assigned tasks. It is also possible to build new ad hoc applications from these modules to construct new applications as per the user requirements.
In effect, SOA provides an envelope or a framework to for a group of services that would be able to communicate with each other. SOA removes the earlier ‘silo structure’ of applications and converts them into integrated modules. SOA also promotes reuse of software components and this feature allows very rapid and lowers costs for software application development. It should be understood that SOA provides the basic framework for integration of diverse applications and may not be used in developing applications (Classon, 2004).
ERP applications are massive enterprise wide software applications that would integrate diverse legacy applications that a large organization has developed over the years. ERP solutions typically cover functions like stores and inventory management, procurement, manufacturing, supply chain management, logistics, marketing and sales and others. ERP applications are the workhorses of large organizations with global operations and they help to control the production, inventory and ensure that various processes and operations run to meet the organization goals.
The utility of SOA and ERP in building applications was never an issue. ERP with decades of implementations in global applications has served its role very well, but the systems and applications are very expensive, complex and take months if not a couple of years to implement. SOA with its web services has become the architecture of choice for deploying smaller systems and applications for organizations. SOA is more economical to implement and low cost integrators from China and India can very well take up the development and implementation work (Brehm, 2006).
There are also many open source ERP products such as SugarCRM, Apache OFBiz, Compiere, Tiny ERP, Plexus that can be configured as per user requirements and implemented for lower complexities of applications. These have been integrated by web services of SOA for different organizations and in fact, CRM modules that do not handle huge volumes of critical data have been fully converted into SOA web services enabled. However, full fledged ERP suites such as SAP, Oracle, PeopleSoft and other are massive in size and if they are to be converted to web enabled SOA offerings with web services, then it is estimated that about 30000 individual web services will be required. This is simply not possible, as making all these web services talk to each other would be almost impossible.
However, with full-fledged ERP suites costing a few hundred million USD, major ERP vendors have realized that getting new customers is becoming more and more difficult and a majority of their sales comes from upgrades to existing customers. The market is not very eager to accept expensive ERP solutions for which organizations have to change their business processes and not the other way around. Oracle, SAP and PeopleSoft have taken up projects that involve using the SOA and web services for some of their common modules such as HR, Finance, CRM and even supply chain management (OpenERP, 2009).
This thesis discusses and researches ERP, SOA and how they can be integrated to allow strategic management for the global business environment.
Research Question
The research question is framed as “Strategic Management with Enterprise Resource Planning Systems and Service Oriented Architecture in the Context of the Global Business Environment”.
Aims and Objectives of the Study
The objective of this study is to contribute to the growing body of knowledge in this field by exploring both the technical and theoretical foundations underlying the process of the Strategic Planning of the ERP System and SOA. In the context of the Global Business Environment, we design a genre framework to understand the process in a holistic view, identify the critical factors of the project, and assess their effectiveness in the implementation of the project. Also I will test this model in the context of the global business environment and how it’s affecting it, by looking at the Critical Success Factors(CFS) and developing an ERP projects based on best practice perspective.
This study aims to contribute to the growing body of knowledge in this field by critical examination of the alignment of IT with strategic at the role that ERP systems play. In scope, the study will commence with exploring the technical and theoretical foundations underlying Strategic ERP systems as implemented globally, continue to a scrutiny of the inherent strengths and weaknesses pertinent to this category of IT systems and analyze near-term prospects. We shall develop a vision of the outlook for ERP via an in-depth understanding of growing demands of IT systems; how success or failure is linked with corporate culture and leadership styles; and identifying critical success factors.
The objectives of the study covers:
- To develop a holistic view of strategically managing the acquisition and deployment of an ERP system via an authoritative review of the literature, buttressed by an empirical field investigation using a combination of qualitative and quantitative methods.
- To explore the case study approach for a synthesis of the dominant success factors for an ERP implementation.
- To highlight the major challenges commonly encountered when acquiring, implementing and maintaining ERP systems.
- To develop a thorough understanding of SOA, its implementation strategy and where the technology stands as of today
- To critically investigate successes and drawbacks by firm size, implementation strategy, markets or countries, centralized versus decentralized organizational management.
- To explore how ERP and SOA can be integrated to build economical and feasible solutions for enterprises
- To examine the feasibility of using Software as a Service – SaaS model for SOA and ERP platforms
- To extract best practices and other recommendations for those planning for, or already making a career of, consulting for ERP implementation.
Purpose for taking the research project
The PhD research should underpin improved provision of the importance of the systems for the management to take in concentration when designing the strategies of the Enterprise Resource Planning issues for the organization. Enterprise Resource Planning (ERP) implementation is a technological breakthrough that is challenging and changing the operations of businesses and organizations around the world. ERP offer a software-based system that handles an enterprise’s total information system needs in an integrated fashion, ERP focus in on all aspects of operations within a company from Finance, Accounting, Human Resources, Customer Relations, and Inventory to the result which is the product output or service that the consumer receives. The successful strategic planning of the ERP incorporates the delivery of ERP and implementing the system into the Organizations.
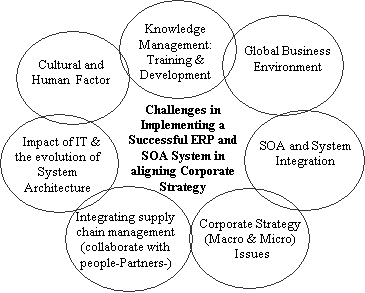
This research and study will focus on ERP system implementation from a strategic and technical perspective and in the context of the global business environment. Also it examines the success or failure factors of ERP projects. The proposed model for strategic managing with ERP System in the context of the global business environment as shown in the following figure, links together the challenges in implementing a successful ERP system in aligning corporate strategy in an organization, which will include six components charted in (Figure 1.1), the aspects demonstrate the characteristic being that they are integrated into completing the system. The first is the Cultural and human factors, 2-Knowledge management: training & development, 3- The impact of IT and the evolution of System Architecture, 4- Global business environment, 5-Integrating supply chain management (collaborate with people-Partners), and 6- Corporate Strategy (Macro & Micro) Issues.
This proposal will be tested in depth in the next stage of research to show the successful way of handling the process of implementing an ERP system and aligning it with the corporate strategy. It uses a case study methodology to compare a successful ERP implementation with an unsuccessful one. The study proposes working with functionality, maintained scope, project team, management support, consultants, internal readiness, training and planning, and will focus on the adequate testing, which will be critical to the success of ERP project implementation and also dealing with organizational strategies. Development, diversity and budgeting are other important factors that are contributing to a successful implementation.
Rationale for the Research
This section presents the rationale for the research and would show why the paper has relevance to today’s industry needs.
SaaS, SOA and ERP
Software as a Service – SaaS has emerged as a strong player in the application services area. In this model, a software vendor gives licenses for an application to customers who use the applications as a service on demand. Software vendors either host the application on their internal servers or provide time bound or transaction based access to the customer.
Additionally, they may even provide download facility to the internal network server of the customer and disable it after the set license period expires. Advantages of this model are that the cost of licensing is very marginal when compared with the cost of acquisition. Customers who may not have sufficient development expertise can demand new applications to be delivered at reduced costs. This concept is an extension of the application service provider that existed a few years back. It is estimated that by 2015, SaaS would increase its business by 500%.
Many applications have been offered through SaaS and they include CRM, HRM, financial and accounts management, web content management, eMail services, IT security, IT service management and so on. Many leading firms such as Oracle have started offering SaaS. One small company called Salesforce.com that offers SaaS and ERP solutions on SOA has reported a turnover of 1 billion USD for 2008 year end. There is thus a growing interest in SaaS as a means to reduce software procurement, development and maintenance costs.
An important success factor for SaaS is that it would work only when economies of scale are in place and when a majority of customers are ready to buy off the shelf and commodities products. If each customer would require some element of customization, then the concept would be in trouble since the service provider would not have the means to provide customization for everyone. The concept would also not work if highly customized and niche products are required (Bennett, 2000).
SOA forms an important driver for SaaS and creating each software service as a service provider, it is possible to make the different services speak to each other. The functionality of the applications can be offered to customers using public brokers and adding functionality and data. SAP has introduced the ‘SAP Business By Design’ product that is a fully integrated ERP offering for SMBs. The product is a good instance of combining SOA, ERP on the SaaS model. The application would reside in the company hosted servers and access is provided to customers PCs and hand held devices. In this model additional concepts such as Cloud computing and infrastructure as a service – IaaS and also platform as a service – PaaS have been used.
However, the business model has certain risks like if the service provider goes out of business overnight, then the customers would suddenly be cut off from the organizations database. Reliable service providers such as Oracle and SAP have better prospects than unknown and small companies that may vanish overnight (Fu, 2008).
Problems with ERP
Experts in the ERP implementation in various industries have often vilified ERP solutions as a ‘massive government organization that very few understand and very few can control’. While such reports are exaggerated, they reveal the frustration that these application creates during development. Part of the problem is that many of the modules for HR, finance, manufacturing, inventory, supply chain management, sales, logistics and others require a certain set of business rules. These business rules are to be clearly defined and well adhered to by the organization and this rarely happens. Organizations have to operate in the open market where the ground realities are different and they may keep changing now and then. When a sales forecast is made, it factors in indicators such as the GDP, cost of living index, purchase parity, inflation, historic market demand and others and uses complex algorithms to make the forecasts. The whole cycle of procurement from vendors, inventory management, billing, recruitment, manufacturing and marketing would be based on these forecasts. If the forecast has some errors, then there will be a bull whip effect in both the upstream and downstream flows and the result is either a bloated inventory of raw materials and unsold goods or a stock out situation. Both these effects can ruin businesses.
However, ERP solutions can factor in some elements of corrections manually and massive losses are usually averted. In addition, the fact remains that in many organizations with some legacy applications, integrating the databases of these applications with the central ERP solution becomes very difficult. Ensuring that the applications can speak with each other becomes a bigger problem as data integrity has to be retained, data tables have to be updated and there are many other problems that ERP implementers face. In many cases, the legacy applications are not very well defined and structured and usually the local expert would carry out regular tweaking and trouble shooting to ensure that the legacy applications are running. These problems cannot be handled by the ERP application and hence the bad name (Rettig, 2007).
How SOA could address the ERP problems
The fact remains that large ERP solutions that are very complex have a large amount of embedded logic that has come after years of fine-tuning the code and can be regarded as the best practices. Commonly used modules such as finance and HR that are widely used have extensive embedded logic. SOA helps to extract and leverage the varied IT capability that is embedded in large applications such as ERP and in various modules that form business applications. It is possible to extract and integrate the best features of important modules of ERP using SOA and to build applications that would suit user requirements. Please refer to the following figure that illustrates a typical ERP layout (Specht, 2005).
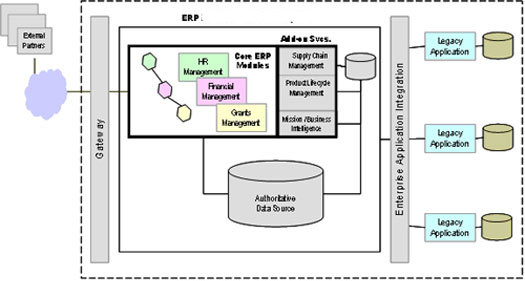
As seen in the above diagram, some core ERP modules such as HR management, financial management, supply chain management as shown and these are connected to an authoritative data source. These core modules of the ERP application are regarded as the core business enabling services by the prospective SOA framework. Typically, the ERP applications would regard modules such as supply chain management and product life management as plug in applications that can be added on to the core modules as and when required. These add on modules may be very important to organization objectives and may also be in the area of key success indicators. These add on modules are often very crucial for a department and they work to meet the organization needs.
However, these modules again require extensive configuration, customization and may be driven by specific enterprise business rules. The core modules such as financial management would have to follow the accounting and regulatory rules of a country. There is not much difference in the manner that accounts are entered, journal and voucher entries created in different companies and any financial statements that are made have to conform to certain regulatory bodies. It is always possible to use these core modules among different enterprises to suit individual needs with a little bit of configuration.
The add on modules on the other hand displays the real skill of an ERP vendor who has spent millions of man years in developing these solutions and they reflect the best practices of an industry. These core modules are again driven by specific business rules that are unique to a company and it would not be possible to plug and use them in other enterprises. Any ERP vendor and implementer who want to implement the core modules and add on modules integrate these modules and uses them as business services. If SOA has to be adopted as a framework for transforming the organization, then when an ERP implementation has to be done, all the IT systems of the business, applications, legacy applications and infrastructure would have to be adapted to the SOA framework. Thus, the ERP modules would be central services for the SOA framework and help to meet the SOA objectives (Maurizio, 2007).
SOA depend on modularity concepts and service layers that be arranged in nested dependencies of robust services so that they can be used to run business functional requirements. SOA differs from traditional architecture in that it attempts to separate data from the business logic by giving separate program layers that different applications can share. As a result of this when the business logic is similar, it need not have to be written into each application that has to use the logic but it can be called from a central business logic and business rules repository.
This also implies that when business logic has to be changed then it needs to be modified in one place only and far lesser efforts are required to implement the changes. Therefore, multiple business applications can use the changed business logic. Interestingly, ERP solutions are in many cases provided with some web service tools and obey the web standards that are implemented across a wide number of applications so that disparate legacy applications can be integrated on different technological platforms (Muscatello, 2008).
While web services from ERP applications are not very robust in terms of communicating with external applications and rather follow a dedicated set of instructions, these services can be used through SOA to allow the integration of the legacy applications and the business services of ERP applications. While it is expected that developing and using web services for ERP integration would take some time given the extent of coding and framework to be developed, a start has to be made somewhere. Once the initial developments are made and the learning’s captured, further implementations would become much more straightforward (Rego, 2007).
Largely SOA can be utilized to hide the complexity of legacy applications of an organization. When portal access is allowed through the legacy applications, customers can use consistent and common views to the data and business logic though the information would be accessed by different users through multiple applications that may be operating in different production environment. Since ERP solutions are prepackaged with functionalities, they can be used along with embedded development tools within the SOA framework to create the required web services support for integration of legacy applications. If SOA is properly implemented, then it can lead to time and resources for legacy integration. Custom built applications can be installed along with business enabling services and these can be activated as important ERP solution components. A beginning can be done with the core ERP applications such as HRM and financial management and then further add on applications can be integrated (Carey, 2008).
Competition between SOA and ERP
There have been widespread speculations that SOA would spell the doom for ERP and that with the introduction of SOA, ERP will become obsolete. Nothing can be farther from the truth and such speculations are founded on ill-conceived notions and understandings. SOA provides a framework designed to link some applications that can use web services. By itself, it cannot do anything and it still needs applications that have to be integrated. The fact now remains is that big time ERP vendors such as SAP and Oracle build complex solutions primarily for the enterprise level of large corporate. A move of SOA and ERP would allow small time ERP vendors to also provide solutions to small and medium businesses. However, these small vendors would still be building solutions that can be run and integrated using web services. This development has placed the interests of big time ERP vendors at risk since they would lose out on the opportunity of SOA, if they do not accept SOA. The very fact the large ERP are difficult to implement and make integration a big problem encourages the use of SOA. Therefore SOA and ERP bus would anyway leave on a trip and if the big time ERP vendors do not join, then they would be left out (Hansen, 2006).
There are some small ERP vendors such as Open ERP that offer complete ready to implement solutions, ranging from 1500 Euros for SMB applications to 6400 Euros for Corporate applications. Such companies have developed robust solutions that can be deployed with much lesser effort through SOA and at far lesser costs. Since one can always buy modules as required, further upgrade becomes much more simpler (OpenERP, 2009).
How ERP and SOA can work together
The main problem with ERP is a lack of agility and rich functions that allow quick scenarios and business cases to be run. What the market currently requires is a sharp and reduced reaction time that would allow quick deployment of applications (Kashef, 2001). By using SOA, it is possible to create an execution platform that would function along with ERP and this would reduce the complexity. The execution platform can be used to handle any process change by changing the business rules or the configuration manager and not resorting to complicated code changes in the ERP applications that would take a lot of time followed by testing to see how it has impacted other functionalities. Such a move would allow very quick completion of objectives since each software application would present its capabilities as a service and the services can be changed as required (Classon, 2004).
As an example, one could consider that a certain product has its price revised as per different slabs based on number of units bought by the customer. If a sales and inventory ERP system is running, it would be very difficult to change the price. Some actions would be required such as seeing the areas where the product is sold, name and address of the distributor so that they can be informed, informing the warehouses and authorizing the changes, holding up inventories of items in the pipelines, attempting to recall the products, changing the stock keeping unit in all locations, informing partners and so on. The task would become much more difficult if information had to be entered manually and all the databases refreshed and this would probably take a few hours.
However, by using SOA, the business rules can be changed at one location in the execution platform and the new rates fired through the system at all locations. This process would take a few seconds at the most and save on costs and time. SOA also allows web services to be created and reused for some reasons such as product recall, placing a product on hold, upgrading products and so on. Web services can be created for each of these reasons and applied as and when required. It should be noted that ERP has not been done away with but that it forms an important aspect of the business function and that SOA is only being used to interact with the ERP application (Hitt, 2002).
Methodology Used
The paper has used a combination of qualitative and quantitative methods to research the paper. Research has been performed using a literature review of peer-reviewed journals, books by experts in ERP and SOA, review of reputed newspapers and databases of service providers such as SAP, Oracle, PeopleSoft and others. A list of key words was prepared for the topic and a search was conducted using online libraries such as Questia, Thomas Gale and ProQuest. Content was obtained from these archives, some printed publications, and the content was sorted to find their appropriateness for the research questions. A list of reserves was then created and the required content was read and interpreted and the analysis along with the implications was written down in this paper. The paper has also created a questionnaire that was presented to some professionals in SOA and ERP and their replies were analyzed to form an experts opinion on the subject.
Technology Acceptance and Diffusion
History has seen some inventions that would appear as very technically sound and useful but which was not adopted by the mass market initially. Some of the examples are the escalator, the steam boat and many other items. People and this included the nobility, the scientists of the ancient world and many others, were simply not ready to accept new and advanced technology that would have helped them immensely. Therefore, technology thus took some time to diffuse into the public domain and there would be a period of delay, during which technology would find wider acceptance and use. The time required for diffusion of technology has indeed reduced, but there are certainly some psychological barriers that prevent a new technology from being adopted. This chapter examines some well known theories of technology adoption, that are relevant to the thesis.
The topic of technology adoption and the delay required for mass adoption is important since the ERP and SOA integration needs to have a sufficient mass based and wider adoption. Innovation and development would be assured only when application developers can see that there is sufficient potential and market.
Technology Diffusion Theories
This section presents a few well-known theories on technology diffusion and acceptance.
Rogers Diffusion of Technology
Rogers (1962) in his book ‘Diffusion of Innovations” speaks of how technology is diffused in a society. He speaks of diffusion as the method used by an innovation to be communicated by using certain channels among different groups in a social system. This method is very important when it comes to forming models of consumption and to a certain extent, it has given trend to the ‘keeping with the Jones’ syndrome and has a direct bearing on the thesis objectives. The author has attempted to explain the mechanics of the why and how and the rate that innovations, new products and technologies are spread through different social groups and cultures.
The findings hold for technologies, consumer goods, food items and so on. The author undertook the study in 1950 to find the effectiveness of advertisement used in broadcasts. In those times, many products could be called as innovations and very few people had used them. The study brought up some facts and these are still used in marketing. The author noted that contrary to expectations; print media or TV advertisements were not the main reason why people bought products.
In a society, there are different types of adopters of the technology or product and these are: early adopters or innovators, secondary adopters, tertiary adopters, quaternary adopters and then the laggards. Roger asserted it would be innovators that would first try out a product. This group was often well educated, came from well to do families and had a high net worth. The group also commands respect in their society and it is this group that first buys a product or adopts a new technology. Next in line were the secondary adopters who would wait and watch to see what the innovators had to say about a product and this group would buy a product only if the innovators endorsed it.
The tertiary adopters would further wait and watch to see how the innovators and the secondary adopters felt about a product ascertain that the quality and price was right and if everything was acceptable, they would in turn adopt the product. The quaternary adopters were the next in line and would require further reassurance that the product was indeed suited for their needs and then make their decision. The laggards were the last in line and they were frequently the oldest among the group and the last ones to buy or adopt a technology.
Roger pointed that in a closed society, it would be much more effective if manufacturers first targeted the innovator group and encouraged them to buy a product or adopt a new technology and then endorse the product. Sports goods manufacturers, fashion products and others, are still utilizing this method of advertisement widely and celebrities such as sport stars or film stars are seen to be using a product so that sales can pick up. However, overuse of this method or multiple endorsements by a star would lead to overexposure and loss of efficiency of the medium.
Technology adoption lifecycle
Brown (2003) has provided a good review of the technology adoption lifecycle, based on the Diffusion of Innovation model as described by Rogers. The author has based her article on the lower than expected sales of PCs in the US domestic market in 2003. Leading manufacturers such as Gateway, Dell, Apple, AMD and others had assumed that the sales would increase once the cost of PCs was lower than 1000 USD. These predictions had been made by some leading marketing agencies who were assuming the people who were interested in technology would buy more products once the technology became affordable.
The author reports that the market researchers did not consider if price was the only barrier for those interested in buying a PC or if there are any other additional barriers. The author calls this the ‘non-adoption phenomenon’ and this is very important when the question of mass consumption of a technology or removing the digital divide has to be considered. The model proposed by Rogers was slightly modified and an illustration is as given below that shows the technology adoption life cycle:
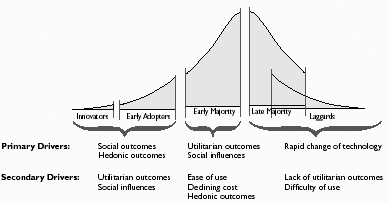
There are five categories of technology adopters and they are innovators, early adopters, early majority, late majority and the laggards. According to Brown for any innovation, 16 percent of the adopters are made of innovators and early adopters while 34 percent is made of the early majority, 34 percent is made by the late majority and the remaining 16 percent by the laggards. Non-adopters are not included in this model since it is assumed that everyone would ultimately adopt the technology. As shown in the illustration, there are some primary and secondary drivers for each category.
Challenges for technology adoption
Venkatesh (et all, 2001) speak of the challenges for technology adoption and this area is very relevant to the thesis objectives. According to the research conducted by the authors in American households, PC adoption is influenced by factors such as hedonic and utilitarian outcomes and by social outcomes such as status in the society. The authors also reported that issues related to the quick changes in technology and the fear that the products bought may become obsolete influenced non-adopters. Technology implementers have to consider the influence of social and hedonic influences and the cost factor are important to consider.
Studies show that cost was related to the technology and while the basic configuration of computers such as RAM, processors clock speed and hard disk space is important, there is a marked deviation when it comes to buying higher end computers that may have added features. Fear of the product along with the cost acts as a main barrier for non-adopters as they tend to be influenced the frequent advertisements of new features that are introduced. While the study was related to the PC market, the arguments would hold for any new constantly evolving technology and market.
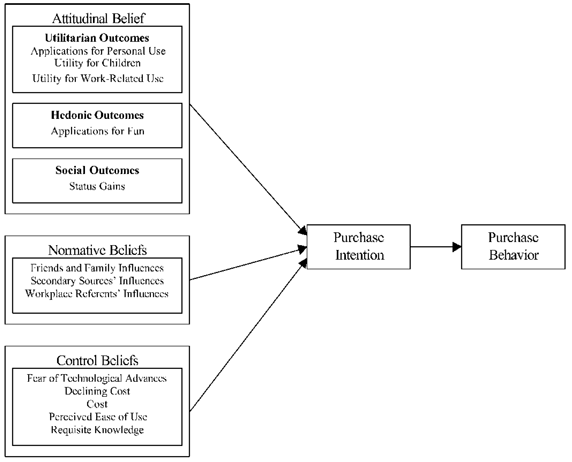
As seen in the above illustration, the purchase intention and purchase behavior is reinforced by some factors and they are: attitudinal belief, hedonic outcomes, social outcomes, normative beliefs and control beliefs. All these lead to the technology adoption behavior and this is equated with the purchase behavior as adoption and purchase are regarded as commitment. Attitudinal belief is made up of factors such as utilitarian outcomes that include applications for personal use, utilities for children and work related used. These are the core beliefs that would make a person take up technology adoption and they form the topmost tier of the factors.
Next come the hedonic outcomes and certain technologies are adopted only for the hedonic pleasure they give. Social outcomes have factors such as the status gains and this factor would mean that a technology is adopted just because it would give the adopter some kind of a social status. In some people, this outcome is dominant than the other factors and adopters would tend to feel that adopting a technology would give them a lot of prestige. People who would adopt a technology because of this factor would also be called as innovators as per Rogers model of technology diffusion. Normative beliefs are formed from influences by friends, family, from secondary sources and by interactions from the workplace. People in this group would tend to fall in the secondary and tertiary groups of Rogers model.
The author suggests that this approach is very prevalent in close social groups, in organizations and where people belong to a network of friends. Typically, people from this group would wait till someone they know has tried out a product and the decision to adopt the technology or abandon it would depend on the feedback they receive. In today’s connected world with communities such as Orkut and Facebook, people from across different geographies would ask for feedback about a particular product of technology and also offer advice and their opinions if they had any experience with a particular technology or product. Workplace influences also play a very strong role as people would tend to trust the people they work with everyday. Control beliefs are the barriers for non-adoption of a technology. Some of the factors include feat of technological advances that would threaten to overwhelm a person who would not be able to cope with the changes.
Another factor is the cost and it has been observed that as time passes, technology becomes more cheaper and this is the case with some products such as mobile phones, computers, lap tops and so on. In such as case, people would prefer to wait to hope that the price would keep reducing further. However, this influence and belief do not last for a longer time and ultimately the person would adopt the technology at its available state (Venkatesh, et all, 2001).
Theory of Reasoned Action – TAR
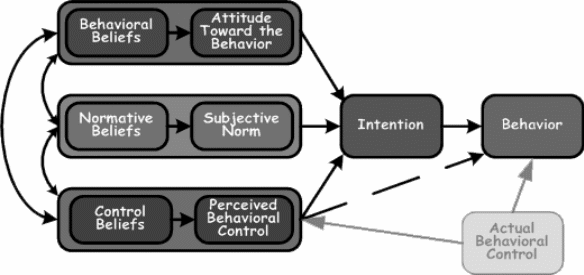
Originally propounded by Fishbein (1975), the theory of reasoned action – TAR is based on the social psychology concepts and argues “peoples voluntary behavior can be predicted by their attitude for that behavior and how they think that other people would view them if they carried out that behavior”. Behavior is formed by people’s attitude when it is combined to factors of subjective norms. There are three types of constructs for TRA and they are: behavioral intention – BI; attitude – A and subjective norm SN and the relation between these entities is BI = SN + A.
If a person inclines a particular type of behavior then he would display it. People’s intentions and will are influenced and directed by the subjective norms and their attitude towards behavior. The factor of Bavaria intention is used to measure people’s relative strength of intention to carry out certain behavior. The factor of attitude is made up of certain viewpoints that a person has about the results when behavior is performed and this would again be a result of how they value the results. The issue of subjective norms is regarded as a mix of the foreseen expectations that would result from individuals and groups and the intentions that they would show to comply with the prospects.
People’s observation that people who are vital to then feel that they must or should not carry out the a certain behavior. The author points out that even though norms and attitudes are do not have equal weight in prediction behavior, these factors would have different effects based on the situation and the individual. Following figures illustrate the main points of the theory:
Attitudes represent the total sum of the views and beliefs that a person would have for a specific behavior that would again depend on the analysis of such beliefs. As an example, a smoker may have a different attitude towards the health risks posed by smoking and he may even feel that smoking is bad for the health. Nevertheless, his behavior would be contrary to his beliefs when he continues smoking.
Another example is that of exercise. A person may have a very positive attitude towards fitness, exercise and may regard athletes with high regards and he may even take up an exercise routine. However, his beliefs could be that exercise is very tiresome and uses a lot of time and energy and gradually his behavior forces him to abandon his exercise routine. Subjective norms view the influence that other people in a social group exert over a persons behavioral intentions or beliefs. There would be a balance struck between what people in the social environment feel and ones own beliefs and the outcome would depend on the more dominant of the factors. As an example, a person may belong to a group of friends who exercise regularly and the social influence would force a person to take up exercise.
However, eventually the person’s beliefs would suggest that exercise is a waste of time and this creates a type of self-hypnosis that would eventually force the person to view exercise as a wasteful pastime or for the wealthy that have a lot of time to spare. The person may eventually abandon the exercise plan and may even forego the company of his friends as their influence and beliefs are contrary to ones own beliefs. This is an example of a negative subjective norm. On the other hand, it would be very well possible that the social influence may exert a positive subjective positive norm. As an example, drug addicts or alcohol addicts may undergo a rehabilitation therapy session where some addicts would gather with the single objective of abandoning their addiction.
A person undergoing this kind of a therapy would be influenced by the collective social norm that attempts to force a person from alcohol or drugs but his personal beliefs, in this case addiction may want to prolong the habit. When the collective social influence is dominant, it may force the person to abandon his addiction and this happens in many cases. On the other hand, if the personal belief or addiction is so severe that it is immune to the influence of social subjective norms, then the addiction will prolong.
Ajzen (1980) has made some interesting comments about TAR model. In practice, there are three conditions under that act to limit the utility of subjective norms and attitudes for foreseeing intentions and further, the prediction of performance behavior by the use of intentions. The three conditions are goals v/s behavior, availability of choices and the intention against estimates. The first condition of goals against behaviors gives the difference between the goal and behavioral intention.
As an example, a person may decide to lose weight and may have set a goal of losing 10 kilograms in 6 months and this is the specific goal intention and then the behavioral intention may come in and he may decide to use some type of diet medication that would make him feel less hungry so that he eats less food and thus achieve his goal of reducing the weight by 10 kilograms. The second is the availability of choices and taking the previous example, the person has a few choices available such as exercising to reduce weight, going on a crash diet, excising and adopting a diet and another choice that of taking only medication pills.
Among all these choices, the first, second and third choice would be most logical and have a higher degree of giving result but they are also the most difficult while the last choice of taking only medicines has the least possibility of producing sustained results. The author implies that in many instances, subjective norms and attitudes strongly influence people’s behavior and change their attitude and people may take the path of least resistance and efforts to achieve their goals. One good example is the goal to become rich and earn a million dollars. Many people would work hard their whole lives in very legal and socially acceptable jobs and may never achieve their goal but some people might resort to illegal means such as theft to earn the money. In such cases, social norms may dominate and change the attitude of people and decide how they behave. The third condition is the intention against the estimates and this occurs when a person has one set of intentions but may choose to act differently.
Bass Diffusion Model
Bass (1969) introduced the Bass Diffusion model that details the mathematical process to show how new technology and products are adopted when users of the product interact with novices or potential users. The theory has been built on the Rogers Diffusion of Innovation Model. The Bass model is used by researchers and marketing organizations when they would want to introduce a new type of product in the market. While Rogers model relied on fieldwork and practical observations of the agricultural industry of US in the 1950’s, the Bass model is based on the Riccati equation.
The model has three coefficient variables: m is the total number of people in a market that would ultimately use the product or the market potential; p is the possibility of people who are not using the product would begin to use it due to the external influence of early adopters and the publicity from the media and this the called thee coefficient of innovation and q that is the possibility of people who are not using the product would start using it because of internal influence or word of mouth publicity from early adopters or people that are in close contact and this is called the coefficient of imitation.
The formula used to predict the Nt the number of adopters in a given time is:
Nt = Nt-1+p(m-Nt-1)+q(Nt-1/m)(m-Nt-1)
Where Nt is the number of adopters in a specified time frame t.
As per the empirical research of Mahajan (1995), the value of p is between 0.02 and 0.01 and q has a value of 0.38. These values can be used in the equation along with probabilistic values for other coefficients to find the number of adopters in a society. When applied with good fieldwork, the model is found to produce very accurate results and allows forecasting to a high level of accuracy. Product manufacturers and technology innovators have often used this model to forecast sales and revenue generation among the target group. Certain modifications have been done over the course of time to increase the accuracy level of the model and to suit different market and product levels.
The model is found to work with predictive and stable goods and technology and it is difficult to use with fad products such as beauty products or fashion accessories, toys and other goods that may have a short shelf life of a few weeks if not days. The model has been used extensively in forecasting marketing potential and sales of new innovative products such as mobile phones, high definition TVs and many other products.
There are some software applications are available that allows calculation of the forecasts for adopters of a technology and databases are also available that gives the values of p, q and m for different product, based on extensive market research (Lilien, 1999).
The market needs to be imagined to be made of two groups of people and one group is made of the adopters or the innovators and the other groups is made of the imitators or the potential adopters. In an open system that allows the two groups to interact, there would be an exchange of ideas and concepts between the two groups. While the innovators or adopters would be quite comfortable with the new technology, the other group would be collectively made of late majority and the laggards. In an open system where there is no restriction on the flow of information between the two groups, there is a constant flow of information and news and the intensity of the flow measures the rate of infection of the ideas. If the second group of potential adopters are waiting to see the beneficial results, then the rate of infection would be very fast and adoption of technology may become a fad, s social status symbol and people may adopt the technology for the hedonic feelings.
However, if the people in the potential group are made of diehard cynics who are bent on stopping the adoption of technology for political reasons, then this would indeed create a problem and the group may very well succeed in thwarting the new technology from being adopted. if such forces are not evident in the social system, the rate of infection would increase as a function of utility of the product, the target age of the adopters and the cost. If all these are acceptable, then the rate of adoption would be very fast.
Following figure shows a graphical representation of the mechanics of flow between the two groups of innovators and the imitators. The innovators would be fewer in number initially and with passage of time, the number would start reducing, not because the product has lost appeal but because the imitators are fast catching up. The imitators would start from a lower value and then the number would rise steeply and assume a bell shape curve with a sharp peak. The time required to reach this peak would depend on the utility of the technology and its cost.
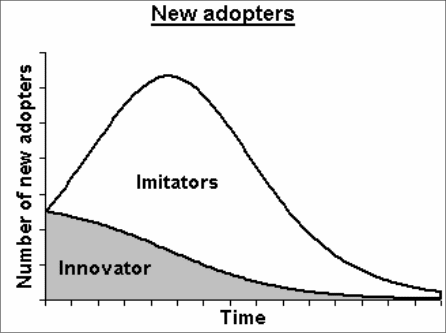
As seen in the graph, the curve for imitators would rise sharply and then fall at the same rate and would prolong for some time beyond the innovator curve. After a certain point of time, the technology would have become either widespread or may have become obsolete or new and better products and technology may have come up.
It must be noted that the tool should be used only for product categories such as CD players, computers or any other product categories. It should not be used to find the market share of product manufacturers such as Sony, Samsung, Philips and others.
Technology acceptance model – TAM
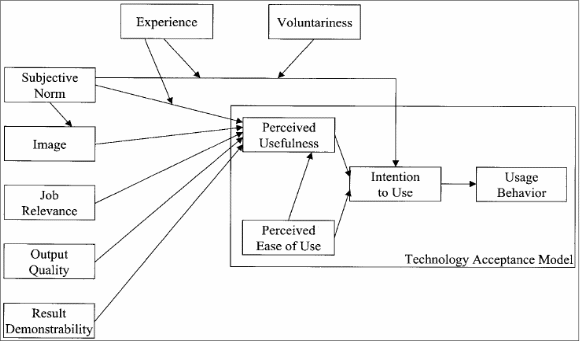
Technology Acceptance Model – TAM was developed by Davis (1989) and Bagozzi (1992) and that deals with how different users would be willing to accept an information systems application and use it. When users are faced with a new technology, they are faced with two main factors that can act as dilemmas or drivers and influence the acceptance and use. The two factors are perceived usefulness – PU and the perceived ease of use – PEOU. Perceived usefulness is the extent to which a user perceives that the information system application would help him in his job or for a particular task while the perceived ease of use refers to the extent by which the user feels that the system would have reduced effort. TAM has given rise to a wide branch of technology and psychology such as usability engineering, usability metrics and others. With the current increase in the number of applications in information systems, TAM has acquired a new meaning.
For ICT to be successful, it has to be acceptable to people, it must help people to fulfill a need and it must be easy to use and TAM helps developers to develop a better understanding of the application they develop. TAM was based on theory of reasoned action and while TRA was based on the measure of attitude, TAM is built on the principles of usefulness and ease of use. There are two types of users, voluntary users and forced users. Voluntary users are the public that can decide if they want to use a particular technology and they have alternative technologies available while forced users are employees that are forced to use computer applications and who do not have a choice since the work profile demands it. Researchers have realized that to make technology useful; forced users must also voluntarily accept a technology else productivity falls. Computer applications are introduced to ease the burden on employees and to increase productivity, reduce throughput times and have a quicker turnaround. But if the technology is cumbersome, not user friendly and employees spend considerable time in figuring out how it works, then the main intent of using the technology is missed out. Following figure gives an illustration of the TAM model.
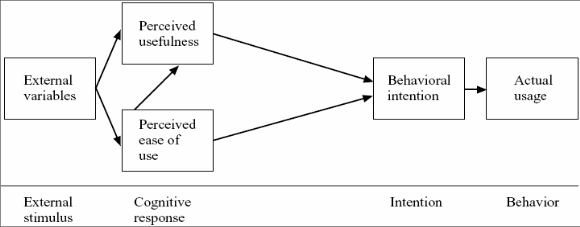
As seen in the above illustration, there are TAM can be effectively used to assess and predict user acceptance of ERP and SOA applications and find widespread use in the industry. IT applications may cost thousands of dollars and while the system may function very well from the developer’s perspective, the common user would think otherwise. While training is given on how to use the system, the training would normally be brief sessions that inform users about various features of the product and how they need to use the application to complete their tasks.
TAM is used to determine the linking between external variables and the acceptance of users who would be using the application in the workplace. The external variables would create an external stimulus that would create cognitive responses and influence the perceived ease of use and the perceived usefulness. These influences would in turn frame the intention that would form the behavioral intention and lead to the behavior. The behavior would in turn lead to the actual usage. If any of the causal links were to be disrupted or broken, the actual usage would ultimately suffer and the net result would be that the user would not be ready to accept the product as it would not be useful.
Davis (1995) has pointed out that that the scales used to measure TAM are regarded as valid and reliable and the results replicate for varied technologies and applications They function better since physical groups are formed during the constructs and this allows for better explanation of acceptance of users. The author suggests that external influences include system design, training users to understand the software, self efficacy in using IT systems, involvement of users in design of the system and how ICT is introduced plays an important role in increasing user acceptance. The model would assume that users are literate or have some knowledge of computers and are aware of basic functionalities in IT systems.
As reported by the author during the research, the intention to use is the crucial factor that would lead to use of the system. As per TAR, there is a basic fear of new technologies and in such cases; the user would have misgivings and fear about the system. When computers first made inroads into the public domain, an overwhelming number of people had misgivings and feelings that ‘I would be blamed if something happens and this factor acts as a barrier to the intention to use and the actual behavior.
However, this is a psychological case and it would be wrong to apply TAM to such events. Davies (1989) points out that in work organizations, people would use the application even if they did not find it particularly useful. But the intention to use is very important and this is formed by the attitude that the user has towards the system. The attitude is formed by the perceived usefulness and the extent to which the user feels that the system would reduce his efforts in completing the tasks. Keeping this in mind, Davies framed another model for TAM and this is illustrated in the following figure.
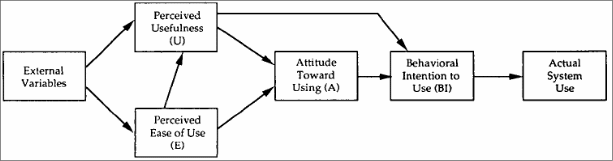
As seen in the above figure, there is a new construct called Attitude towards Using ‘A’ and these are framed by the two factors of perceived usefulness and perceived ease of use. The factor of Attitude towards using would in turn lead to the behavioral intention to use BI. It may very well happen that users may directly move from U to BI and then lead to the actual system use. The above model received a fair share of support and criticisms as there were doubts raised about the heuristic correctness of the TAM model. Keeping the review comments in view, Venkatesh (2000) proposed the TAM 2 model and this is illustrated in the following figure.
TAM 2 adds certain social influences to the perceived usefulness of the TAM model to increase the predictability of the model. Influences that are added include the experience, voluntariness, subjective norm, image, job relevance, output quality and the result demonstrability. These social forces help to act on users who would be using the system and give the choice of rejecting or adopting the system. As suggested by Fishbein (1975), subjective norm is the users perception of important people who would influence his decision on using the system.
Users may decide to carry out behavior even though they may not like the behavior or like the consequences but they do it if people who are important to them motivate their actions. This is often called peer pressure. The author hypnotized that only when it is mandatory would the subjective norm have a positive influence on the intent to use else it would not have any significant use. The hypothesis is relevant in work organizations were people have to use a system, whether they like it or not.
Voluntariness is the amount to which potential technology users and adopters view the decision of adoption as non-mandatory. This factor would come into force when users feel that the socially influencing person can give rewards in case of compliance or punishment in case of non-compliance. The author suggests “voluntariness will moderate the effect of subjective norm on intention to use”. Venkatesh (2000) argues that users are susceptible to normative social influences and attempt to maintain a favorable image in their social group. Image could be depicted as the extent to which a persons status in a social circle is enhanced by using a particular technology. If others in a social group regard a technology with esteem then the user would feel that by using and adopting the technology, his standing would rise.
The author has hypotheses that subjective norm would have a positive effect on the image and in turn, the image of factor would have a positive effect on the perceived usefulness. Thus, one would assume that high technology products would have a positive image associated with them since people have a high regard for them.
Unified Theory of Acceptance and Use of Technology (UTAUT)
Venkatesh (2003) speaks of the Unified Theory of Acceptance and Use of Technology model – UTAUT and this is a representation of the eight models of technology adoption. The model is used to explain intentions of the user for using an ICT system and the usage behaviour that would result. The model is based on four constructs and they are effort expectancy, performance expectancy, facilitating conditions and the social influence that a user is subjected to. Building upon TAM and other seven model, UTAUT adds factors such as age and gender of the user along with voluntariness and experience. Field research suggests that the model can account for about 70 percent of the usage variance intention.
As suggested by Venkatesh (2003), seven of the constructs have a major impact and can be regarded as direct determinants of usage or intention in the models. Form these; the author selected four as very important as direct determinant and they are effort expectancy, facilitating conditions, social influence and performance expectancy. The author regarded constructs such as self-efficacy, aptitude for using technology and anxiety as not direct determinants of the usage or intention. There are in addition some important moderators such as age, gender, experience and voluntariness and these would be acting on the core constructs. Based on these inputs, an illustration of the UTAUT model is given in the following figure.
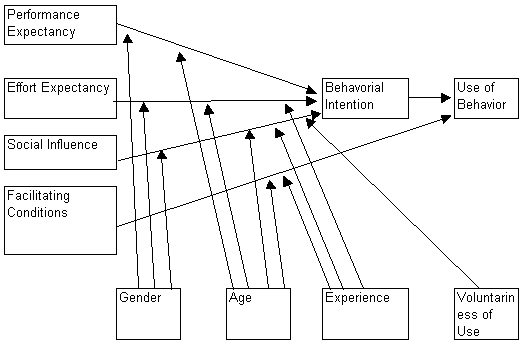
As can be seen in the above figure, there are four core constructs and they are performance expectancy, effort expectancy, social influence and facilitating conditions. These are the determinants for the behavioural intention, which in turn brings out the use of behaviour. Now a moderator that would either enhance or inhibit the construct would act each of the core constructs on. Performance expectancy would be acted on by the gender and age moderators while effort expectancy would be acted on by gender and age. Social influence would be acted on by the gender, age, experience and the voluntariness of use while facilitating conditions would be acted on by age and experience.
Among the core constructs, performance expectancy is the strongest predictor for each model. It is the degree to which a user would believe that by using the system, certain job related tasks and jobs would be completed. Effort expectancy is the amount of ease that would be linked to using the system and this construct is moderated by gender, age and experience. So the implication is that people of certain gender and age who have a certain level of experience would either have a high or low value for the effort expectancy.
The next core construct is the social influence and it is the amount by which a user would feel that people who are important to him would require him to use the system. This is in turn moderated by gender, age, experience and the voluntariness of use. The last construct is the facilitating conditions and it is the amount by which a user would believe that there is support from the organization that would help him to use the system.
Methodology
The term Methodology refers to the approach taken for the research process, from the theoretical framework, hypothesis to gathering and analyzing of data. The term method refers to the various means by which data can be collected and analyzed. The methodological assumption is concerned with the process of the research, from the theoretical underpinning to the collection and analysis of the data (Silverman, 2001).
Qualitative and Quantitative Research
Studies that use data cover areas of economic study, unemployment, health of the economy, scientific study, patterns of demography and others. Different type of data is collected using methods such as databases, reliable government studies, secondary research published in peer reviewed journals, experiments, observations, interviews and others. Data that is collected can be designated into two basic categories, quantitative and qualitative. This also formulates what type of research a study will be conducting: quantitative or qualitative.
Denzin (2000) described quantitative research as “the research which gathers data that is measurable in some way and which is usually analyzed statistically”. This type of data is mainly concerned with how much there is of something, how fast things are done, and so on. The data collected in this instance is always in the form of numbers. To obtain quantitative data, one should have a specific framework about what has to be researched, what should be known, types of inputs that are admissible and so on. Such an approach can help in designing the questionnaire, making observations and so on. Denzin also defined qualitative research as “the research that gathers data that provides a detailed description of whatever is being researched”. Both types of research have their supporters and detractors and while some claim that quantitative research is much more scientific, others argue that qualitative research is required to examine a specific issue in depth.
Researchers who support that quantitative research argue that numerical data can be statistically analyzed and in this way, it can be established whether it is valid, reliable and whether it can be generalized. By using numerical data, these numbers can be used to compare between other studies, which also use the same numbers, the same scales, etc. With qualitative research, it is not so easily possible to achieve this result, as no specific method or scale of measurement is kept. This is the main disadvantage of qualitative research, as findings cannot be generalized to larger populations with a large degree of certainty and validity. The reason that this happens is because their findings are not tested and evaluated statistically to establish whether they are due to chance or whether they are statistically significant and to what extent.
Another advantage of quantitative to qualitative research is that qualitative research is descriptive and many times subjective too, as it depends on the researcher’s perspective or how the research registers certain behaviors. Another researcher conducting the same study may observe the qualitative data, which is given in a completely different way. Quantitative research does not show this disadvantage as all the data is in the form of numbers and, therefore, it may be translated in only one possible way, that which is given from the objective value of each specific number. However, qualitative research has many advantages to offer too, which are not offered through quantitative research. It is usually through such type of research that a rich, in-depth insight can be given into an individual or a group, by being far more detailed and by recognizing the uniqueness of each individual. This type of research realizes the importance of the subjective feelings of those who are studied.
Qualitative research analysis does not have to fall into the pitfall of being ‘forced’ to have all its values into certain numerical categories. Not all phenomena can always be adequately assigned a numerical value, and when this does happen, they lose much of their naturalistic reality. Qualitative research can simply describe a data for what it is without having to assign it to a number. Qualitative research can give attention to occurrences, which are not so common. For example, it is very difficult to find enough participants to conduct statistical correlations between nations on women being more accident prone and indulging in rash driving because women will not be willing to be used for such studies. In such cases, quantitative research is impossible and it is only through qualitative research that such cases can be examined in depth and conclude to specific findings and results (Byrne, 2002).
Data Gathering
Gathering data is a very important phase and due consideration must be given for the time frame of the research.
Single and Multiple Methods
It is not possible to recommend a single data collection method for each project since each project would have different requirements. In such cases, the use of multiple methods is essential. Multiple methods by using survey instruments, review of documents to understand the project is recommended as it gives a better overview of the data. Such methods also highlight the errors between different methods and the occurrence of bias by a specific method is reduced. In some cases, the use of multiple methods is possible when the project requires large analysis spread across multiple sites. Also, multiple resources require more manpower and resources and these are usually available for larger projects (Denzin, 2000).
Sample Selection
The sample to be researched largely determines the data collection method that is used. Surveys are better suited when used to obtain information from participants, while focus groups would require a different method since the groups are diverse. The sample size would also depend on the project requirements and the group that has to be studied. While considering large number of subjects is best since the results are more reliable, the costs of studying such large samples increase. If the project has sufficient budget allocations, then it is possible to include larger samples and members in the study (Byrne, 2002).
Cost Considerations
Cost is an important aspect for research projects and choosing the method for data collection depends on the budget. For tasks such as running observations, program and project document review can be achieved with lesser costs, but tasks such as the design of the survey instruments, administering the instrument to subjects and analyzing the results would need the help of an external evaluator. In some cases, staff would have to be sent for training. When standard tests and analysis are to be used, some external staff and experts may have to be involved. For storing and archival of data, software would have to be used so that the data can be analyzed as required. Since project budgets tend to be smaller in the initial stages, effort should be spent in creating some data collection instruments and tools to fulfill future requirements as the program evolves and moves across different phases (Byrne, 2002).
Sample Size
The sample size used in research has always created disagreements and controversies. Various issues such as ethical issues and statistical problems arise and these need to be addressed properly. When very large sample data sizes are used, the ethical issue of wasting resources will arise, while selecting a smaller size will create another ethical issue. When the research objective is large, then a statistically significant difference may be observed even with a smaller sample.
However, the statistically significant difference may happen when a smaller sample size has been used and such differences do emerge and also when there is no difference. Freiman (1970) reported that a study on clinical trials that showed negative results for certain parameters for the effectiveness of a treatment; but after the results were further examined it was found that because of the small sample size, 50% of the results and method used were not adequate to cover 70% of the improvements. Many researchers when faced with shortage of resources or when they find that bigger sample size is not available or would take too much time tend to use smaller samples in the hope that the size is representative of a wider section of the data. However, in many cases, this is misleading and researchers would be held responsible of major errors that were caused due to ignorance rather than due to misconduct. In research, ignorance does not lead to a researcher being free of misrepresentation charges and such practices cannot be excused (Freiman, 1970).
Describing Data
While gathering data is one part of the research, interpreting data is very important. Different classifications are used to identify data. Variable: A variable is an item of data and some examples include quantities such as gender, test scores, and weight. The values of these quantities vary from one observation to another. Types and classifications are: Qualitative-Non-Numerical quality; Quantitative-Numerical; Discrete-counts and Continuous measures (Silverman, 2001).
Qualitative Data: This data describes the quality of something in a non-numerical format. Counts can be applied to qualitative data, but one cannot order or measure this type of variable. Examples are gender, marital status, geographical region of an organization, job title, etc. (Silverman, 2001).
Qualitative data is usually treated as Categorical Data. With categorical data, the observations can be sorted according into non-overlapping categories or by characteristics. As an example, apparel can be categorized as per their color. The parameter of ‘colour’ would have certain non-overlapping properties such as red, green, orange, etc. People can be categorized as per their gender with features such as male and female. While selecting categories, care should be taken to frame them properly and a value from one set of data should belong to only one type of category and not be able to get into multiple categories. Analysis of qualitative data is done by using: Frequency tables, Modes – most frequently occurring and Graphs- Bar Charts and Pie Charts (Silverman, 2001).
Quantitative Data: Quantitative or numerical data arise when the observations are frequencies or measurements. The data are said to be discrete if the measurements are integers, e.g. number of employees of a company, number of incorrect answers on a test, number of participants in a program. The data are said to be continuous if the measurements can take on any value, usually within some range (e.g. weight). Age and income are continuous quantitative variables. For continuous variables, arithmetic operations such as differences and averages make sense. Analysis can take almost any form such as creating groups or categories and generating frequency tables and all descriptive statistics can be applied. Effective graphs include Histograms, stem-and-Leaf plots, Dot Plots, Box plots, and XY Scatter Plots with 2 or more variables.
Some quantitative variables can be treated only as ranks; they have a natural order, but these values are not strictly measured. Examples are: age group (taking the values child, teen, adult, senior), and Likert Scale data (responses such as strongly agree, agree, neutral, disagree, strongly disagree). For these variables, the differences between contiguous points on the scale need not be the same, and the ratio of values is not meaningful. Analyses using: Frequency tables, Mode, Median, Quartiles and Graphs Bar Charts, Dot Plots, Pie Charts, and Line Charts with 2 or more variables (Silverman, 2001).
Research Paradigm and Method
Typically, the research design, methodology and approach are driven by the research question being scrutinized. Galliers (1991) infers that depending on the field of research that there may be several research approaches and methods that are considered appropriate; this is a view which is also shared by Vitalari (1985). The research paradigm will influence the selection of an appropriate research method and approach by the researcher of which they could choose either qualitative or quantitative research, in some cases, as stated by Creswell, (2003) mixed method procedures which incorporate both elements of qualitative and quantitative research are obtaining a level of validity within academia where it has aspired to a level of legitimacy within the social and human sciences.
Research Paradigm
The paradigm adopted in any research has important implications for methodology decisions. Orlikowski (1991) identify that there are three paradigms evident in Information Systems research which are the: Positivist paradigm; Interpretivist paradigm and Critical theory paradigm.
The Positivist Paradigm
The ‘Positivist Paradigm Positivism’, as stated in Neumann (1994), sees social sciences as an: “Organized method for combining deductive logic with precise empirical observations of individual behavior to discover and confirm a set of probabilistic causal laws that can be used to predict general patterns of human activity”. The above objective can be achieved by searching for regularities and causal relationships between fundamental elements. There are two major approaches in research, these being scientific and Interpretivist. The scientific approach is based on empirical study, which corresponds with the intransigent nature of positivism. Positivism has been the dominant paradigm of Information Systems research. Orlikowski (1991) stated that 97 percent of the academic research which was conducted within USA corresponded to the positivism paradigm. More recently, Interpretivism has gained wider acceptance and critical theory has been discussed and used. While paradigms have imprecise boundaries and include numerous variations, common themes for each paradigm can be identified.
Firstly, positivist research is based mainly on deductive style of reasoning, as used in natural science. In other words, it is based on the belief that the description of the world’s phenomena is reducible to observable facts and mathematical relationships. The positivist paradigm focuses on numerically measurable events and scientific study. Such research is often concerned with hypothesis testing and is used to discover natural laws so that people can predict and control events. Fact and evidence are two words primarily associated with the positivist paradigm. The positivist paradigm utilizes quantitative data, often using large samples where data is collected through experiments, questionnaires, content analysis and existing statistics. While the accuracy and high reliability of a positivist approach are clear, criticism concerning the depth of understanding gained.
Arguments against positivism and in support of the Interpretivist paradigm are based on quantitative methods producing artificial and sterile results. These results are argued to be incapable of representing the complexity of social realities. People are reduced to numbers and abstract laws and formulas are arguably not relevant to the actual lives of real people and have low validity (Neumann, 1994).
The Interpretivist Paradigm
Interpretivism, as defined by Neumann (1994) is the “systematic analysis-of socially meaningful action through the direct detailed observation of people in natural settings to arrive at understandings and interpretations of how people create and maintain their social worlds.” Interpretivism is related with the theory of hermeneutics, which emphasizes detailed examination and assessment of text, which could refer to written words. This paradigm is more established in Information Systems research in Europe compared to the United States of America. In contrast to positivism, the Interpretivist paradigm is particularly concerned with qualitative data. This data is rich and can be examined for social meaning. The qualitative approaches take the stance that information about the world’s phenomena when reduced to numerical form, loses most of the important information and meaning. In other words, Interpretivism does not try to generalize from a carefully selected sample to a specified population but rather to develop deep understanding which may then inform understanding in other contexts.
Methodologically, research within the Interpretivist paradigm uses small samples, open ended questions, unstructured interviews, individual case studies, diary methods, participant observation and the like. Research using these techniques has high construct validity and realism, however is more suited to theory generation. As with the positivist paradigm, the Interpretivist approach, however, possesses weaknesses. It is difficult to replicate interpretivistic work because the data and findings are socially constructed between the respondents and researcher/s. Positivist criteria of validity and reliability cannot be easily applied. Rather truth and trustworthiness are used as criteria and are observed through different means.
The Critical Theory Paradigm
Critical theory is derived from the works of Marx, Freud, Marcuse and Habermas (Neumann, 1994). Critical theorists disagree with what is viewed as the anti-humanist and conservative values of positivism and the passive subjectivism of Interpretivism. Critical theorists go beyond seeking understanding of an existing reality and critically evaluate the social reality being studied to implement improvements to it. Research may result in strategies to reveal contradictions, empower subjects and initiate action. Critical theory is receiving increased attention from Information Systems researchers.
This study is based in the positivist paradigm. The research asks target respondents questions in a written questionnaire to collect objective statistical data. In terms of data collection, there is no manipulation of the situation, with respondents answering numerous questions in a short period (Neumann, 1994). The data when obtained is expected to be precise with high reliability, so that when measures are repeated, the findings have comparable results. Despite its shortcomings, the positivist approach is well matched to the objectives of this study.
Firstly, the study is based on hypothesis testing rather than theory development. Secondly, testing diffusion and adoption theories mean that data collection encompasses a broad demographical scope, which again supports the need for structured questionnaires to collect precise data. Techniques which will be used to collect evidence and influence how the evidence will be analyzed. Some of the following approaches are predominantly positivist while some may be used with either phenomenological approach.
Research Methods of the Positivist Paradigm
Galliers (1992) provides a list of methods or tactics suitable for all types of business and management researchers. It is important for the researcher to be familiar with the characteristics of these approaches, as they will determine the Forecasting Research techniques which will be used to collect evidence and influence how the evidence will be analysed. Some of the following approaches are predominantly positivist while some may be used with either phenomenological approach.
Forecasting Research
Forecasting research tends to be associated with mathematical and statistical techniques of regression and time series analysis (Collopy and Armstrong, 1992). This type of research may also be regarded as falling under the heading of mathematical simulation. These techniques allow projections to be made based on past or historic evidence. This is usually a highly quantitative approach in which mathematical models are fitted to empirical data or evidence points. This research method was not chosen as it attempts to establish relationships between different sets of historical evidence and to understand why these relationships exist.
Futures Research
Futures research provides a way of considering and developing predictions although not as mathematical or technical as, but at the same time similar in intent to, forecasting research (Remenyi, 1998). Unlike forecasting, futures research has a forward orientation and thus looks ahead, rather than backwards, using techniques such as scenario projections and Delphi studies. Futures research is not extensively used, except perhaps in some specialized areas such as technology forecasting and business trend analysis. Similar to forecasting research, this method is not suitable for this study.
Simulation and Stochastic Modeling
Simulation and stochastic modeling may be defined as a domain of study in which the input variables and how they interact is generally known to an uncertain level of accuracy (Remenyi, 1998). In other words, stochastic modeling is used to investigate situations that do not readily lend themselves to a strictly deterministic or analytical treatment. Simulation is particularly relevant where there is a requirement for the evaluation of formal mathematical relationships under a large variety of assumptions. There is not a high degree of utilization of this research paradigm in business or management research, such as this study, except where mathematical modeling is a key part of the study.
Case Study
Yin (1989) regards a case study in much the same way that the natural scientist regards a laboratory experiment. The case study approach is an umbrella term for a family of research methods having in common the decision to focus on an enquiry around a specific instance or event. More formally, a case study may be defined as an empirical enquiry that “investigates a contemporary phenomenon within its real life context, when the boundaries between phenomenon and context are not evident, and in which multiple sources of evidences are used”. In a case study, the researcher examines features on many people or units, at one time or across periods. It uses analytical logic instead of numerical statistical testing. The researcher will select one or a few key cases to illustrate an issue and study them in detail.
The case study aims to provide a multi-dimensional picture of the situation and it can illustrate the relationships, corporate political issues and patterns of influence in particular contexts. The researcher can do so by using combined sources of data collection such as archives, interviews, questionnaires and observations. However, based on this research strategy a researcher is an observer and a large number of variables are involved with little or no control. Outcomes deriving from a case study can be either qualitative, quantitative or both. Given the time and resources available, a longitudinal study is not feasible. Therefore, the case study method was not chosen for this study.
Survey
Questionnaires produce quantitative information about the social world and describe features of people or the social world (Neumann, 1997). They are also used to explain or explore about people’s beliefs, opinions, characteristics, and past or present behavior. The survey is the most widely used data gathering technique in sociology, and it’s used in many other fields as well such as communication, education, economics, political science, and social psychology. The survey approach is often called correlation. Survey researchers sample many respondents who answer the same questions. They measure many variables, test multiple hypotheses, and infer temporal order from questions about past behavior, experiences, or characteristics. The association among variables is then measured with statistical techniques. Survey techniques are often used in descriptive or explanatory research.
The advantages of survey methods, such as the economy of the design, the rapid turnaround in data collection, and the ability to identify attributes of a population from a small group of individuals are presented. The survey design provides a quantitative or numeric description of some fraction of the population – the sample – through the data collection process of asking questions of people. This data collection, in turn, enables the researcher to generalize the findings from a sample of responses to a population. In addition, inferences can be made about some characteristics, attitude, or behavior of this population.
Survey research can be complex and expensive and it can involve coordinating a considerable amount of people and copious steps. One of the issues involved with questionnaires is non-cooperation. Due to an increasing number of academic courses requiring students to conduct formal research, many individuals and organizations are tiring of being continually surveyed. This leads to low response rates, or worse still inappropriately answered questionnaires that eventually impact negatively on the generalisability of the results. The generalisability or the external validity of questionnaires may also be affected by the sampling technique employed. As proposed by Williamson (2000), the more focused the target group, the higher the response rates; and conversely, the more generalized the target group, the lower the response rate.
For this paper, Survey method has been used to conduct the primary research.
Survey Method
Survey data can be collected in a variety of ways, in different settings, and from different sources. Interviewing, administering questionnaires, and observing people and phenomena are the three main data collection methods in survey research. The choice of data collection methods depends on the facilities available from the organization, the extent of accuracy required, the expertise of the researcher, the time span of the study, and other costs and resources associated with and available for data gathering (Sekaran, 1992).
Questionnaires can be conducted by a variety of electronic means such as e-mail, the Web and electronic newsgroups. The data transmitted in electronic form are much more flexible and greatly facilitate the process of data collection, data capturing and data analysis, compared with print-based form (Williamson, 2000). It allows researchers to collect questionnaires from a larger and more geographically diverse population. Electronic survey responses can be collected more quickly, with lower copying and postage costs, and lower amount of time is spent in data entry.
In a study that compared the cost of web based survey method to other survey method confirmed other researchers’ findings that the costs of e-mail and web-based questionnaires dramatically decrease as the sample size increase. The process of developing web based survey usually involves developing the questionnaire, designing an online survey form, creating a database for the electronic capturing of data, and informing the population of interest of the existence of the survey.
e-Mail Survey
Little academic research has been conducted on web based questionnaires. However, it has been argued that many respondents feel they can be much more candid on eMail (Zikmund, 1997). Researchers at Socratic Technologies and American Research claim that when people are contacted to take part in electronic research, they are more likely to participate than in identical investigations using written materials. Apart from being cheaper than other modes of survey distribution, faster transmission, and quicker data gathering, it has also been suggested that eMail questionnaires arouse curiosity because they are novel and they reach respondents who are more likely to answer because people opening their eMail are prepared to interact.
Many of these interactive questionnaires can utilize color sound and animation, which help to increase participant’s cooperation and willingness to spend more time answering the questionnaires. Despite its advantages, the overall response rates for eMail questionnaires are known to be somewhat lower than paper and pencil questionnaire suggests several possible reasons for low eMail response rates. First, asynchronous email is on the “waiting phase” and individuals can discard these messages very easily. Further, eMail questionnaires do not physically show up on recipient’s desks and thus are less likely to get the receiver’s attention. And perhaps, most importantly, eMail is not anonymous.
Web-based survey
Before the introduction of the World Wide Web (WWW), web based questionnaires were collected mainly through eMail. However, as WWW access has become a standard part of network connectivity, web-based questionnaires are becoming increasingly common. web-based questionnaires offer a level of flexibility that eMail questionnaires do not. Features such as adding images, having help options, and enforcing data validation rules on responses by requiring certain types of answers, such as a numerical response, a response under 30 characters, etc.
Respondents can also benefit from the automatic question filtering function. In addition to making the survey experience smoother for the respondent, there are less missing data when the survey is configured to be sent to a database or spreadsheet, and no data entry is needed. Regardless of the advantages, the cost of the web-based survey method can be more expensive than the cost of the mail version of the survey if population size is held constant. This is due to the substantial amount of time spent by programmers and Web designers making a seamless web-based survey site. In addition, there is difficulty in calculating labor cost for maintaining computer networks such as administration and hardware maintenance.
Although eMail and web-based questionnaires are relatively easy to design, incur low cost and achieve faster response time than traditional paper survey, it can be very difficult to procure eMail list of a particular population, other than one’s company records. In addition, considerable effort needs to be devoted to promoting and establishing links containing invitations to visit the survey website. In summary, a review of various types of survey method has been presented in this section. Certainly, telephone interviews are the fastest way to obtain data.
However, due to the aforementioned cultural differences telephone or personal interviews were not considered feasible for this study. The only viable option was to instigate an anonymous data collection methodology by using a web-based survey.
Design of Survey Instrument
A structured instrument with multiple questions has been designed for the survey. The purpose of majority sections of the survey was to assess the perceptions of the responding individual in regards to adoption of ERP/ SOA and what factors they use to determine their adoption. The types of question used were: Multiple choice – single answer; Multiple choice – multiple answers; Matrix of choice – single answer; Matrix of choice – multiple answers; Matrix of drop down screens; Likert scales and free text boxes. When using the Likert scale the respondents were required to indicate their agreement or disagreement on a seven-point scale. This scale was chosen because of its adaptability to the type of perceptual questions being used in the survey (Sekaran, 1992)
SOA: Introduction
This chapter would discuss at length various aspects related to SOA and create a thorough understanding of how SOA is designed to operate, what it can do and how it would help the future of computing. Portier (2007) suggests that SOA provides a framework and system development method for integration of applications. The systems group functionality is organized around the business process and these are bundled as interoperable services. When the applications are structured around the SOA, they can communicate with each other and exchange data when they carry out various business processes. All the services are held together loosely with their operating systems and the programming languages. SOA helps to segregate the functions into discrete services and programmers can make these services accessible on a network. Users can reuse the services, combine them into other separate units to create business applications. These services interact with each other and exchange data by coordinating the tasks between themselves.
SOA has been built on concepts of modular programming and distributed computing. Large organizations had in the past taken up software application implementation on a piece meal basis from different vendors and over a period. So while the accounts department has one system, the marketing would have another and so would the purchase, manufacturing, logistics and other departments. The problem with this diversity was that centralized information repository and reporting system was unfortunately not possible. Managers had to go to one department and get reports and then attempt to reconcile various reports into the format they wanted. Organizations have been attempting since a long time to integrate these disparate and diverse systems so that the systems can be used to support organization wide business processes. Initially, systems such as EDI that were web enabled were used to allow provide some amount of integration but EDI is rigid and has its formats and systems (Portier, 2007).
What was needed was a standard architecture that could be used in different cases, was flexible and able to support connectivity requirements to various applications and allow them to share data. SOA provides the answers to some of the recurrent problems and helps to bring together and unify different business process. Please refer to the following figure that gives the SOA foundation reference model.
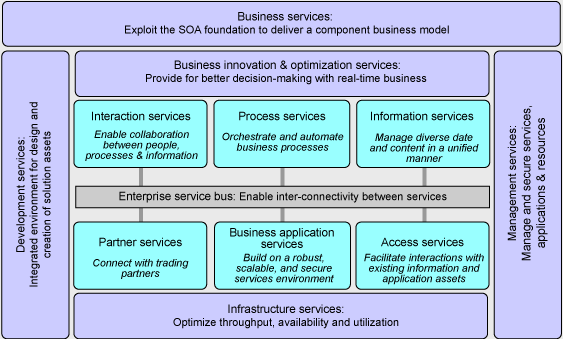
Large applications are regarded as a collection of smaller services or modules and allow users to make use of these applications. It also allows new applications to be created by mixing and integrating these services. Once information is stored in one of these services, and then there is no need to enter this information again and again. As an example, certain information is entered into the client profile when creating their account and information such as user name, contact details, various supporting proofs and others are entered. By using SOA, there is no need to enter this information again and again when opening a current account or a savings accounts or even a IRA account. The interfaces that the users interact with would have the same look and feel and have a similar type of data input validation. When all applications are built from the same pool, the services make this task easily achieved able and it is possible to deploy and access the solutions (Portier, 2007).
It would be easily possible as an example for a tourist operator to reserve a car on receiving instructions from an airline operator for a passenger, online. If SOA was not present, then someone from the tourist operator would have to receive the request from the airline operator and enter the details manually in their system and send the confirmation manually. With SOA, it is possible to send the request from the customer who would be using the Internet, route it through the airline operator’s system who would be running an Oracle system to the small tour operator system, who would be running a Windows based SMB application. SOA in effect provides the required framework for design with the intention to create a rapid and low cost system development that would help in improving the system quality. It would employ web services standards along with web technologies to create a standard method for the creation and deployment of enterprise applications. Following image shows a typical SOA interactions (Peng, 2008).
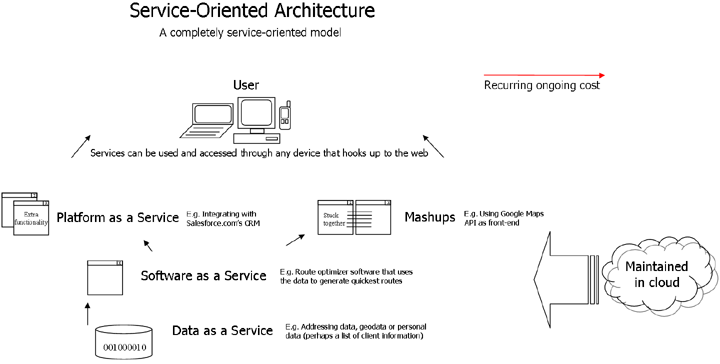
As seen in the above figure, the are different entities such as a users, SaaS, DaaS and PaaS and these refer to the services that the user would interact with. However, there are some challenges when using SOA for real time applications since there is the problem of handling the response time, asynchronous parallel applications, providing support for event driven routines, ensuring reliability and availability of the applications and so on (Peng, 2008).
SOA can be visualized as having some layers and stacks with some components. Following figure shows the functional layers in the SOA architecture.
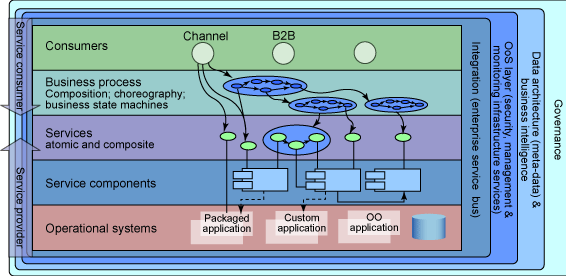
The generic SOA would have some functional layers that are illustrated in the above figure. The bottommost layer is the operational systems and it includes the IT components and assets that would be the focus for SOA. The whole architecture is designed to use the entities in this layer and it includes packaged applications, custom applications and the OO applications. Next layer is the service component layer and this layer connects to the applications in the below layer. Consumers would not be accessing the applications directly but only through the services components. These components can be reused where required in the SOA.
Next layer is the service atomic and composite and they represent the set of services that are available in the system environment. Business processes are the artifacts at the operational level and are used for implementation of the business processes that are orchestrated as services. The topmost layer is the consumer layers and the represent the individuals or channels that would be using the services, business process and applications. There are also some non-functional layers shown on the sides. Integration layer gives the capacity to route, mediate and provide transport service requests raised by the consumer to the specific provider. QoS sets the requirements for availability and reliability of service. The information architecture can support metadata, business intelligence and other data. Governance is used to give the capacity to extend support for aspects of lifecycle management of the SOA (Portier, 2007).
Global Strategic Advantage in Adopting SOA
Mulik (2008) points out that SOA is becoming more and more popular with IT professionals looking at it with great interest. Adopting SOA is different from deploying a software application, which can be a one-time activity. Rather, it’s a journey for an organization over a long period—an important detail for everyone involved to understand. SOA is an architectural pattern that says that computational units such as system modules should be loosely coupled through their service interfaces for delivering the desired functionality. This pattern can be applied to the architecture of a single system such as a quality management information or insurance claims management system or the overall architecture of all applications in an enterprise. The services don’t have to be Web services. They can also be Corba services or Jini services, though Web services currently represent the de facto technology for realizing SOA.
Certain SOA principles, such as loose coupling, ensure that systems can be highly maintainable and adaptable. Some challenges arise. One of them is that loosely coupled modules yield lower performance than tightly coupled modules. Another way to look at it is that loosely coupled modules would incur more hardware costs than with tightly coupled. The science of designing systems with SOA principles is also still evolving and so the service design remains largely an art. The benefits that SOA brings to the table can be quite appealing. In a world of increasing competition and constant transformation, SOA makes it easier to implement enterprise wide changes by exploiting the inherent flexibility it offers. That means easily modifiable information systems, which is a top priority for any CIO.
With this in mind, it’s not surprising to see SOA rising to the top of many CIOs’ agendas. This does not mean that organizations should immediately start re-architecting all of their information systems. Even before drawing plans for adopting SOA, it’s important to decide the actual destination one is aiming for. Simply turning applications into services one after another might bring the benefit of flexibility, but planning it with a predefined destination will bring the same benefit with less cost. Considering what SOA can do for an organization, one should choose from among four destinations for the SOA adoption journey: reusable business services; service-oriented integration; composite applications, and a foundation for business process management. The process can be multiphase. An organization can start seeking any of these outcomes and later decide to aim for another, more advanced goal. At another extreme, a few organizations might directly opt for building a foundation for their BPMs using SOA. Whatever direction one selects it is important to fully understand what each option entails.
Reusable Business Services
Organizations typically have some systems that supply core data—such as customer or product data—to the rest of the systems. Typically, development of any new system requires interaction with such systems. Given that such interaction tends to be tightly coupled, any change in core systems causes changes in many systems that the core system feeds. This change could ripple further if the systems became increasingly tightly coupled. In such cases, exposing services from systems that provide core data becomes a good solution. For example, an employee information service with operations such as getContactDetails, getPersonalDetails, or searchEmployeeByLastName can act as a single source for employee related data.
Designing the interface of such services isn’t an easy task because it needs to take into account what multiple users currently need for different tasks and what they might need for future integrations. Many organizations need to connect portions of their internal systems to their business partners across the Internet or proprietary networks. Rather than working out different mechanisms for connecting with each partner, the organizations can design generic service interfaces that follow industry standards such as the Accord system in insurance or Onix in the book-selling business. An example could be a catalog service that provides operations such as searchItem, lookupItem, and so on.
Again, in the absence of industry standards, designing a service interface like this is a difficult task—but it can save a lot of money in the long run and provide agility to organizations. Reusable business services are also useful when an organization has some of its application functionality developed using legacy technology. Rather than redeveloping such applications from scratch, we can wrap them as services for consumption by new-age technologies such as portals, smart clients, and mobile devices (Mulik, 2008).
Service-Oriented Integration
Integrating internal applications has historically been challenging for IT managers because of heterogeneous platforms among applications. For many organizations, FTP remains a dominant mechanism for integration. Since the advent of enterprise application integration tools in early 2000, however, companies have addressed this challenge extremely well. Vendors such as webMethods, Tibco, and SeeBeyond provide enterprise application integration (EAI) tools that can connect packaged applications and custom applications across the enterprise using either a single bus or a hub for all kinds of integration needs.
Perhaps, the only shortfall of this approach is that these EAI tools have been proprietary. Once you deploy a tool from one vendor, it’s difficult to switch to another. The answer to this shortfall came with the enterprise service bus. Simply put, an ESB is a software infrastructure tool that provides messaging, content-based routing, and XML-based data transformation for services to integrate. Consider it a lightweight EAI tool. Following figure shows a simplistic view of how the ESB can be used (Mulik, 2008).
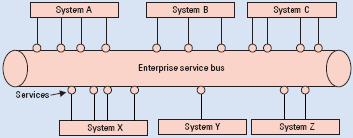
Many organizations have started using service-orchestration engines (SOEs) along with ESBs for integration. Such tools help to visualize business process execution as the orchestration of services. This helps in responding quickly to business changes quicker because any business change can be translated into a change in business processes. The Business Process Execution Language is the de facto standard language for this approach. BPEL is supported by almost all service-orchestration engines. This standard helps you switch one SOE with another, though with some effort. Many prefer an integration that combines ESB and BPEL engines, thereby using process based rather than service-oriented integration (Mulik, 2008).
Composite Applications
Duplicate application functionalities across many information systems are common. This occurs because application components are difficult to reuse if they’re not properly structured. If you take care to review existing systems and consider how they can be developed into reusable business services, however, you can avoid duplication, excess, and having to start from scratch. Rather than developing isolated business applications, it’s worth considering building new applications by reusing existing services and developing the rest of the functionality. We can classify composite applications as either static or dynamic. Static composite applications are built programmatically. That means programmers are required to write new code, which can connect to existing services.
On the other hand, dynamic composite applications can be built using BPEL engines, which provide a GUI for orchestrating services. A business analyst can also compose a new application by orchestrating existing services along with newly developed services. Such orchestration can be exposed as a service, thus making the service composition multilevel. Loose coupling is desirable for the user interface in such composite applications. That means that one could access a single composite application through multiple channels such as smart clients, portals, or mobile devices. This offers some much-needed flexibility in adapting to users’ ever-changing needs for accessing applications (Mulik, 2008).
Foundation for BPM
BPM involves modeling, monitoring, measuring, and optimizing business processes’ performance. Because most business processes are digitized, it’s now easy to enable BPM via software tools. Such tools have been available from vendors such as Savvion for a long time. However, because these tools tend to connect to existing applications in a proprietary manner, one might end up with a tight-coupling problem. To avoid this, it is recommended fully adopt SOA and then build the BPM infrastructure on top of it. This also eases the implementation of BPM tools, which can now leverage your service foundation. Currently, some of the available tools for BPM either bundle or offer easy integration with SOA tools, thus making it easier to combine BPM adoption with SOA. Following figure shows a comparison of all four options, taking into account factors such as the up-front investment required versus system flexibility (Mulik, 2008).
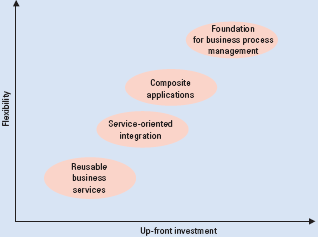
As seen in the above figure, the reusable business services approach provides the least flexibility among the four options, but it also requires the least up-front investment. It’s unlikely that an organization would stop at this destination, but by defining it as the first stop, one can show the business benefits of investing in and adopting SOA. On the other extreme, it’s unlikely that most organizations would define the foundation for BPM as a destination, largely because of the substantial up-front investment needed (Mulik, 2008).
About Software Architecture
In the earlier era of mainframes, complexity of the software was less and most of the instructions were hard coded. In those years, people who built the computers also wrote the code in languages such as Cobol, Fortran, Pascal and C. With the introduction of the graphical user interface and spread of computers, people other than the hardware engineer took up writing code and hence clarity in the manner that components interacted was required. Several new languages and operating systems such as Windows, made writing programs much easier.
Dijkstra (1968) first explained that how software is partitioned and structured is important. He introduced the idea of layered structures for operating systems. The potential benefit of such a structure was to ease development and maintenance and the author gave the groundwork for modern operating systems design. Parnas (1972) proposed several principles of software design that could be regarded as architecture and they became the building blocks for modern software engineering. Some of the concepts were: information hiding as the basis of decomposition for ease of maintenance and reuse; the separation of interface from component implementation; the uses relationship for controlling connectivity among components; the principles for error-detection and handling, identifying commonalities in “families of systems”; and the recognition that structure influences nonfunctional qualities of systems.
Perry (1992) introduced a model of software architecture that consisted of three components: elements included processing, data, and connecting elements; form defined the choice of architectural elements, their placement, and how they interact; and rationale defined the motivations for the choice of elements and form. Boehm (1996) added the notion of constraints to the vision of software design to represent the conditions under which systems would produce win–lose or lose–lose outcomes for some stakeholders. He provided an early introduction to various software architectural models and styles and how to use them together to facilitate software design.
Zachman (1987) moved away from the concept of single software applications and studied the large-scale information systems architecture that has collections of communicating software applications. He proposed the matrix framework to discuss the architecture in the context of information systems. The author suggested that a comprehensive information system required a set of architectural models that represent different stakeholders’ perspectives. The information system’s objective or scope represents a overall view of the system through user stories or use cases. The business model is the owner’s representation often generated through traditional process mapping. The information system model is the designer’s representation, which can take one of several architectural forms. The technology model is the builder’s representation of the system. The detailed representation is an out-of-context representation of the system and it means looking at the software system without regard for its business purpose. Please refer to the following figure that gives details of the models.
Understanding Elements of SOA
SOA can be regarded as a collection of services that would interact, exchange data and communicate among themselves. Communication and interaction would involve handling request for data transfer and ensuring the two, more services can work concurrently. Software applications are used to build the services and these services are made of independent functionality units that are designed to operate as standalone units and they may not have any call functions embedded that allow them to communicate with each other. Some examples of services include filling out online forms, booking reservations for tickets, placing orders for online shopping using credit cards and so on (Chou, 2008). An SOA system would have certain elements as illustrated in the following figure.

As seen in the above figure, the lowest layer is the business logic and data and these would interact during implementation. In addition there are the layers of the application front end, the service and service repository and the service. All these entities are enclosed by the SOA framework. These services would not have any code for calling other applications since hard coding calls would present a problem since a code snippet would have to be written for each instance and this is not feasible considering the millions of tasks and events that are available. Instead, defined and structured protocols are used that specify how these services can communicate with each other. The architecture would then use a business process to create the links for the services and the sequence in which the calls are done. This process is called as orchestration. The applications are regarded, as objects and the programmer would think of each SOA object by using the process of orchestration.
In Orchestration, blocks of software functionality or services as they are regarded are associated in a non hierarchical structure and not like the class structure. This association is done by using a software tool that would carry a listing of each service made available. The list would have the characters of the services and the method to record the protocols that would manage and allow the system to use the services during run time. Orchestration can be enabled by using metadata with optimum detailing to describe the services characteristics and the data that would be needed. Please refer to the following figure (Durvasula, 2006).
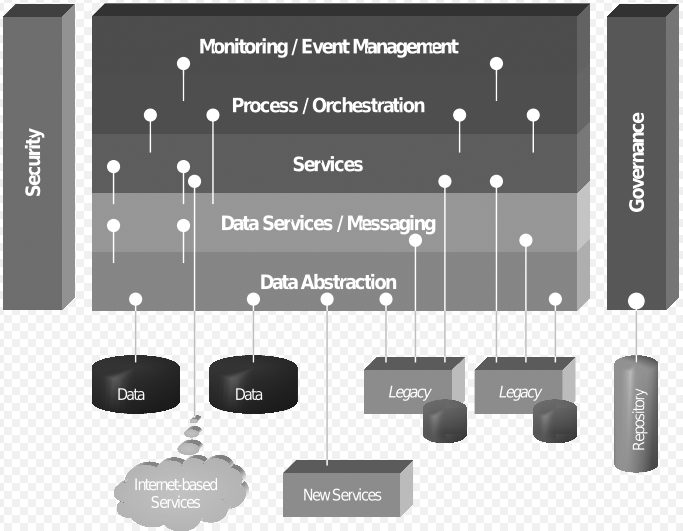
Extensible Markup Language – XML is used to s structure and organize the data and to wrap the data in tagged descriptive containers. SOA makes use of the services data and uses some metadata to meet the objectives. Some criteria that must be met and they are that the metadata should be arranged in a format recognized by systems. The systems would then dynamically configure the data to find out the services so that integrity and coherence is established. The metadata should also be presented in a format that programmers can manage and understand with little effort. It should be noted that with addition of interfaces, the processing is increased so performance becomes an issue (Hadded, 2005).
However, with reuse possible, after the initial development costs are covered, it is possible to develop further applications at lower marginal costs since the initial work is readily available and it is possible to produce a new application by using a single orchestration. Interactions between the software chunks should not be present in the initial stage and there should not be any interactions in the chunks themselves. Any interactions have to be specified by programmers who would use business requirements to make the changes. The services are designed a large functional units and not as classes to reduce the complexity when thousands of objects are involved. The services can be created using languages such as Java, C++, C and others. SOA allows loose coupling of the functions and creates executables that can be linked dynamically in the library. The services are designed to run using.NET or java to create safe wrappers so that memory allocation can be performed along with late binding. There is a move towards SaaS and it is expected that software vendors may provide SOA systems. This allows the costs to be spread over multiple customers, brings in standardization over different cases in industries.
Industries such as the travel and tourism industry have seen a rise in SOA applications and other sectors such as Finance, stocks and the money market have started using SOA. The concept of SOA would work when services would expose their functionality through interfaces and allow applications to understand and use the various functionalities. This fact brings in some doubt as to whether software vendors such as Oracle, SAP and Microsoft would be ready to reveal their code (Maurizio, 2008).
Service-Oriented Modeling Framework
Lu (2008) points out that SOA uses the Service-Oriented Modeling Framework – SOMF to solve issues of reuse and interoperability. SOMF helps to make the business rules simpler and allows developers to understand different environments by using modeling practices. In effect, SOMF helps to identify different disciples that make up SOA and helps developers to analyze and conceptual the service oriented assets to create the required architecture. SOMF is a map or a work structure that illustrates the main elements to identify the required tasks of the service development. The modeling system allows developers to create a proper project plan to discern different milestones of the service-oriented initiative. The initiative can be a small or large project. Please refer to the following figure that illustrates the SOMF layout.
As seen in the above figure, SOMF gives a modeling language or a notation for modeling that covers the main collaboration needs by aligning IT services and business processes. SOMF provides a life cycle methodology for service oriented development. Some modeling practices help to create a life cycle management model. There are entities such as the modeling discipline and the modeling artifacts and these make up the modeling environment. The environments provided are the conceptual environment, analysis environment and the logical environment. These are subsets of the abstraction practice and the realization practice. Modeling solutions include the solution service and the solution architecture. Some best practices have emerged and these include the business transparency, architecture best practices and trace ability, asset reuse and consolidation, virtuality, loose coupling, interoperability and the modularity and componentization (Ribeiro, 2008).
Understanding SOA Internals
SOA has some elements and these are illustrated in the following figure.
Important elements are explained as below.
Web Services
Lämmer (2008) posits that Web service refers to a software system that helps to support machine-to-machine communication over the Internet or the Intranet. It has been defined, as “A service is a discoverable resource that executes a repeatable task, and is described by an externalized service specification”. These are Web API that can be accessed through a network and run on another system that wants the services. Services are the applications that have to be run and these are run using web services. There are different concepts in understanding the meaning of services. Business alignment services are based on the business needs and not on the IT capabilities of an organization. Services for business alignment is given support by design and service analysis methods. Specifications services are used to describe the operations, interfaces, dynamic behavior, semantics, policies and the service quality. These are self-contained. Reusability services have reusability aspect and the granularity of service design services is used for support. Agreement services refer to any agreements or contracts that are formed between the service consumers and providers. The agreements formed may depend in the specifications of the services and not just on the aspects of implementation. Hosting and discoverability services have components such as registries, repositories and metadata and these are hosted by the service provider and discovered by the service consumer.
Aggregation refers to composite applications that are formed by loosely coupled services. Since the Internet is the primary method of connection and HTTP is the main protocol, the term web service has come into common use. Some web services suites used for creating web services are BEA AquaLogic, iWay Data Integration Solutions, iBOLT Integration Suite, Novell exteNd Composer, Actional, Sonic ESB, ReadiMinds WebServices Applications Suite, webMethods Product Suite. A good tool used for web services desktop integration is Ratchet-X. Tools used for web services development include Altova MissionKit for XML Developers, AttachmateWRQ Verastream, Redberri, soapui, FusionWare Integration Server, OrindaBuild and many more. Given the increased preference for web services and SOA, there is no end to the number of tools that are offered.
Erickson (2008) suggests that there are two basic types of web services – Big Web Services and REpresentational State Transfer Web services – RESTful. Big Web Services are created using XML and are based on SOAP – Simple Object Access Protocol. Web services at the client side code are defined by the web services description language – WSDL. RESTfull web services are based on HTTP protocols and do not use SOAP or XML. Web Services provide a set of tools that are used in implementing SOA, REST and RPC that are different architectures. SOA Web services are more common since they focus on loose coupling and not on rigid structures and this is the basis for SOA. Following figure illustrates the steps used in creating web services.
The steps used in providing and consuming services can be seen in the above figure. In step 1, the service provider describes the services that are offered by using WSDL and this description is entered in the services directory. The directory can be structured using different formats such as UDDI – Universal Description, Discovery, and Integration. In step 2, the service consumer would be sending queries to the directory to find the required service and how connection has to be established. In step 3, the WSDL code generated by the service provider is given to the service consumer and the code would tell the service provider about the request and response. In step 4, the WSDL is used by the service consumer and a request is sent to the service provider. In the last step 5, the service provider gives the information required by the service consumer.
Thus, a connection is established between the service provider and the service consumer. Since SOA is used, the directory can be kept in a central repository and can be accessed by any service consumer at any point of time and information flows directly established. If SOA was not available, then the service request would have to be made directly to the service provider and if there are millions of such requests, the system would get overloaded (Erickson, 2008).
WSDL
WSDL – Web Services Description Language is the defacto format employed to describe interfaces of the web service. It is used to describe the services that are offered and how binding of these services to the network address is carried out. The WSDL has three components: definitions, operations and service bindings. Following figure shows how these components are related.
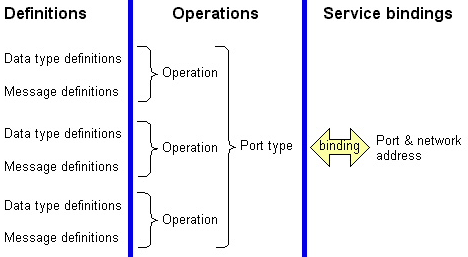
Definitions are specified by using XML and there are two types, message and data type definitions. Message definitions would be using the data type definitions. In an organization, there should be some commonality in the definitions formations and they can also be based on industry standards when definitions would be exchanged between different organizations. However, the definitions for each entity have to be unique. Operations are used for describing the actions that are requested by the messages in the web service. Types of the operations available are four. One-way message is when a message is sent and a reply is not needed. Request and response are when the sender wants a reply for the message he has sent. Solicit response is when the sender requests a response and notification is when multiple receiver are sent a message. The operations may be grouped into port types that are used for defining a set of operations for the web service support, Service bindings are used for connection of port types. Ports are specified by attaching a network address to a port. Some ports together form a service and these ports are bound by using SOAP. Other technologies that can be used into Corba, DCOM, Java Message Service,.NET, WebSphere MQ, etc. (Chen, 2008).
Application Servers and Databases
The application server is located in the middle tier of the architecture that is server centric. It is component based and creates middleware services that are utilized for state maintenance, persistence, data access and for security. There are different types of app servers, based on the language used and Java app server is built on the Java 2 Platform while a J2EE server would be using the multi-tier distributed model. The model used for the server has three tiers, client, EIS and the middle tiers. Client tier can include the browsers and applications while the EIS – enterprise information system would have the databases, files and applications. The middle tier has the J2EE platform and has the EJB and the web server. Please refer to the following figure (Enrique, 2008).
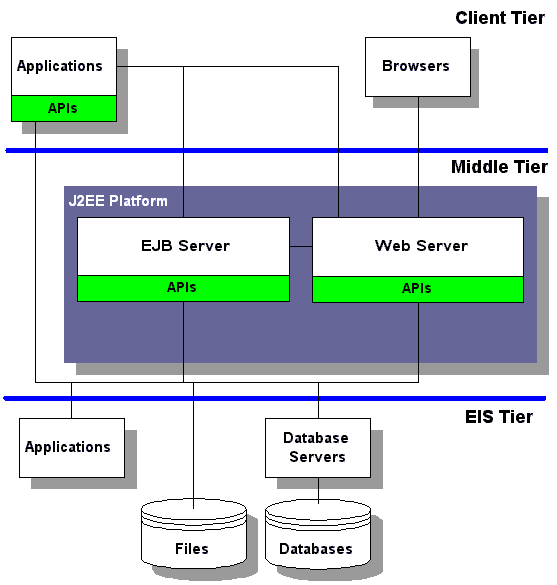
App servers have to be used when existing systems and databases have to be integrated and there is a need for website support. They are also used when systems such as e-Commerce, web integrated collaboration or component reuse have to be started. App servers help to formalize the answers for problems of integration (Enrique, 2008).
Middle Tier Database
Middle tier databases are used for storing of temporary data that has to be cached while transactions are routed in the system. Since they are used for temporary storage, advanced technologies and that reduce costs and improve performance can be used. Only data that is required for support of processing tasks in the middle tier is stored. This data is eventually archived in the ESI tier. While data may exist for some duration it will not be stored permanently like in the master database. Some types of databases that can be used include SQL 92 relational databases, SQL 1999 object relational database, OOD, XML databases and so on (Tang, 2008).
Firewalls
XML firewalls are required since they are used for protection of the internal systems. Standard firewall products examine packet level traffic and do not inspect the message contents. XML firewalls are used to inspect SOAP header, and the XML messages content. They allow authorized content to go through the firewall. Some commercial products used include Forum Sentry, SecureSpan, Reactivity XML Gateway and open source products such as Safelayer’s TrustedX WS technology (Yang, 2008).
Message Routers
Message routers, also called application brokers are used to direct information and data between responding and requesting source. They are also called as XML data routers and message brokers. The routers have a logic that allows them to understand which internal systems need what updates. The router is used for transformation of the data so that it matches the requirement of the receiving system. Shown below is an illustration of data transformation (Yang, 2008).
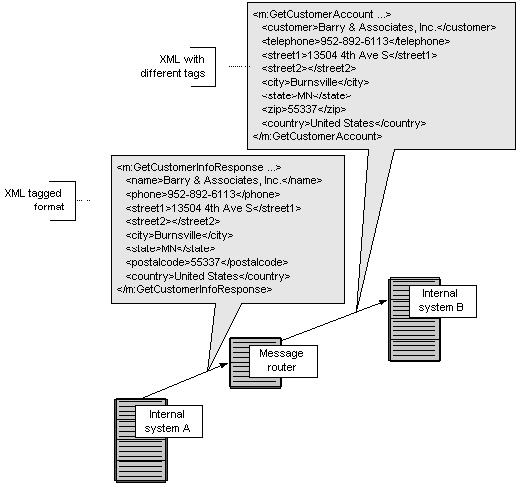
As seen in the above figure, A is the internal system that sends tagged XML message to B another internal system. However, system B handles variables differently and expects a different tag. So as identified in system A is transformed into the tag by the router before it forwards the data to system B. This type of variation should best be avoided by having a uniform XML vocabulary as per XML standards. However, the variation cannot be avoided due to differences in standards adopted by organizations. The router helps in transforming the tags so that messages are exchanged easily (Yang, 2008).
Web Service Adapters
Web service adapter help in connections of web service to legacy systems that were not programmed for web services. These form very important SOA architecture components. Some types of systems that are used into internally developed applications, external packaged systems, databases, Corba, DCOM and others. Following figure illustrates the process (Li, 2008).
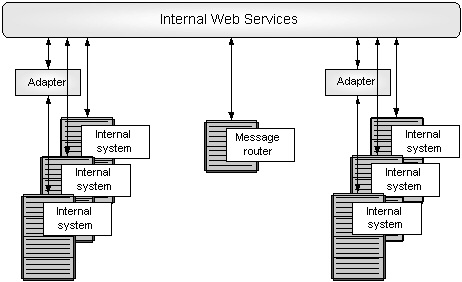
As seen in the above figure, out of the six internal systems, only two have adapters while the rest would not need them. A message router connects the left and right side. These adapters can be procured from third part vendors or they can be developed internally.
Orchestration
Orchestration refers to how complex computer systems and components such as services and middleware are arranged and managed and how they coordinate with each other. There are many commercial orchestration packages such as TIBCO BusinessWorks, Microsoft BizTalk Server, Oracle BPEL Process Manager, Apache Orchestration Director Engine, Intervoice Media Exchange, ActiveVOS, NetBeans Enterprise Pack that is a open source tool and many others. These are third party tools that are used in the SOA architecture framework. The process is required when creating SOA frameworks as it creates a layer for business solutions using some services. Information flows that occur from different systems are used and a control is created that allows a point of control for the various services. The orchestration engine helps to change the business functions and to redefine, reconfigure these functions as needed. Thus agility and flexibility can be obtained with orchestration. Following figure illustrates the arrangement (Fragidis, 2008).
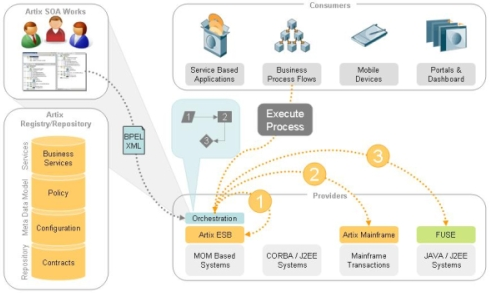
Orchestration has a mechanism that is flexible, dynamic and adaptable and this is done by separation of the back end service used and the processing logic. By using a loosely coupled mechanism, different service need not be running concurrently. If there is a change or upgrade in the services, then also there is no need to change the orchestration layer. Orchestration forms a binding over the top layer and encapsulates the points of integrations that a higher-level composite service layer is formed. Orchestration also helps developers to create simulations of process flows and test them before the flows are launched. This helps organizations to develop work and process flows quickly, identify bugs and increase the pace of deployment (Fragidis, 2008).
Case Study – Using SOA for an e-commerce Model
Fragidis (2008) posits that customers in the current market demand that vendor’s supply a complete product suite that meets their business needs and they are not interested in single products. As a result, customers try to combine stand-alone products from multiple suppliers and create valuable suite of products. As a result, there have come up some firms that help to integrate products and services that meet the customer needs and this value creation is enabled by SOA in eBusiness. SOA could be used to provide the technological basis needed by customers in the selection, composition and consumption of products and services in a proliferated electronic marketplace. However, the standard three-layered SOA model made up of the application layer, the service layer and the process layer does not fulfill the requirement of for interaction.
A new model can be considered where services form a layer between business processes and computing applications. This allows for the flexible combination of business tasks and computing applications. The major concern is the execution of business processes, resulting in the development of interoperability along the supply chain, the enhancement of the reusability of software resources and the achievement of organizational agility, defined in terms of flexible business transformation and costless development of new business processes. The customer is not considered in the SOA models that have been proposed. and the value for him in SOA applications derives as a by-product of the value created for the business organizations and example, interoperability increases the interaction between business partners, which is believed to have a positive impact on the customer. The development of customer centric e-business models requires an extension in the typical SOA model, so that the outputs of the business processes become visible to the end-customer, who will be able to select and combine business offerings to configure unique solutions that meet customer needs (Fragidis, 2008).
What is required is the merging of the capacity of SOA in the dynamic composition of software resources and business capabilities with the new customer-centric requirement to form the technological foundations required for the development of customer-centric models in e-commerce. A conceptual model is proposed for an extended SOA model that includes the concerns of the end customer in service compositions. The proposed framework inserts at the top of the typical SOA model two additional layers that introduce the customer logic. The underlying business logic of a SOA is integrated with the customer logic and the business processes, as reflected in service compositions, are associated with the products and services they produce. The framework provides the key concepts and the critical relationships between business outcomes, business processes and Web services, with the latter being the technological underlay for the enactment and use of business functionality (Erl, 2005). Please refer to the following figure.
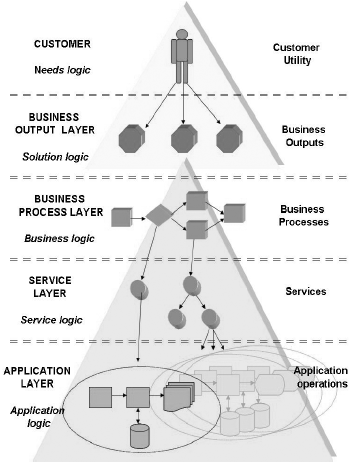
As seen in the above figure, the customer-centric SOA model is as an extension of the typical SOA model. It is based on the technological foundations of SOA and has two additional layers on top that connect business processes with their outcomes and the needs of the customer. There are two parts, Business oriented part and the customer oriented part. The business-oriented part refers to the typical SOA model and it becomes the technological underlay for the composition of products and services, through the orchestration, execution and management of Web services. The customer-oriented part is the proposed extension and forms the perspective of the end-customer in service compositions. It carries the customer logic made of the solution logic and the offering logic. The main function is to support customers to combine products and services. The extended SOA model is made up of five layers: application, service, business process, business output and the customer layer. The first 3 layers relate to the business-oriented part and the other 2 are the customer-oriented part of the architecture.
The Application Layer carries all the IT infrastructure and IT resources that would support business operations. Main component is the application logic for the automated or in general IT-supported execution of business processes.
The Service Layer has the Web services that integrate the business and application functionality and allow for the flexible combination of application operations for the development and execution of business processes. In the layer, the service logic is important as it is described by the service orientation principles for the invocation, design, composition, advertising and execution of services.
The Business Process Layer refers to the business processes that are performed for the production of products and services. This level is controlled by the business process logic for the analysis of processes into activities and tasks. In service-oriented environments, activities and tasks are mapped into services at the service layer, which calls and orchestrate the execution of application operations at the application layer.
The Business Output Layer refers to the business offerings, defined in terms of products and services produced by business suppliers through their business processes. The main component is the solution logic and it helps to meet customers needs and problems by the composition of complementary standalone products and services from one or different business suppliers.
The Customer Layer refers to the participation of the customer in value creation through the composition of solutions. This level is dominated by the need logic that extends beyond consumption and dictates the satisfaction of customer needs. The proposed framework would support the composition of products and services coming from different suppliers according to the customer’s preferences and needs. Such functionality is similar to the composition of services in SOA for the fulfillment of the business needs.
Hence, the general idea of the proposed framework derives from the example of SOA, accompanied by an anticipated market opportunity to develop customer-centric business models that keep an active role for customers in the creation of value. The practical use of the proposed framework requires that it is developed similarly to the SOA framework, with business offerings such as products and services being analogous to Web services (Erl, 2005). Please refer to the following table that gives the key concepts of the SOA model
As seen in the above figure, concept mapping notation is used and the concepts are indicated as ovals while relationships are shown as arrowed lines pointing at the concept that has some kind of conceptual dependency. Business offers related to the products and services that are offered by business suppliers. Business offerings are similar to services in SOA and they have two characters. They are the outcomes of a business process and the methods used to meet customer’s needs. They form the links connecting customers and suppliers and facilitate a dialogue for the development of solutions for the customers. The value of business offerings is related to the outcomes they produce when consumed. Single products and services have usually limited utility for the customer and fail to fulfill the needs. Services are the composition of business offerings into solutions that produce added value for the customer; solutions are compositions of business offerings.
Other basic principles of SOA, such as granularity, loose coupling and separation of concerns, apply in the customer-centric extended SOA model also. Business offerings can be defined in any level of granularity, with single and simple business offerings becoming parts of more compound business offerings. A need may be satisfied by different business offering, depending on the profile and the preferences of the customer, while the same business offering may be used by different customers to serve different needs through loose coupling. Customers tend want the outcomes of the consumption process and the utility gained and are not concerned with the details of the business processes; the opposite is true for business suppliers that are not involved in the consumption process of separation of concerns (Fragidis, 2008).
Business offering description refers to the discovery, selection, composition and consumption of business offerings and is based on their descriptions. Being a manifestation of the effects that can be delivered from the consumption of a business offering, business offering descriptions serve as the basis for matching business offerings with customer needs and for the development of consumption solutions. Business offerings are difficult to be fully described, because of the great variety of their attributes and functions. For this, the exact structure of business offering description must be adapted on the specific business or market domain. The business offering description should be expressed both in text and in machine processable format. The use of semantics is necessary and a domain ontology that is a set of ontology will support the common definition of the terms used. Business offering description should include the: general attributes such as physical characteristics; functional attributes such as uses, requirements; operational attributes such as delivery details; price such as price, discounts; effects and policies such as validity of offers, constraints, liability and warranty (Prahalad, 2007).
Need is a want or a problem of the customer that has to be satisfied. It refers to what the customer wants to be achieved because of the consumption of business offerings. Need description supports the discovery of suitable business offerings and their composition into solutions that can meet customer needs. Needs description is difficult because customer needs tend to be vague. They must be domain-specific, such as business offering descriptions, because different market domains are expected to satisfy different needs. In addition, need must be described formally to enable intelligent support in the discovery and matching process. Visibility refers to the requirements of achieving contact and interaction between customers and business suppliers to enable the consumption of business offerings and satisfy customers’ needs. Visibility and its preconditions such as awareness, willingness and reusability are supported by the role of intermediaries.
Unlike registries in SOA, which have a limited role and serve usually as simple repositories, the intermediaries should enable and operate the customer-centric business model. They have a key role in every function such as the discovery of products and services, their evaluation and matching to customer needs, their composition, as well as the orchestration and management of business processes required for their provision and empower the customer in the composition of solutions. The intermediary is a business role, not a technology and it is a customer’s agent in the composition of consuming solutions, not a retailer of products and services (Prahalad, 2007).
Consumption refers to activities that allow the use of a business offering for the satisfaction of the customer needs. In particular, it refers to transactions through the execution of services between the intermediary and the business supplier for the ordering, production, composition and delivery of the business offerings that are requested by the customer. Consumption is the gateway with the technological foundations provided by a SOA for the activation of the business processes at the suppliers side. The concepts of interaction, execution context and service interface defined refer to the technical details of using services for the interaction between the intermediary and the business suppliers and the execution of business processes. The intermediation context refers to the systems and technologies used, the policies applied and the processes followed by the intermediary for the execution of its role and the interaction with the customer and the business suppliers.
Consumption effect refers to the outcomes for the customer from the consumption of business offerings. While the business offering description gives the business supplier’s outlook on the outcomes of the consumption of business offerings, the consumption effects refer to the way the customer perceives these outcomes. Verbal descriptions provided by the customer, rating systems, unstructured ways of capturing information, and in general technologies that attempt to capture customer’s disposition and feelings will be useful in this effort. A policy r represents some constraints or conditions on the delivery and consumption of business offerings. It can be imposed by the business supplier or the intermediary or both. Contract refers to any bilateral or multilateral agreement of the customer, the intermediary and the business supplier for the delivery and consumption of business offerings. A contract usually includes the policies (Prahalad, 2007).
Some implementation of this customer-centric mentality have been developed in tourism such as TripWiser and Yahoo! Travel Trip Planner, which support travelers in the planning of their itineraries and traveling activities, American Express launched recently an Intelligent Online Marketplace which claims to offer an “one-stop shop for all business traveling services” from the suppliers of the customer’s preference by executing automatically all the transactions with the business suppliers (Prahalad, 2007).
Accountability Middleware to support SOA
Erl (2005) suggests that SOA has become important for dynamically integrating loosely coupled services into one cohesive business process BP using a standards-based software component framework. SOA-based systems can integrate both legacy and new services, either that enterprises have created and hosted internally or that are hosted by external service providers. When users invoke services in their BPs, they expect them to produce good results that have both functionally correct output and acceptable performance levels in accordance with quality-of service (QoS) constraints such as those in service-level agreements. So, if a service produces incorrect results or violates an SLA, an enterprise must hold the service provider responsible and this is known as accountability. Identifying the source of a BP failure in a SOA system can be difficult, however.
For one thing, BPs can be very complex, having many execution branches and invoking services from various providers. Moreover, a service’s failure could result from some undesirable behavior by its predecessors in the workflow, its execution platform, or even its users. To identify a problem’s source, an enterprise must continuously monitor, aggregate, and analyze BP services’ behavior’s Harnessing such a massive amount of information requires efficient support from that enterprise’s service-deployment infra-structure. Moreover, the infrastructure should also detect different types of faults and support corresponding management algorithms.
Therefore, a fault-management system for a SOA must be flexible enough to manage numerous QoS and fault types. SOA makes diagnosing faults in distributed systems simultaneously easier and more difficult. The Business Process Execution Language (BPEL) clearly defines execution paths for SOAs such that all interactions among services occur as service messages that we can easily log and inspect. On the other hand, external providers might own their services, hiding their states as black boxes to any diagnosis engine and making diagnosis more difficult.
According to Erl (2007) many enterprise systems use business activity monitoring (BAM) tools to monitor BP performance and alert them when problems occur. Current BAM tools report information via a dashboard or broadcast alerts to human managers, who then initiate corrective action. For SOA systems, BAM might become part of the enterprise service bus (ESB), which is a common service integration and deployment technology. Enterprises can extend ESBs to support monitoring and logging and to provide both data analysis and visualization for various services deployed on it. Accountability is “the availability and integrity of the identity of the person who operated”. Both legal and financial communities use the notion of accountability to clarify who is responsible for causing problems in complex interactions among different parties. It is a comprehensive quality assessment to ensure that someone or something is held responsible for undesirable effects or results during an interaction. Accountability is also an important concept in SOA because all services should be effectively regulated for their correct executions in a BP. The root cause of any execution failure should be inspected, identified, and removed to control damage. If accountability is imposed on all services, service consumers will get a clearer picture of what constitutes abnormal behavior in service collaborations and will expect fewer problems when subscribing to better services in the future.
Lin (2007) points out that to make SOA accountable, the system infrastructure should be able to detect, diagnose, defuse, and disclose service faults. Detection recognizes abnormal behavior in services: an infrastructure should have fault detectors that can recognize faults by monitoring services, comparing current states to acceptable service properties, and describing abnormal situations. Diagnosis analyzes service causality and identifies root service faults. Defusing recovers a problematic service from the identified fault. It should produce an effective recovery for each fault type and system-management goal. Disclosure keeps track of services responsible for failures to encourage them to avoid repeating mistakes. There are some accountability challenges that a SOA’s inborn characteristics introduce. A SOA accountability mechanism must be able to deal with the causal relationship that exists in service interactions and find a BP problem’s root cause. A SOA accountability mechanism should adopt probabilistic and statistical theory to model the uncertainty inherent in distributed workflows and server workloads. The problem diagnosis mechanism must scale well in large-scale distributed SOA systems. To prevent excessive overhead, a system should collect as little service data as possible but still enough to make a correct diagnosis. Given below is a model of an accountability system.
All services are deployed on the Intelligent Accountability Middleware Architecture ASB middleware. The middleware uses multiple agents to address monitoring requirements. Each agent can monitor a subset of services (shown as the circled areas). All agents report to the accountability authority (AA), which performs diagnosis. The AA is controlled and observed by users via the user console (AC). The middleware extends an ESB to provide transparent management capabilities for BPs. It supports monitoring and diagnosis mainly via service-oriented distributed agents. The middleware can restructure monitoring configuration dynamically. Situation-dependent BP policies and QoS requirements drive its selection of diagnosis models and algorithms. The middleware then adopts and deploys a suitable diagnosis service. There are three main components: accountability service bus (ASB) transparently and selectively monitors service, host, and network behaviors; accountability agents (agents) observe and identify service failures in a BP; and the accountability authority (AA) diagnoses service faults in BPs and conducts reconfiguration operations. When enterprises use SOA, choosing which service to use at what instance can fluctuate continuously depending on current service performance, cost, and many other factors. For such a highly dynamic environment, few existing frameworks can automate the analysis and identification of BP problems or perform reconfigurations. Please refer to the following figure that illustrates the middleware components used in the accountability engine (Lin, 2007).
According to Lin (2007), the accountability authority (AA) performs intelligent management for the deployment, diagnosis, and recovery of a service process. Agents collect data from the accountability service bus (ASB) for problem detection and analysis. The ASB extends enterprise service bus (ESB) capabilities by providing a profiling facility to collect service execution and host performance data. The services are deployed on the ASB. In addition to a service requester and any services deployed, the architecture’s two main components are the AA and the agents. These components collaborate to perform runtime process monitoring, root-cause diagnosis, service process recovery, and service network optimization. The AA deploys multiple agents to address scalability requirements. Each agent monitors a subset of services during BP execution. The AA also performs intelligent management to deploy, diagnose, and reconfigure service processes. The AA receives BP management; requests from process administrators; deploys and configures the accountability framework once a process user submits a process for management; conducts root-cause diagnosis when agents report exceptions; initiates a process reconfiguration to recover process execution. Agents act as intermediaries between the ASB, where data is collected, and the AA, where it goes for analysis and diagnosis. They’re responsible for configuring evidence channels on the ASB; performing runtime data analysis based on information the ASB pushes to them; reporting exceptions to the AA; and initiating fault-origin investigation under the AA’s direction. The ASB extends ESB capabilities by providing a distributed API and framework on which agents can collect service execution and host-performance data. Agents can do this by either using the ESB’s existing service-monitoring API or any attached profiling interceptors to collect monitoring information such as service execution time. Both services and agents can be invoked across administrative boundaries (Lin, 2007).
Agents can push or pull data and collect and send it at configurable intervals. Enterprises can install the ASB on any existing ESB framework as long as that framework supports service-request interception or other means to collect service data. In addition to these components, the there is also a QoS broker, which offers QoS-based service selection, to assist the service requester in fulfilling end-to-end QoS requirements during a BP composition. There should be an additional reputation network brokers that will help evaluate, aggregate, and manage services’ reputations. A service’s reputation is a QoS parameter that affects the BP composition; users are more likely to select services with better reputations (Lin, 2007).
As seen in the above figure, Users submit requests for a business process and the end-to-end quality-of-service (QoS) requirements. The QoS broker then composes the service network for deployment. The middleware, in turn, configures the diagnosis and recovery environment. During service process executions, fault detection, diagnosis, and recovery are continuously conducted to ensure process performance. Services’ reputations are also recorded in a database for future reference. Users with help from the QoS broker first compose the BP they wish to execute, based on QoS requirements for the process. The QoS broker also automatically generates a backup service path for each selected service in the process for fault-tolerance reasons. The backup path can be as simple as another service that replaces the current one when it’s no longer available or as complex as a new sub process going from the service’s predecessor to the end of the complete service process (Lin, 2007).
The AA implementation produces a Bayesian network for the service process on the process graph, as well as both historical and expected service performance data. The AA then runs the evidence channel selection algorithm to yield the best locations for collecting execution status about the process. It also selects and deploys monitoring agents that can best manage the services in the BP. In addition, the AA configures the hosts of the selected evidence channels so that they’re ready to send monitored data at regular intervals to responsible agents. Once the process starts to execute, the ASBs will collect runtime status about services and the process from the evidence channels and deliver it to agents. If an agent detects an unexpected performance, it will inform the AA to trigger fault diagnosis. The AA’s diagnosis engine should produce a list of likely faulty services. For each potential faulty service, the AA asks its monitoring agent to check the service’s execution data, located in the ASB’s log. Those data might confirm whether a service has a fault. When the AA finally identifies a faulty service, the AA will initiate the service recovery by first deploying the backup path. In cases in which the predefined backup path isn’t suitable for the detected problem (for example, there are multiple service faults), the AA will ask the QoS broker to produce a new backup path or even a new BP for reconfiguration. The AA keeps the diagnosis result in a service-reputation database to disclose the likelihood of the service having a fault, along with the context information about it. Such information is valuable to the QoS broker because it can indicate that the service might be error-prone in some specific context (Lin, 2007).
Papazoglou, (2007) comments that the accountability framework is designed to help enterprises pinpoint responsible parties when BP failures occur. To achieve this, service provider transparency is not only critical to the user but also provides important input for the agent. However, third-party service providers have a right to decide the trade-offs between transparency on one hand and privacy and security on the other. To participate in the accountability framework, external service providers might install the ASB to keep an audit trail locally for their services. Optionally, they can let the ASB push performance data to agents in real time if they want to give users an added level of transparency. Agents are themselves standalone services that service clients, service providers, or other third-party providers can all deploy. In the design, the AA will select agents to efficiently and scalable report data about services that belong to a particular BP. Providers of “healthy” services will benefit because the reported performance data can clear them of any failure responsibility. Transparency is more valuable than privacy to most service providers.
On the other hand, some service providers might not be willing to open up their execution status completely. The system makes cooperation from service providers easy by letting them choose among various levels of transparency. Simple auditing requires the service provider to install only the ASB layer for its services, thus activating data collection. However, this data is stored locally, and an authorized agent gives it to the AA only when requested in the diagnosis process. Dynamic monitoring requires ASB installation and also allows dynamic monitoring of services via deployed agents the service provider installs. Deployed agents need only conform to a standard interface, so service providers can use their agent implementations to participate in diagnosis. Dynamic third-party monitoring is similar to the previous level except that third-party “collateral” agents collect and process the data. Given that external agents produce monitored data in the latter two levels, the diagnosis process must be able to reason about the likelihood of incorrect or incomplete data. Techniques for privacy-preserving data reporting might help overcome this potential problem. Following figure shows an example of an implementation (Papazoglou, 2007)
Above figure shows an example of the implementation for the print and mail business process (BP). The BP shows the flow of a mass-mail advertising task. The BP has a total of 13 services. Each node is a service to be invoked in the BP. Nodes with multiple circles have several provider candidates that can be selected; parallel branches are services that can be invoked concurrently.
Case Study BPEL and SOA for e-commerce Web Development
Pasley (2005) reports about a case study for eCommerce development that used BPEL with SOA. The author reports that Business Process Execution Language is being used more often for tasks of modeling business processes in the web service architecture. Firms face problems when integrating other IT systems that they have and programmers have to initially solve the integration problems at the communication level. This means that different data formats and transport protocols are integrated. Only after these problems are solved can firms undertake measures to make the IT systems support the business processes. Business process modeling – BPM had been previously used to solve these integration problems but since many of the systems are proprietary, they have only a limited integration with different IT systems. The current trend is to use Business Process Execution Language to model the business processes in the web services architecture. The standard for BPEL is based on XML and used to define the business process flows.
BPEL allows tasks such as orchestration of synchronous or client-server and asynchronous or peer to-peer Web services and also for state full long running processes. Since the XML standard is open, it is interoperable and can be used in different environments. It is well suited to the service-oriented architecture, a set of guidelines for integrating disparate systems by presenting each system as a service that implements a specific business function. BPEL provides an ideal way to orchestrate services within SOA into complete business processes. BPEL would fit into the Web services stack, some of BPEL’s key benefits, and by targeting Web services for use with BPEL makes the creation of an SOA easier than ever. As an example, a case study of integration project in which a phone company wants to automate its sign-up process for new customers. The process has four separate systems based on different technologies. There is the Payment gateway, a third-party system that handles credit-card transactions and is already exposed as a Web service.
Next is the Billing system hosted on a mainframe and it uses a Java Message Service (JMS) queuing system for communication. Another system is the Customer-relationship management CRM system that is a packaged off-the-shelf application and finally a Network administration system a packaged off-the-shelf application implemented in Corba. Combining these systems into a single business process would require several tasks. First, developers must solve various integration issues by exposing each system as a Web service. They can then use BPEL to combine the services into a single business process.
Pasley (2005) suggests that programmers should create a distributed software systems whose functionality is provided entirely by services. SOA services can be invoked remotely; have well-defined interfaces described in an implementation-independent manner, and are self-contained where each service’s task is specific and reusable in isolation from other services. Service interoperability is important though many middleware technologies to achieve SOA have been proposed, Web services standards can meet the universal interoperability needs. Services will be invoked using SOAP typically over HTTP and will have interfaces described by the Web Services Description Language (WSDL). By using SOA and ensuring that each of the four systems complies with SOA’s service definitions, the phone company can solve the integration problem. Each system already complies with some definitions. The billing system is an asynchronous message-based system that performs specific business functions based on particular messages sent to it. However, the message formats are not defined in a machine-readable form. The network administration system is Corba-based, so its interface is defined using IDL, but the system is based on an object-oriented, rather than a message based, approach. To proceed with integration, the company needs a system to fill these gaps and raise each system to SOA standards. Please refer to the following figure that gives details of the architecture.
As seen in the above figure, the resulting ESB architecture consists of three layers. The lowest is the existing enterprise infrastructure, which includes the IT systems that provide much of the functionality to be exposed as Web services. The ESB sits on top of this layer and contains adapters to expose the existing IT systems and provide connectivity to various transports. The top layer consists of business services created from existing IT systems. These services provide essentially the same functionality as the existing systems, but they are exposed as secure and reliable Web services that the organization or its business partners can reuse. The enterprise service bus is a new middleware technology that provides SOA-required features. Within the IT industry, it’s generally accepted that developers use an ESB to implement applications such as those described in the sample project. An ESB provides a hosting environment for Web services, whether they’re new and entirely ESB-hosted or Web service front-ends to existing legacy systems. An ESB connects IT resources over various transports and ensures that services are exposed over standards-based transports such as HTTP so that any Web-service-aware client can contact them directly. The ESB also provides other features that are essential to services deployment, including enterprise management services, message validation and transformation, security, and a service registry. In addition to the runtime environment, an ESB must also provide a development environment with tools for creating Web services. Because reusing — rather than replacing — existing systems is fundamental to the ESB concept, these tools should include wizards to automatically create Web services from other technologies such as Corba or Enterprise JavaBeans (Pasley, 2005).
The payment gateway is already implemented as a Web service and requires no further development. Yet, the ESB is useful since in addition to handling security and reliable messaging requirements, it offers a single management view of the service. To expose the remaining systems as Web services requires additional work. The ESB’s transport-switching capability lets clients access the services through HTTP (or other transports) and forwards client requests to the billing system via JMS. Project developers can define new message formats using XML Schema and create transformation rules to convert to the existing application’s format. The result is a new ESB-hosted Web service that receives requests and transforms them before placing them in the JMS queue. The ESB adapter can be used to expose the CRM application as a Web service. Although the system’s interface is defined in interface definition language (IDL), it is also fine-grained and uses many different objects. The team can use an ESB wizard to automatically create a Web service from the interface description. To create a more coarse-grained interface, the team members have two primary options. They can define a new interface in IDL, let developers familiar with the Corba system implement it, and then expose it using ESB wizards. Alternatively, they can design the new interface in WSDL and create the Web service from there. The service implementation can act as a client of the Corba system directly or through an ESB-generated Web-service interface. The best option here depends on several criteria, including the developers’ skillset (Booth, 2004).
BPM introduces a fourth layer to the ESB architecture. Using an SOA, all of an organization’s IT systems can be viewed as services providing particular business functions. Because the ESB resolves integration issues, BPEL can orchestrate these individual tasks into business processes. BPEL expresses a business process’s event sequence and collaboration logic, whereas the underlying Web services provide the process functionality. To gain the most from BPEL, developers must understand the dividing line between the logic implemented in the BPEL processes and the functionality that Web services provide. BPEL has several core features. Actions are performed through activities, such as invoking a Web service or assigning a new value in an XML document. Activities such as while or switch offer the developer control over activity execution. Because it was designed to implement only the collaboration logic, BPEL offers only basic activities. BPEL describes communication with partners using partner links, and messages exchanged by partners are defined using WSDL. Web services operate using client-server or peer-to-peer communications. In client-server communication, the client must initiate all invocations on the server, whereas in peer-to-peer communication, partners can make invocations on each other. BPEL extends WSDL with partner link definitions to indicate whether client-server or peer-to-peer communication will be used. In peer-to-peer communication, each partner uses WSDL to define its Web service interfaces; partner links define each partner’s role and the interfaces they must implement. BPEL supports asynchronous message exchanges and gives the developer great flexibility regarding when messages are sent or received. It also gives the developer full control over when incoming messages are processed. Using event handlers, BPEL processes can handle multiple incoming messages as they occur. Alternatively, they can use the receive activity to ensure that particular messages are processed only once the business process reaches a given state. These process instances can persist over extended periods of inactivity. A BPEL engine stores such instances in a database, freeing up resources and ensuring scalability. BPEL provides fault handlers to deal with faults that occur either within processes or in external Web services. Developers can also use compensation handlers to undo any previous actions, which gives them an alternative approach to providing a two-phase commit based on distributed transaction support. When a business process instance extends over a long period or crosses organizational boundaries, it’s impractical to have transactions waiting to commit. The compensation handler approach is more appropriate in this scenario (Booth, 2004).
Commercial BPEL engines provide management consoles that let operators monitor business process states, including processed messages and executed activities. This lets operators see inside the running BPEL processes largely than is possible with other technologies. Such tool support, which is easily built around BPEL, is an important benefit to using the language. Because it is an open standard, developers can use BPEL scripts in different environments and exchange them between organizations. They can use these scripts to provide additional details on message interactions beyond that offered by WSDL, including descriptions of business-process life cycles the message-exchange order. In addition, tools can extract correlation information from within BPEL scripts to correlate messages to particular business transactions. For example, a management console could use such information to identify messages of interest to the operator. Developers can also provide sample executable BPEL scripts to show partners how to use their Web services. Business partners can load these examples into their environments and customize them for their use (Booth, 2004).
Case Study – SOA implementation for an Educational Board
Li (2008) has reported a case study about SOA implementation for an educational information resource management system. With rapid growth in the types of educational information resources on the Internet there are issues of diversity and individuality of people’s learning demands. The problem is how quickly can one meet the market demand to ensure that the customers requirements are met. At present, resource management systems available use B / S three-tier model and the system was sufficient to meet the needs. However, when the demands change, it is necessary to expand the existing systems’ operational function, the traditional resource management system can not make this quick response, so repetitive development delays are common. The educational information resource management system based on SOA is the best solution for these problems. SOA is a software architecture where functionality is grouped around business processes and packaged as interoperable services, it also describes IT infrastructure which allows different applications to exchange data with one another as they participate in business processes. The educational information resource management system based on SOA is composed of service elements, and it changes large scale applications into reusable components or “services”, through the combination of services and the composition of business processes, it can achieve the target of quick reaction for management system accordance to existing resources market demands, it will change the system management from passive information management into active workflow management, and it can reach the goal of a rapid escalation of the system functions and business expansion, and it can also increase the system’s agility and flexibility, greatly reducing system management and maintenance, but also it can shorten the system development cycle.
The educational information resource management system based on SOA follows the principle of business driving services and technology driven services, and serving as the center, it achieves the retroactivity and easy scalability of the system. When external users want to access resources management system, firstly, via operation and access, it can call the appropriate service entity by accessing high-level service interfaces; meanwhile, the system will call the bottom and directly access resource network by the mechanism of resources of discovery and location, so users can read, browse and search relevant resources. The original resources can access various types of resources through the dealing with multi-mode resources gathering service. After the processing of handling of standardization and copyright for the resources, the basic information about the resources will be filled into the meta-data database, and it will call the resources registration services, resources directory services and resources optimization services to finish the resources entities registration into the system. Users’ can finish resources registration completing the resource basic information, resource information registration and the import of resource entities via external interface, and it also can be completed by resources creation tools and the standardization of treatment resources directly into the resources database.
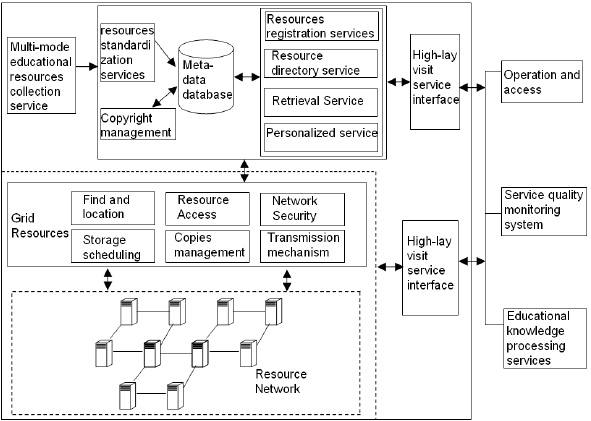
The Specific functions of the educational information resource management system based on SOA include several functions modules, such as user management, courseware management, courseware, search, courseware statistics, feedback information, notice, system help, about us, and so on. In this system, users can search the registered information about the educational resource, and it can also help users to quickly and accurately target educational resources location, view and download their need resources. The system can respond quickly to requests from users, while user amends the educational resources and the registration information, it can ensure the synchronization between the subsystem of educational resource management educational resources registration and searching system. The system can help the administrators to finish the educational resource registered system and search system’s daily management, such as user management, resource database management, resource registered information and system log management. The system can finish the statistical management about educational resource registered information, such as the statistics about some courseware which have a high rate of the Click-through Rate, and you can set the direct link, so that it can connect directly with the network educational resource of the resource management subsystem. The administrators and users can manage system and search about their need source on the Internet. The system can help you to rapidly escalate and update the system’s operational functions, and meet the market demands (Li, 2008). Please refer to the following figure.
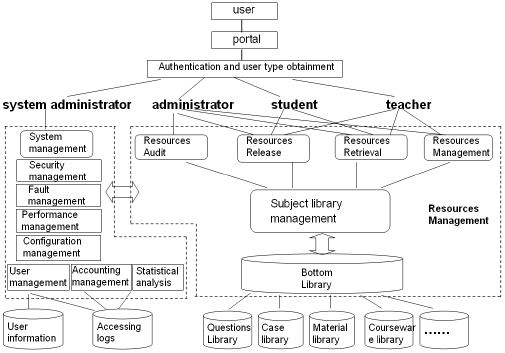
To obtain various types of resources, the system will call the multi-mode resource collection service in the phase of resources acquisition, so it can rich the resource database. After the collection of the resource, all the resource should be dealt with by standardization, so that we can unify the standard of resources, and it is easy for users to search and access the resource. Unless the resources accord with the standards, otherwise the resources cannot be imported into the database. Please refer to the following figure.
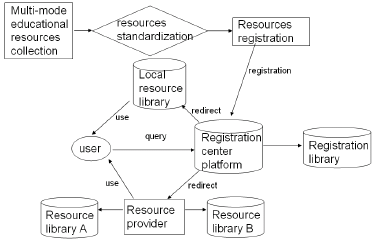
In the phase of the resource standardization, we should get a detailed description of all the resource, such as course types, course name, learning object, the entry skill and so on. And all information is described in the file of XML. After the standardization of the resource, all the resource can be stored in the database, and the information stored in the resource database may just be a XML file, furthermore, the resource entities may be stored in local or in remote, but the XML files including information about resource must be given the right resources URL and the users’ operating authority. When the users login in the system, you can search about your required resource by the registered center platform and browser the searched resource information. By obtaining the URL of the required resource, if the resources are located in local, the resource provided by the local resource database will be directly afforded to users, otherwise, it will be located to the resource providers. It will call relevant resource stored in database by resource providers (Chou, 2008).
Understanding the differences between SaaS and SOA
Laplante (2008) that there is some amount of confusion between the terms software as a service – SaaS and SOA. The main difference between SaaS and SOA is that SaaS is a software-delivery model while SOA is a software-construction model. The SaaS model, also called as a subscription model, it separates software ownership from the user. The owner is a vendor who hosts the software and lets the user execute it on-demand through some form of client-side architecture via the Internet or an intranet. This new model delivers software as utility services and charges on a per-user basis, similar to the way the ISP provider charges for the Internet connection. One of the better known SaaS product example is the Salesforce.com tool for customer relationship management. SaaS products are available for a wide range of business functions such as customer service, HRM, desktop functionality, payroll, email, financial applications, SCM and inventory control. In a SOA model, the constituent components of the software system are reusable services. A collection of services interact with each other through standard interfaces and communication protocols. SOA promises to fundamentally change the way internal systems are built as well as the way internal and external systems interact. This architectural strategy goes along with software applications that are close to business objects that help to create an abstraction layer. SOA is also a consistent framework for plugging inappropriate software statically and dynamically. Some of the major SOA players and their latest products include BEA AquaLogic, Sonic SOA Suite 6.1, Oracle Web Services Manager, HP Systinet Registry 6.0, Iona Artix 5.0, Cape Clear 7.5, Microsoft.NET, Sun Java Composite Application Platform Suite, and IBM WebSphere. The list would have a technology architecture, a process architecture, an application architecture, and so on. SOA helps bring these together, but it’s not always easy to move in that direction with so many, diverse applications involved. Despite their significant differences, SaaS and SOA are closely related architectural models for large-scale information systems. Using SaaS, a vendor can deliver a software system as a service.
Using SOA enables the published service to be discovered and adopted as a service component to construct new software systems, which can also be published and delivered as new services. The two models complement each other: SaaS helps to offer components for SOA to use, and SOA helps to quickly realize SaaS. Although both provide promising features for the modern software industry, they’re just conceptual-level models and require detailed technology to support them. At present, the best known enabler supporting both SaaS and SOA is Web services technologies—programmable Web applications with standard interface descriptions that provide universal accessibility through standard communication protocols. Web services provide a holistic set of XML-based, ad hoc, industry-standard languages and protocols to support Web services descriptions, publication and discovery, transportation and so on (Laplante, 2008).
SOA Governance
SOA Governance refers to the practice of ensuring that all assets, people, IT and business infrastructure are leveraged to add value to the implementation of SOA. The term means that there should effective use of SOA principles to get the maximum benefit from the integration. Some issues have to be considered for proper governance. Any investments that are made for the move of SOA have to deliver appropriate short term and long-term returns. The returns may include increased ease of use, reduced deployment costs of new applications, faster building of applications and so on. The SOA framework has to comply with laws and standards other auditing requirements such as the Sarbanes-Oxley Act and other legal requirements. Change management of services can sometimes have unanticipated consequences since consumers and providers may be unknown entities. Any changes that are done have to be made after proper understanding of the impact and there must be some facility to roll back the changes. Quality of service is important since new services can be added as and when required and there is no way to verify if the services are proved and verified.
Since services can form a chain of providers and consumers, if there is any malfunctioning service, then the whole system can crash. SOA governance also includes some important activities and they are management of the services portfolio to ensure that new services are properly planned and existing ones are upgraded. There is also a need to manage the service lifecycle to ensure that when existing services are updated or upgraded, any current consumers are not cut off. There is also a need to create system wide policies to control behavior of providers and consumers and to ensure that there is a consistency in the service offerings. Performance monitoring of the services is important since any downtime or under par performance can severely impact the QoS and the system health. Diagnostic tools have to be in place to quickly trace the fault and set corrective actions (Fragidis, 2008).
SOA Best Practices
Hadded (2005) has suggested some best practices for SOA implementation and these are grouped in five areas. The areas are: Vision and Leadership, Policy and Security, Strategy and Roadmap Development, Acquisition and Governance and Implementation and Operations. These are briefly explained as below.
Vision and Leadership
- Evangelize and advertise about the advantages of SOA and web services and transformation that can be accrued.
- Change mindset and think differently since the traditional deployment methods are not suited for SOA. Issues such as boundary, operational and functional scope have to be rethought.
- Since there would a paradigm shift in the transformation, there is a need to manage issues related to strategic, cultural and other tactical issues related to the transformation.
- There is a need to address issues related to cross business and domain transformations since the firm would be dealing with resources across the organization. There is a need to make cultural adjustment and not just the business processes.
- All activities have to be properly documented and business cases for SOA have to be prepared. This is required to bring in transparency, plan and execute strategy, manage resistance and help to mitigate risks
- There is a need to adopt both a top down and a bottom up approach to ensure that cultural differences and issues are resolved.
Policy and Security
- Technical standards must be established and published extensively. These standards have to be made available to internal as well as any partners who may be developing compatible solutions. While SOA is designed to handle integration of diverse applications, the architecture development should be standardized to avoid excessive configuration problems. These would include XML and WSDL standards and toolkits.
- Portfolio management policies have to be created along with policy information standards and they must be published in the standards registry.
- Interoperability of applications must be developed to form many to many loose coupling web services. Such an arrangement helps to resolve problems related to versioning of services.
- There should be established directives and policies for reuse, governance, risk management, compliance, versioning and security.
- Security and integrity of services are very important and multiple approaches for ensuring security at the service level is important. There should be a facility to conduct audit trails of all transactions as and well required.
- It should be clearly defined if services are run for a user or a user role and this makes user identification management and authentication critical. Security must be enforced through strict security policies at the transportation and the messaging level.
- There should be a plan for business continuity and disaster recovery planning along with disaster management. In the current scenario, threats can come from terrorists as well as natural disasters. There must be sufficient backup procedures of data and transactions so that recovery of the system can be quickly done if a disaster strikes
Strategy and Roadmap Development
- The SOA strategy and imperatives must be planned, discussed and documented and details such as current scenario and targeted outcomes must be specified. There is also a need to specify SOA metrics that would be used to measure the current and changed state.
- Transformation planning and deployment should be incremental since SOA is an iterative process. The process should first begin with extensive data collection and development should be done phase wise. Such an approach helps to observe and take feedback along with any corrective actions.
- The concept of shared services for time and return should be taken with proper investment plan. A cross channel view should be taken of the projects and feedback taken from multiple users.
- Shared services should be added as and when new requirements are developed. Redundancy should be reduced.
- There is a need to first create a topology of different services that would reveal the business processes.
- There should be a common vocabulary of taxonomies so that there is a proper understanding of the hierarchies. With a common vocabulary, it is possible to manage different business areas and increase collaboration.
- Cross enterprise architecture is important as it removes boundaries between business partners and removes information silos.
- There is a need to have common interoperability standards by using standards such as WSDL and SOAP contracts.
Acquisition and Governance
- All activities of web services acquisition should be incremental and priority applications should be targeted first.
- Collaborative demos, simulations and experiments should be used to understand how the system functions, before taking up enterprise wide integration
- Enterprise modeling can be used to identify business processes. This helps to define the dimensions, scope boundaries and the cross boundary interactions.
- Policies should not just be documented but also enforced. Compliance to policies should be made mandatory.
- Since the services are loosely coupled, the framework adopted should be much more robust. There should be clearly defined compliance rules and for mapping of the business and IT policies with the infrastructure.
- The SOA network should be monitored, analyzed and measured as per the metrics to understand its performance. It should not be left to run on its own and would need intervention at least in the initial stages before the process stabiles.
- Standards based registry should be used to promote discovery and governance of the services. The registry is the core of the SOA solution and it helps to increase reusability, reduce redundancy and allow loose coupling by using service virtualization and orchestration.
- Run time discovery can be implemented during actions such as load balancing to handle large number of service requests or when high value information has to be transported.
- BPEL, UML and other standards based process models should be used to increase the process model interoperability.
Implementation and Operations
- Implementation has to be done incrementally with lower applications and then the back end migrations and migration of applications to services interfaces should be done at the last stage. There should be a priority set and the first tasks should be for applications that have the highest business value.
- Partnerships and collaborations approach brings better results.
- Implementation is more difficult than creating demos and prototypes.
Enterprise Resource Planning – ERP
This chapter would discuss at length various aspects related to ERP and create a thorough understanding of how ERP is designed to operate, what it can do and how it would help the future of computing.
Enterprise Resource Planning – ERP is a process of integrating different software applications in an organization so that exchange of data, information and transactions through the enterprise is enabled. ERP solutions are of two types, one is where an organization already has some legacy applications that are running on systems in different departments and locations. In this case, ERP would attempt to migrate the data from all these applications to a common platform called the enterprise platform and thus allow seamless integration and data flow. Another type of ERP is when a new organization has decided to implement a software application across all departments in an organization and this is a new implementation. Technically, the former implementation where different legacy applications have to be integrated is the most challenging (Molla, 2005).
Large organizations that have multiple locations have a problem of enforcing uniform policies and sharing information across these locations. In addition, these organizations have departments such as purchase, stores, logistics, manufacturing, marketing, accounting and finance and so on. These departments would be functioning independently and may be using their own IT systems that are used to perform routine tasks. The IT applications serve as business decision making tools and provide the departments with the means to plan their work, update status, perform transactions and so on. When these applications have been developed over the years, they would be regarded as legacy applications. The problem comes when one application from a department has to communicate with another application. Since these applications may have been made by different software vendors, there are a difference in the data structure, how variables are defined, input and output types required and so on.
On their own, these applications would be performing all the required tasks. However, the problem arises when these systems are not able to communicate with each other and the systems become information silos. Without exchange of information, the organization would become static and there is no way of resolving issues related to billing, procurement and so on (SAP, 2008).
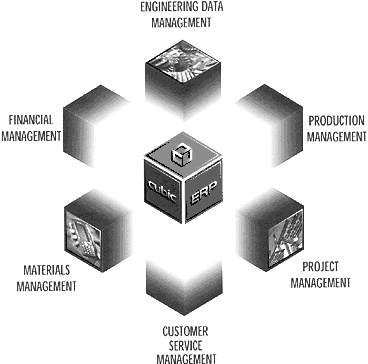
Earlier, organizations attempted to enter data multiple times in different systems, but this lead to errors and omissions besides duplicating efforts and the reaction time was very long. When the top management wanted a report on the value of inventory, the receivables and payables, assistants had to extract data from the stores systems, match it with purchase system and reconcile it with the accounts system and this was a very roundabout manner, besides lacking transparency and taking too much efforts. Typically, erring staff at inventory or purchase would attempt to hide or overstate facts and the management had a difficult time in knowing how much dead inventory they had, how much was needed and the amount of capital blocked in inventory. There was also a problem with forecasting demand and planning for the production and this led to further blocking of funds (Kim, 2005).
ERP helps to remove some of the problems associated with transparency, planning, managing inventory and production, ensuring that goods are manufactured and dispatched as per the demand and in reducing costs. It must be understood that ERP is a software system that can only point out problem areas and help to share data at the enterprise level. It is not designed to solve workflow problems, process problems, manufacturing and technical problems and so on. It is not a magic tool that would force unwilling employees to change.
When ERP can be considered
ERP can be considered when there is some amount of order in the input that an organization receives and there are a set of specific objectives and outcomes expected. If the organization is chaotic and work systems are haphazard and ad hoc, then there should be a work improvement plan before ERP is considered. These are illustrated in the following figure.
Organizations can consider implementing ERP when there are certain issues and business conditions. Some of the conditions when ERP can be considered are (Dehning, 2003):
- Mismatch exists between demand forecast, procurement, stores and inventory, manufacturing capacity and logistics.
- The operating costs are very high when compared to industry standards and the costs are not directly due to high wages or raw material costs. The operating costs are high because of unplanned procurement, no proper scheduling and the amount of dead inventory is very high.
- There is a duplication of efforts in entering data.
- Production sees either a stock out situation where workers and machines remain idle for want of raw materials or there is a glut when large unplanned deliveries of raw materials arrive.
- Marketing is not able to forecast demand accurately and this makes procurement difficult and production erratic.
- The IT system is not integrated across the departments and people have to carry data media and enter it multiple times.
- IT systems cannot exchange data since different systems are incompatible. This would mean that when purchase procures material and raises a voucher, the accounts department is not able to access the voucher and make payment.
- There is no strategy for managing inventory for the simple reason that stores do not know when material would arrive or what vendor would make the delivery.
- Vendor management is a problem since there is no system to rate them on quality and delivery.
- HRM finds it difficult to reconcile wages of employees as per their production, there is a problem in planning for recruitment, skill verifying and other employee related issues such as appraisals
- Top management finds it difficult to access a consolidated view of the operation status. People spend too much efforts in accessing information
The above are some of the reasons to consider for ERP implementation. It should be understood that many of the above problems could also be solved by sharing information and proper work planning, reducing rejections and technical problems. ERP should be implemented after problems are solved in the company. However, with an ERP system, routine tasks become automated and there is lesser need for manual entry of data, data needs to be entered only once and there is transparency and accountability in the organization (Dehning, 2003).
Advantages of ERP
ERP offers integration of different departments and removes silos of information. This is illustrated as below.
There are some advantages of implementing ERP solutions and thee are (Loh, 2004):
Faster inventory turnover: In a large organization, inventory turnover may happen once or twice a year. With ERP in place, it is possible to automate the process and since all information is entered into the system daily, it is possible to obtain inventory turnover as and when needed. This helps the organization to control its stockholding patterns by carrying out an ABC analysis of the inventory.
Enhanced customer service: With ERP systems, it is possible to increase customer response fill rates to about 90%. This would mean that customer requirements would be met more often, as and when needed.
Better cash flow: Since finance and accounts systems are integrated along with other departments, it is possible to source material and ensure payment as per the payment terms regularly. With ERP in place, cash on hand, receivables, payables, outstanding amount and other financial details can be reconciled easily and organizations would procure only items that are needed.
Better planning: ERP helps to forecast demand for products and create a schedule where marketing could tell with more accuracy which products are needed and when. Since the raw material required for each component are fixed, it is possible to calculate the total common components that are required and create a schedule for the delivery. This would be again matched with stock in hand and only shortfall material can be ordered thus reducing the capital blocked in inventory.
Strategic planning: With accurate information available to the management, it can take up planning to understand problems in different departments of the organization. Once the problems are identified, it is possible to segregate the bottleneck areas, technology gaps, and manpower problems and increase productivity and make the organization more efficient.
Vendor management: ERP allows vendors to be rated as per the quality and timeliness of deliveries. Once vendor performance is quantified as per metrics, tiers for vendor ranking can be initiated and reduce the number of vendors to the few that show good performance.
Task automation: ERP helps to automate routine tasks and with barcode readers installed in the organizations, tasks such as entering details when stock is brought in or taken out of stores, billing, voucher generation, cheque or online transfer of payments and some other tasks can be automated. This helps to reduce errors that can arise during manual entry and reduce manpower requirements.
Manpower planning: HRM can make good use of the HR module that allows payment of wages, based on inputs such as attendance card swiping, production figures, overtime, holidays and leave and so on. HRM can also enter employee appraisal details into the system and make promotions, reduce errors of wage calculation during annual salary hike and so on.
Logistics: With known schedule of manufacturing, it would be possible to know when exactly goods would be manufactured and when they would be ready for dispatch. Based on this data, logistics can plan shipment to different destinations and ensure that the trucks spend the least time waiting for material.
Domain Areas for ERP
ERP applications have some modules that can be implemented selectively or an organization could implement it in all domains. These modules are designed to function as standalone units and they can later be integrated easily if the modules are bought from the same vendor.
Some modules available and the upper level functionalities they perform are (Fiona, 2001):
- Manufacturing and production module: Would include functions such as bill of materials, capacity planning, engineering, manufacturing projects and flow, workflow management, cost management, quality control, manufacturing process and reporting.
- Financials Module: cash management, GL, voucher generation, JV entries, accounts payable and receivable, budget allocation and verifying expenditure, financial controls, balance sheets and accounting and report generation.
- Supply chain management module: inventory management, purchasing, Order to cash, supplier scheduling, product configuration, supply chain planning, commission calculation, order entry, inspection, claim to process, planning logistics, invoicing
- Marketing and sales: Demand forecasting, identifying market trends, competition analysis, pricing, channel and distribution management
- HRM: payroll, time and attendance, training, HR planning and appraisals, employee self help, rostering
- CRM: managing customer needs, understanding requirements, complaint management and escalation, call center and help desk, service, data mining and other functions.
- R&D: Feeding market intelligence reports to the R&D department so that competitive products can be developed
The complete ERP suite would have all these modules hosted on a central server with mirror servers. Depending on the user role and designation, users can access functionalities required to complete their tasks. There can be access restriction for users based on their roles and as an example, a data entry operator can only enter details of materials delivered by a customer but he would not be able to see the rates or have the authority to revise the rates and quantities.
History of ERP
ERP has gone through different phases such as the early inventory systems that were used when computers were still not developed, MRP I, MRP II, ERP and the current version of EAS. These are briefly discussed in this section.
Early Inventory Management and Control
The history of ERP systems started in the early 1960s when industrial production had stabilized after the decade following the Second World War. Computer systems in the early 1960’s were very rudimentary, huge, cost a lot of money and the power of current computing was unthinkable. The earlier foundations of ERP began with inventory control and management and it was realized that dead inventory or long procurement times increased the costs for organizations. Lummus (1999) comments that the emergence of modern ERP practices started in the textile industry of US in 1960 where the quick response program was initiated. The movement later was adopted by the grocery retail industry. The author reports that the US apparel industry was facing huge capital lockup in inventories and this had led to high costs. As a result, some members of the US apparel sector in 1964 decided to form the ‘Crafted With Pride in the USA Council’. They asked Kurt Salmon Associates in 1965 to analyze the supply chain that the council members used to procure items from overseas. The report showed that the delivery period required for the raw material, counting the days from the raw material dispatch to dispatch of the finished products took an incredible 66 weeks. Out of this huge period, goods that were dispatched often languished in the stores and warehouses or were in transit. Council members, as per the agreement had to make the payment when the goods were lifted from the vendor and they were burdened with a huge idle inventory for which they had paid and members were incurring huge financial losses, not because of adverse market conditions but simply because no one had looked into the problem of how long purchased raw materials took to enter the workshop.
Kurt Salmon Associates and the Council developed a strategy known as QR – Quick Response strategy. In this strategy, entities such as the vendors, buyers, retailers work on a cooperative basis with each other in a network and share information. This practice allowed the network to respond quickly to the demands from the customer. The report suggested that to improve performance, very few changes in technology were required and this led to the creation of some standards. As a result of this strategy, some standards were established and adopted by industries such as the UPC for grocery sector, EDI standard that allowed information between systems to be exchanged, Point of Sales bar codes for scanning and transferring information on sales to manufacturers and distributors. A set of best practices was suggested that would substantially improve overall performance by expediting quick and accurate flow of information up the supply chain. ECR enabled distributors and suppliers to anticipate future demand far more accurately than the existing system. By implementing best practices, a reduction of an overall inventory level of 37% was achieved and the cost reduction that was achieved was about 30 billion USD, as per 1985 prices. Some further refinements were done such as continuous replenishment (CRP), just in time, customer relationship management and so on (Lummus, 1999).
MRP I
Waldner (1992) has researched that Manufacturing Resource Planning – MRP I was the actual predecessor of ERP systems and was introduced in the 1970s. The software was rather rudimentary with little flexibility and limited functionality and helped in planning production and to manage the manufacturing processes. It did not have any functionality of costing and inventory management with a financial impact analysis. MRP I was designed to meet certain goals and they were to ensure that material was available for production and products were available for customers. The inventory was targeted to be the lowest and it was designed to plan for activities related to manufacturing, purchase and delivery. Critics argued that many of the tasks that were performed by MRP I could be done manually. Please refer to the following figure that gives an illustration of MRP I.
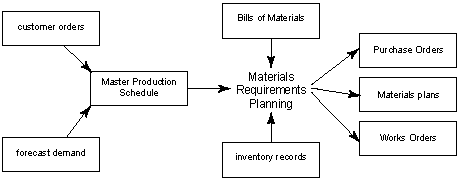
MRP had to answer questions such as items that are required, quantity required and the date and time when they were required. It considered various inputs such as the breakup of the product that was manufactured and a product could have many parts and sub assemblies that had to be procured independently. The information on the breakup of parts was called as the Bill of Materials. Various factors such as time required for production of these parts or the lead time required for their procurement, item wise quantities for each, shelf life if any for the materials, the status of inventory for each item and other details. Planning was done by considering all possible constraints such as men, machines, procurement delays and other delays. In addition, factors such as labor, routings, quality and testing, push and pull techniques for inventory, purchase order maintenance and so on. If everything well as planned and there was no change in the production schedule, then the system worked as desired (Waldner, 1992).
Waldner (1992) points that MRP I had some problems such as data integrity, lack of communication with other systems, lack of matching different lead times and so on. For the system to work properly data integrity must be assured and there should not be any errors in the inventory data and the bill of materials. If there are any mismatches then it is difficult to reconcile the system. MRP I worked with a set production lot sizes and it assumed that there would not be any discontinuities. In common practice, lead-time would vary as per the lot size and if any change in machine loading occurs, then there would be a mismatch. The system also could not reconcile any breaks in production and persisted with the same lead-time estimations, thus creating confusion. Large organizations would have manufacturing plants in different cities and locations. It might happen that one location would have excess inventory of certain items that were in short supply in another locations. MRP I systems could not communicate with systems in other locations and thus organization wide inventory management was not possible. The system could not help in redistributing components across different locations. When new versions of products are launched, MRP I could not carry out planning for both the products and simultaneous MRP calculations were not possible. Another problem with MRP I was that it considered uniform capacity in the calculations and thus the results and planning schedule it gave were difficult to implement.
MRP II
Manufacturing Resource Planning II introduced in the 1980’s was a vast improvement over MRP I. It covers not only material and inventory planning but also addressed operational planning, financial planning and allowed simulations and scenarios to be run. MRP II and its versions are still in use in many organizations that have limited requirements or those that cannot afford large scale and expensive ERP solutions. The software was not as static as MRP I but had some elements of dynamism. MRP II had some modules along with auxiliary modules that could be integrated across the organization. Some of the modules that were provided with MRP II are Master Production Schedule, Item Master Data that provided Technical Data, Bill of materials, Production Resources Data that was used for manufacturing and Inventories and Orders. Following figure illustrates the functionalities in MRP II.
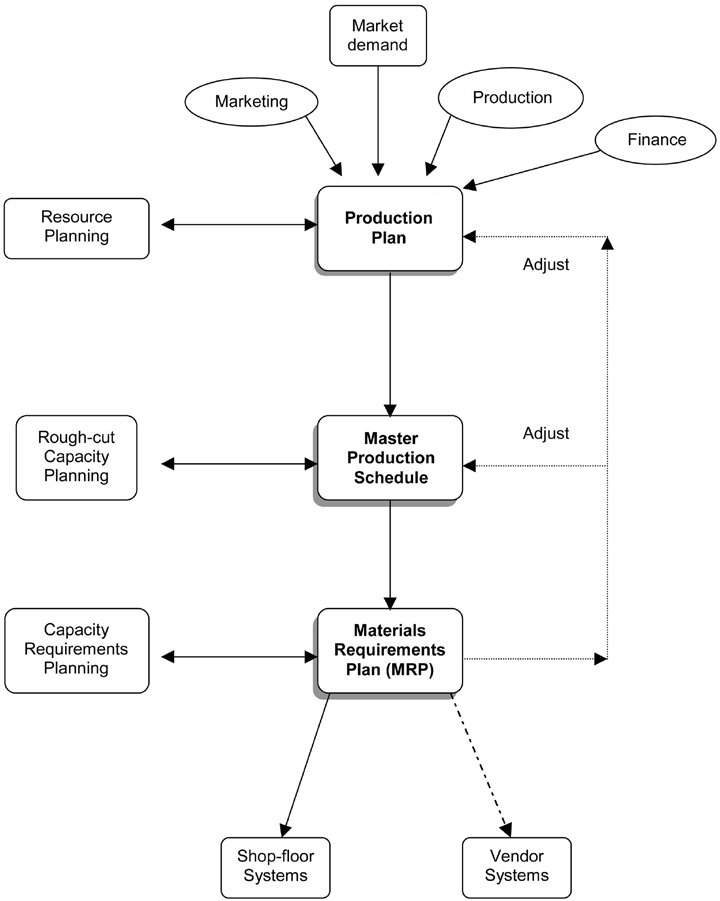
Other modules provided were Purchasing Management, Material Requirements Planning, Shop Floor Control, Capacity Requirements Planning, Standard Costing, Cost Reporting and Management that provided cost control and Distribution resource planning. Auxiliary systems provided included business planning, Lot Tractability, vendor and contract management, Configuration Management, Sales Analysis and Forecasting, financial planning with GL and voucher generation and other functionalities.
MRP II offered a greater amount of central integration and helped in decision making. Managers could take a holistic view of the operations and there was transparency in the organization. Demand sales forecast was the key to the MRP II and since forecasting was more accurate. For a change, forecasting could be based on accurate market inputs and it could be based on economic indicators such as GDP, overall economic growth, inflation and other factors and complex algorithms could be used to forecast the demand. Once the demand was known then the requirements could be split into dispatches for each quarter, each month, week and daily production targets could be set. By integrating all systems, it was possible to transfer data to the purchase system and the bill of materials for a product was used to obtain a breakup of how many parts and sub assemblies were required for a product, stock situation for each product, lead time required, qualified vendors from whom components could be sourced and so on. A definitive schedule for production, based on the economic order quantity, takes into consideration factors such as the set up time, tool change time, machine breakdown and other idle times. It also allowed for smaller batch sizes and production lots to be considered (Chen, 2001).
It must be stated that when MRP II was introduced when computational power was still evolving and most systems operated on DOS, on systems that had very low end configurations. Programming techniques in those days and the languages used were hardcoded into the mainframes that were connected to terminals for users. The programming method itself was not yet developed fully and involved use of Cobol, Fortran, Assembly Language, Pascal and to a little extent C and the database applications were very cumbersome. Operating system that was used was usually Unix and the graphical user interface had not yet been created. Programming had to be done by experts and if end users wanted any changes to be made, then they had to call the engineer. MRP II when run on these rudimentary systems was very slow and any slight changes that were made in the schedule required hours to be updated in the system. Typically, engineers allowed the systems to run overnight and this vastly reduced the integration and utility of the systems. People used huge spools of tape or cumbersome 5.5 inch floppy disks that were difficult to maintain. However, the expectations of people were lower a that time and today’s massive computing power where even a desktop runs on powerful processors were unknown and hence people thought this was the best the systems could manage. Manual data entry at multiple points was still in use and there were frequent mismatches between entries. Nevertheless, the system was much appreciated and gave the foundation for the current systems and MRP II delivered results (Monk, 2006).
ERP Products and Vendors
By the early 1970s, it was clear the MRP would be successful and that there was a huge industrial market that could make use of such applications. In the late 1960’s, it was not clear how computers could be used by the industry and while universities and other small firms did use computers for accounting work, they were for research. Computers were regarded as toys and not as productive tools (Waldner, 1992).
In 1972, five engineers from IBM in Germany who were working on developing ERP solutions realized that while ERP had a lot of potential, there was a major constraint in the manner that applications were created. These applications were stand alone solutions built by different vendors and the solutions from one department could not communicate with others. These engineers set up a company devoted to building integrated solutions and the company was called as ‘Systemanalyse und Programmentwicklung’ or System Analysis and Program Development. The company later shortened this long name to SAP. The company offered integrated solutions that covered all the domain areas of an organization and offered a centralized database for data retrieval and upload. They sold their first product, SAP R/1 or release one in 1973 and very quickly SAP became a well known name in the fledgling ERP industry. By 1979, they had an upgraded version called SAP/ R/2. Another ERP solutions provider called JD Edwards was set up in US by three staff from accounting firm. By 1977, they had their first product in the market and the application was meant for small and medium business market. All these developers used different versions of the IBM mainframes to run the applications. In 1975 a company called Lawson Software was launched and in 1977, another company called Software Development Laboratories was started and this would be later known as Oracle. All these companies offered integrated solutions that helped to integrate applications created by different vendors. In 1078, another person called JanBaan from Denmark started his company that provided integrated solutions for industries. He offered application suite solutions for the small to medium business. The ERP industry underwent many rapid changes as computers became more powerful and affordable and software vendors had their segments cut out. in 1987, Peoplesoft was launched and targeted the growing HRM market. Oracle developed expertise in database management and other ERP vendors increasingly used the Oracle database along with Sybase and other relational databases. By 1988, Oracle had started offering its software applications (osserpguru, 25 February 2009).
By the early 1990s, Windows operating system had got a good grip on the market and it was increasingly being used as the operating system of choice by developers since customers used this system on their desktops. The ERP market had grown very complex and there were a large number of companies that offered some packages, marketed as ERP systems. SAP had emerged as the clear market leader and Oracle had also made a mark by launching the Oracle Suite. By 2000, Oracle had consolidated its position as one of the leading vendors and it had acquired more than 50 companies and it could offer several products for niche market.
By early 2000, ERP was facing some resistance because of the high procurement and cost of ownership. ERP systems had become very complex, took a long time to implement and required intensive resources of men and materials. They also demanded that organizations had to change their work processes and systems. In the meantime, open source technology became more acceptable and Linux based systems, that were not proprietary were developed. Open Source ERP systems are increasingly available, developed by independent and small organizations, meant for the small business at very cost effective solutions. While a typical SAP package would cost about 300 million USD, these open source ERP systems can be bought for less than a few thousand dollars (osserpguru, 25 February 2009).
Enterprise Application Services
Enterprise Application Services is a new concept and business practice that has emerged from 2000 and it can be regarded as post ERP. In this practice, software service providers offer to carry out implementations of SAP, Oracle and other ERP applications. Implementation and deployment costs, when carried out by SAP technicians and engineers become very expensive. Therefore, these software service providers that include companies such as Infosys, Wipro, Patni and others would help in carrying out the deployment and implementation for clients. A majority of these companies are from India and the model followed is that of outsourcing where organizations in foreign countries buy applications such as SAP and give a contract to the service providers to implement the applications. The service provider has highly skilled and experienced people who work for far lower wages than a typical SAP employee (Infosys, 2009). Please refer to the above figure for details of EAS services.
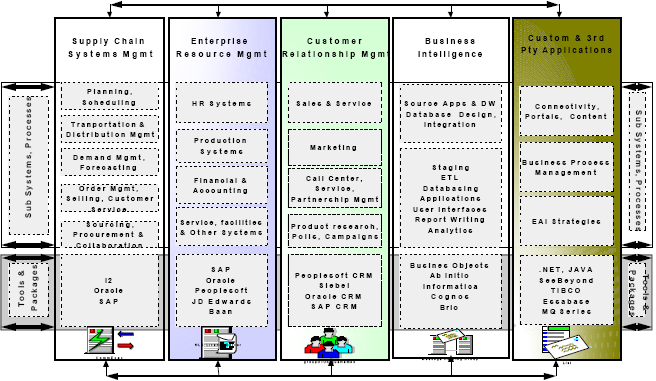
As seen in the above figure, some tools and packages that are sold by different vendors, along with some subsystems processes are integrated to form the EAS services. Also included as some other applications such as business intelligence tools, web interfaces, content delivery systems and many others. Most of the other applications are not made by companies such as SAP but when such applications are integrated into the system, they offer a unique competitive advantage. In addition, tools such as BPM are also integrated and a graphical user interface is provided that allows easy interactions. While earlier, even using SAP called for a good technical knowledge, EAS offers an easy and continence method for non-technical users to complete their tasks (Infosys, 2009).
ERP Practices
Organizations undertake investment in ERP or take up upgrade of existing ERP systems because ERP promises to deliver sizeable benefits over costs. However, benefits would be arrived at only if there is a clear understanding of what the ERP system is supposed to produce and more important, the organization is ready to change its inefficient systems and processes. The top management may have a casual attitude about the changes required in the business processes and the organizational changes required. In some cases, the project itself may be very ambitious with inadequate budget or lesser manpower devoted for the proposed implementation. However, with clearly defined objectives and by setting up priorities, successful ERP implementations can be carried out. The risk of project failure is attributed to many factors and some of them are commitment by senior management, faulty communication with end users, insufficient and improper end-user training, failure to obtain support from users are some of risk factors. Lack of top management support, project management capability, functional performance and scope along with ineffective mechanisms of change control processes are other major factors. On the other hand, Biehl (2007), has pointed out that among the top success factors are top management involvement, cross-functional team cooperation, business process management, effective communication, and the proper project vision. Technical issues are very important for ERP success and key issues are requirements definition, avoiding scope creep, systems design, business process modeling, selection of proper backbone and IT infrastructure and other details. Following figure gives details ERP focus areas.
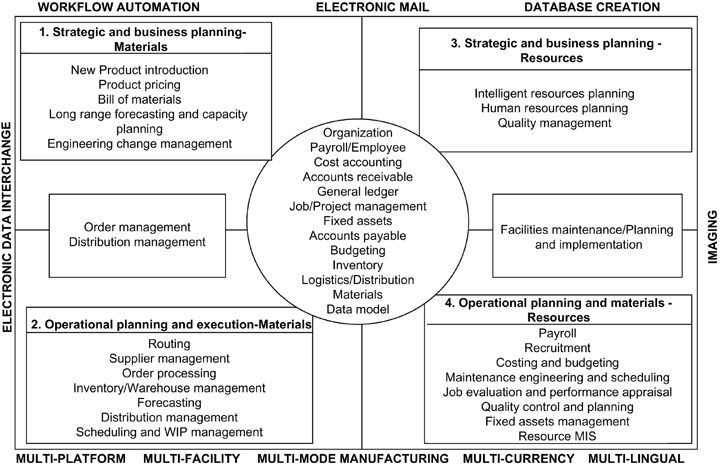
ERP Implementation
ERP implementation is relatively easy to begin with but difficult to sustain and complete in the long run. The process of ERP implementation has to be preceded by a lot of data collection that identifies business areas that need to be included, areas that have to be eliminated and ones that can be merged. A business process reengineering activity has to be undertaken to make the whole system efficient, eliminate duplication and wasteful process and after all such problems are addressed should an ERP system be considered. It must be understood that ERP is not just about software and hardware but there has to be a cultural change in the organization and that organizations have to prepare a change management process that prepares people as well as processes for the implementation. Following figure gives the four components of ERP implementation.
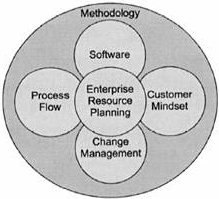
The four components in the ERP implementation methodology are the software component, process flow, customer mindset and the change management practice. These are briefly explained as below.
Software Component: This would include all the software applications and interfaces that users would be using and has the highest visibility. There would be some modules such as HRM, finance, manufacturing, supply chain, inventory and vendor management, materials masters, sales and forecasting and others.
Process Flow: The component sets the business rules about how information is accessed and flows in the system, how transactions are performed and trigger mechanisms for the information flow to be initiated.
Customer and employee Mindset: When an ERP system is implemented, the old and set ways in which people interacted with the organization would be different. This can increase resistance from customers and employees. Old employees who have been performing their duties in a certain manner may argue about the reason for the change and may even give facts about their efficiency and expertise in solving problems. They may even take pride in solving certain problems and are loathe seeing a computer take over their work. In some cases, people may even become redundant and may lose their jobs since ERP removes work duplication. Such problems have to be addressed by HR and the top management. Clear vision, transparency, training to handle new roles and jobs and removing resistance and negative feelings are very important if ERP has to become a success.
Change Management: ERP implementation would be preceded by changes in the manner that resources and business process are handled in an organization. There would be some level of resistance among users of the system and departments that where ERP is implemented. There would also be changes in the way that business functions such as drawing material, machining, scheduling, quantity of goods produced and so on. User resistance would come about since old methods would changed. As an example, the stores clerk while receiving goods would let them be unloaded, make a note of the quantity and other details in a small book and later in the day or even after a couple of days would sit and enter the details. With ERP systems, the stores clerk would have to immediately make entries in the stores ledger, as and when the material is received and this means that, he would be constantly on his toes and this would bring in some level of resistance. Business process changes would sometimes involve making changes in the machining sequence, eliminating some process or merging certain operations with others. This new set-up would make some workers redundant while making others work more and this would again bring resistance. All these problems have to be sorted out before implementing the ERP applications.
Implementation Approaches
Different approaches can be considered for the implementation. The methodologies are:
Big Bang Approach: In this method, in which all the modules are implemented at the same time. This would reduce the integration costs, reduce the manpower costs since experts would have to be hired for a much shorter duration and the tempo of the implementation can be maintained at a high level. This approach was used in the earlier era but there were many failures since there were a lot of variables that could not be controlled and many business processes that could not be changed. The approach is very rarely used nowadays.
Modular Approach: In this method, one module is implemented at a time and would cover one functional area. The approach is suited for organizations that do not have much sharing of processes or where common processes are lesser. Independent modules are implemented in each department such as purchase; finance or marketing and these modules can later be integrated across the organization to allow system wide integration. This method is more common since implementation teams can observe and see how a system performs before moving to another functionality.
Process Oriented Approach: In this approach, implementation is done on specific business process through the organization. Functionalities that are related to the process are implemented incrementally and eventually all process would be covered. The approach is suited for small to medium business that does not have very complex processes.
Steps in Implementation
ERP applications are very huge and complex and even though the basic applications are off the shelf products, there have to be some phases involved before the product can be used and the implementation called successful. The timeline for a typical ERP implementation is shown in the following figure.
Because of the complexity involved in ERP projects, in house expertise has to be often augmented by hiring external experts and consultants. The duration for the full implementation cycle would vary depending on the complexity of the project. A small project would take between 3 to 9 months while larger complex projects would take more than two years. Given the high employee turnover in the IT industry, the organization should prepare itself for the inevitable employee turnover. There should be extensive documentation along with knowledge transfer and handover procedures. This would help the organization to continue the project even when key personnel leave. Organizations may take the help of ERP vendors and even consulting companies who would provide services such as customization, consultation and support. In addition, there would be business analysts, program managers, change management specialists and data migration specialists.
The actual implementation process would have different phases and these are process preparation, configuration and the consulting services. These are briefly discussed as below.
Process Preparation: Over the years with sufficient experience and countless person years of learning, ERP vendors have created software packages that are centered around standard business processes and are built on best practices for the industry. While software vendors may use different interfaces and development process, all the packages have some elements of commonality, modules and would have standard interfaces. In many cases, organizations that want to implement ERP packages have to change their organization processes to meet the standard process defined in the ERP packages rather than the other way around. This is beneficial in many cases, since ERP packages have created these best practices after many years of implementation. If the organization processes are not mapped to these best practices before the implementation can start, then there are higher chances for failures. Hence, it is very important that before selecting the vendor there should be a proper business process analysis. The analysis should reveal details such as the operational processes; business drivers and a study should be done to match the standard features and modules of ERP vendors with these processes. Where required at a later stage, redesign can be taken up to provide for process congruence. The risk of business process mismatch can be reduced if there is a linking of the organizational strategy and every organizational process and if each process is analyzed for effectiveness in relation to the business capability. Knowing how current automation systems are working can also reduce mismatch. It should not be presumed that everything that the company has been doing is wrong or in error. In general organizations that are arranged into strategic business units with their revenue generation mechanism are more rigid and ERP implementation is more difficult here due to very complex and set processes and due to the political power that these units command. Typically, these units would be working to meet organization goals but would have their own business rules, authorization hierarchies, data semantics as well as decision centers. The process preparation phase would include activities such as requirements coordination, local change management, Master Data Management and other techniques. When a business process is modified, it can lead to either a loss of competitive advantage and the reverse is true in that it can give a competitive advantage.
Configuration: Configuring of the ERP system refers to understanding and balancing how the system has to work and how the organization wants it to work. Other than costs, the important factors to consider are the modules. Modules such as finance and accounts are common across almost all ERP modules. Modules such as HRM, sales and marketing, inventory, CRM, manufacturing, shipping and logistics may be required by companies who have discrete and sizeable departments in these functionalities. An organization in the service and support would not need materials and manufacturing modules but would need CRM and accounts. When more modules are selected, the integration benefits are much higher but the implementation costs and risks are also higher. Configuration tables are used by organizations to map how a specific feature of the system would interact with the other. When there is a fit between the module features offered and the system requirements, then the company negotiates with the ERP vendor for price and implementation contracts. When there is an obvious mismatch or a gap, then customization of the ERP package is required. If there is extensive customization, then the costs and time of implementation are bound to rise. Since customization requires considerable expense in the form of resources, ERP vendors provide some amount of customization flexibility with some inbuilt configuration options. Some amount of customization is provided in the form of setting up profit centers and cost centers, purchase approval and business rules and organization trees. There is also the facility to implement any proprietary process that would give an organization some competitive advantage. Configuration changes would involve entries in data tables that the software vendor would have supplied while customization would require some amount of coding and programming changes along with testing and impact analysis.
Data Migration: Among all the varied tasks during implementation, data migration from legacy systems to the new database is one of the most challenging aspects. Success of the implementation depends on how well the old data is migrated to the new system, integrity of the migrated data and the ease with which the data can be merged in the new database. Typically, migration of data is the last step undertaken before the go live stage. It should be understood that the old database from legacy systems would have some junk and corrupt data of obsolete parts and process that have been abandoned a long time back. This data serves as a historic archive and would not be in active use. If this old data and junk data is also migrated into the new system, then there is a problem of clogging of the new database tables, performance reduction, inability to clean the junk, confusion and consumption of vital disk space. The practice is typically called garbage in, garbage out and the resulting implementation would produce only junk. clearly defined strategy for data migration has to be adopted and a schematic is as shown below.
Strategy for migration of data needs to follow certain pre-defined steps. The first step is that the data that has to be migrated and discarded has to be identified and the steps for data migration of required data has to be initiated. Typically in the oracle applications, there are four data groups and the data has to be entered as per a certain order as each succeeding data set would use the preceding data as a reference. The first group is the configuration data that is used as the et up data. This is a one-time activity and is usually entered manually. Requirements for scalability should be considered and provision made if at a later stage more units are to be configured. Next is the sub master data and this would include rules and policies of transactions that an organization follows. Details such as delivery times, payment schedule, delivery methods and other have to be entered manually. Next is the master data list containing entities that are updated now and then and this includes data used for daily transactions. Typical master data includes masters for customers, products, tax, location, account masters and many others. Since these would expect to be updated regularly and they are in large volumes, different applications are used to transfer the masters into the new application. The last is the transaction data and is made up of day to day transactions of suppliers, customers, balances, account trials balances, assets and so on. These have a direct impact on the financial aspects of a company. Decision have to be taken to decide if open or closed transaction data have to be entered or only one of them.
The next step is to timing for data load. In standard cases, the set up data transfer is completed to allow the UAT tests to be performed in the same environment setting. However, set up data is a one time activity cannot be changed once it fed into the system so sufficient care has to be taken before such activities are conducted. Sub master data also faces the same problems since this is again a one-time entry. The master data and the transaction would be updated as and when required so an incremental loading process is followed. The third step to be followed is the deciding the templates that would be used. Templates are components that can be shared and employed for data migration from different accounts. The template should be created so that it can handle the primary key values such as customer and supplier ID and these values are mandatory and unique. The next type of data that the template should handle is the organization specific data such as delivery terms, payment terms and may not be mandatory for the application to be run. The next set is the unit specific data that would be modified for each unit.
The next step to be considered is the tools that would be used for migration of data into the database. For desktop integration, Data Loader can be utilized for manual entry of data. The tool is flexible and one can upload sub masters and masters and the user does not have to know detailed database programming for such tasks. SQL Loader can be used to load files such as.csv into the staging table and then further by using SQL scripts, the data can be moved to the base application. Oracle standard APIs that Oracle provides along with the database can be used to move standard data into the base app tables. Non-standard data can be loaded into the database by using custom built interfaces and custom-built forms can be used to load data. Migration related setups are the next step in data migration. For the system to run, there is a need to create some opening balance intake accounts. The sub modules feed such accounts with one part of the balance while the GL trial balance would give the balancing value. Account types included are receivables open intake account, payables open intake account, asset open intake accounts and others and this would depend on the fact of the transaction entered would be posted in the GL. Data archiving is an important aspect and would depend on different factors such as reporting requirements and information required for transaction reporting. As per the law for statutory requirements, organizations have to maintain their data for up to 7 years are more.
Problems with ERP
Rettig (2007) reports that there are some inherent problems with ERP systems and one of the main problems seems to be that they are vastly complex and require huge budgets to just keep them updated and running. Software programming techniques used in ERP systems would have intricate and complex hierarchies with a large number of business rules and conditions that allows the software to control transactions. While these systems can perform routine tasks, as the complexity of the requirement arises, the complexity of the software rises by four times, requiring massive programming with scenarios and simulations. With increase in complexity, the cost of customization also increases and when organizations want the system to perform other sets of operations, there is a massive coding and upgrade involved. When even a few lines of code are changed or a set of business rules are changed, because of the interlinkages, the impacts and risks in some other domains cannot be foreseen and the whole system has to be again tested. ERP systems are expensive and exceed the costs of many other account heads. In addition, there were the installation and implementation charges that are often many times more than the software cost itself. The author argues that while a typical package cost about 15 million USD, the implementation costs were more than a few hundred million since scores of consultants had to be hired. In addition, about 75% of the implementations were failures and ERP was regarded as a very expensive white elephant. While customizing the software or attempting was a problem, integrators often used patches to iron out any bugs that the system threw up. Any customizations that were made could be migrated with great difficulty when a new version or upgrade was made available and the whole system continued.
Rettig (2007) also reports issues related to managing legacy data. With multiple entries in different legacy systems, one never knows which is the latest data and the date stamp is not of much use since some departments attempt to change the system clock now and then. As a result during data migration, implementers find that more than a 100 entries would be pointing to the same product or transaction. Organizations then attempt to preserve the legacy system also so that the data is always available in case it is needed. Very few people have the courage or foolhardiness to scrap old systems or to format the hard disks of legacy systems. This adds to the organization burden of maintaining the integrity of these systems now and then.
Stijn (2001) has reported some problems that can arise out of wrong implementation of ERP systems. In many cases, existing and proven process that an organization has been using successfully has to be reengineered, just because the process does not fit into the best practice as required by the ERP application. In some cases, when a process is reengineered, it can lead to higher process time, lower quality and make the organization lose its competitive advantage. The main problem is that ERP systems are complex and have a rigid framework. With no flexibility, there is no possibility that the existing workflows and business processes can be accommodated. ERP presumes first and foremost that the organization is wrong and the errors have to be corrected. This increases the resistance among hardened industry professionals who do not accept the not so obvious benefits of the proposed change. Please refer to the following figure that gives some examples of problems and issues (Stijn, 2001).
The system would be more effective when there is data integrity and data is accurate. If the ERP system is forced to operate with junk and wrong data, then the results can never be relied on. Since the barrier for information flow is removed with ERP systems, there is less accountability and lines of responsibly become blurred. When organizations have very discrete divisions, forcing an ERP system on these divisions that have very little common features would not help anyone. The successful implementation of ERP depends on people and not just on software and hardware. Unfortunately, organizations cannot devote full time, qualified employees for this work and as a result, there are gaps and breaks one employees leave and another one joins.
ERP Implementation Barriers
Kim (2005) reports that factors for ERP impediments include some process and human factors. Some factors for impediment to successful implementations include cross-functional coordination, Human resources and capabilities management, systems development, ERP software configuration and features, change and project management techniques and organizational leadership. Following two figures give details of the impediments to ERP implementation.
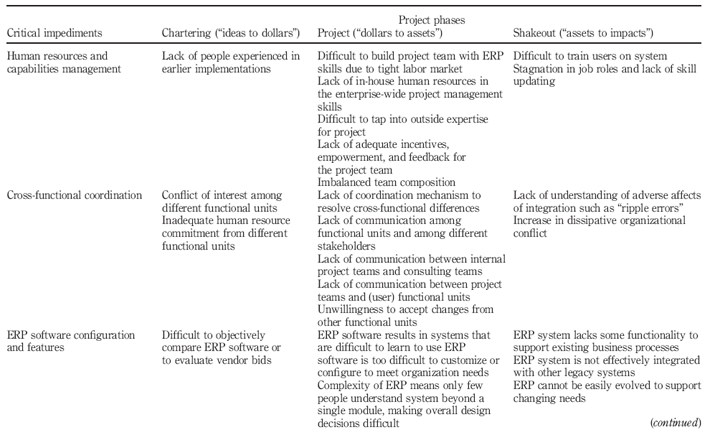
These are briefly explained as below.
Human resources and capabilities management: Organizations take to hiring outside consultants since the firms do not have sufficient in house experts. These consultants take up the implementation work and management of both in house and external personnel is important for the implementation to be successful. Failure to understand how the system works and lack of end user training is the major impediments.
Cross-functional coordination: Coordination between all the functional areas is important for ERP implementation. Lack of coordination is regarded as one of the main reasons for failure. To an extent coordination can be facilitated by steering committees and project management structures. Typically, senior management and department heads from corporate function along with end users have to be involved in the activities. If there is no coordination, then implementations are delayed and organizational conflicts can arise. To counter these problems, if piecemeal implementations are carried out, then the very purpose of having ERP is lost.
ERP software configuration and features: There is a limit to the extent that complex ERP packages can be configured to meet the exact organization needs. If too much customization is required, then there would be delays as well as cost increases. However, fine-tuning and modification of standard system can help in faster implementation of the system.
Systems development and project management: Implementation of ERP system is not only about software or hardware but also requires precise planning, strategic thinking along with negotiations and creating understanding with different divisions. A proper management structure along with methods is required. On an average, departments find that a package would lack about 20% of the required functionality thus developing the proper systems become important. Other factors increase complexity and these include, HR issues, various political factions in the organization, along with organizational inertia and resistance to change.
Change management: There has to be an effective change management strategy to remove the resistance among personnel. Change management has to be initiated along with business process re engineering. All IT changes would require a different attitude towards managing change in the organization. If there is no change management process and if ERP is thrust on the people, then ERP would not be successful and the organization would not be able to reap the benefits of the expensive installation.
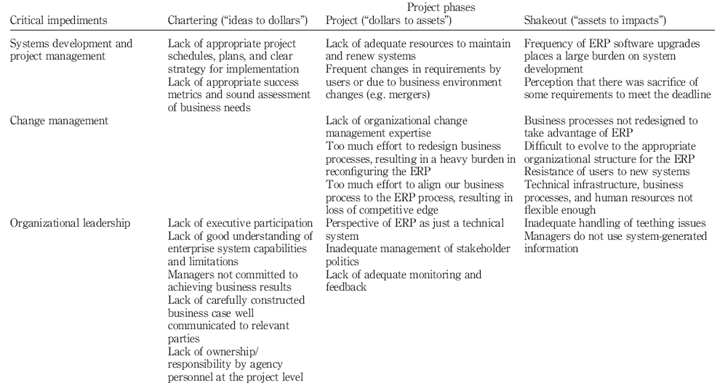
Organizational leadership: Top management support and leadership are very important to drive the initiative. The leadership should help to promote and develop the vision for the enterprise. Leaders have to take regular status reports, attend meetings and keep the team motivated and show that they want results. A lacklustre leadership who does not believe that any good would come out of the initiative plays a negative role and drives down the implementation.
Briggs (2007) provides some more insight into barriers for successful ERP implementation after he researched some organizations. According to the author, implementation problems could be spread into different areas such as functional coordination, project management, and change management. The critical impediments are given as below.
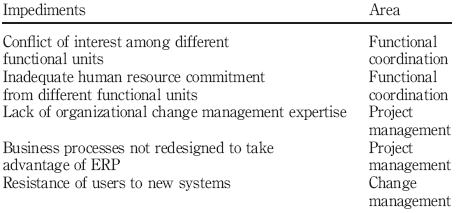
Wu (2009) researched the impediments to ERP implementations among organizations that were successful and not successful in implementing ERP solutions.
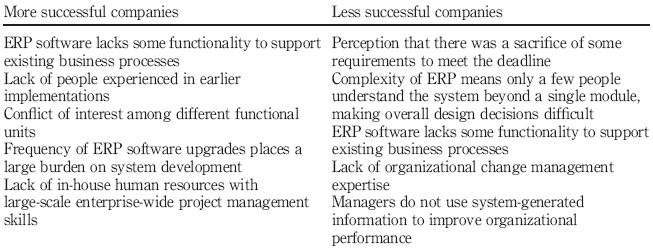
As seen in the above figure, organizations that were more successful in ERP implementation had a set of impediments that were different from less successful companies.
ERP effect on earnings
Brazel (2008) has performed a research to understand how the ERP implementation affects the extent of earnings amount and the release dates management, The study was done to investigate if after adoption of the systems, there was any quantifiable increase in the accruals of organizations. The author reports that by 1990, about 70 percent of firms placed in the Fortune 1000 listing had adopted ERP or that they were in the process of carrying out the implementations. Some hypothesis were formed to test if ERP implementation did influence the extent to which organizations managed their earnings and the timing of their earnings release dates. The authors obtained sample ERP system adoptions from proprietary dataset of license agreements from ERP vendors.
According to the research conducted by Brazel (2008), due to market incentives, enhanced access for managers to accounting information and reduced audit and control quality that follows after ERP adoption, the earnings management showed an increase after adoption. Certain levels of increase inefficiencies were promoted by ERP systems and this lead to a reducing in the reporting cycle and allowed the release of earnings to the market. The study reported that after ERP adoptions, the amount of earnings management showed an increase. The absolute value of accruals reported in different financial statements rose after the system was installed. There was also a positive relation between the earnings and the number of modules that were implemented. With ERP systems, financial data can be quickly accessed and this reduces the reporting lags when positive news has to be released to the market.
ERP Valuation and Investment approach
Wu (2008) has analyzed the investment risks in ERP implementations and the author argues that firms are subject to investment risks and this is apparent in the high failure rate of ERP projects. The risks could be divided into internal and external risks. Internal risks include marketing risks, regulation risks, unpredictable risks as well as agent risks that could be obtained from uncertainties in demand and supply, deregulations implemented by government or the emergence of disruptive technologies that are cheaper and better. The external risks include technology risks, resource and management risks and risks from implementations and these risks are formed dir to uncertainties that may occur because of long term investment capacity of the firm. While risk mitigation techniques try to foresee such events and set plans in motion, such methods are limited in their effectiveness.
Wu (2008) reports that given the high cost of ERP packages and implementation costs, organizations can use two strategies for funding and investment. The first includes buying the full and integrated ERP system from software vendors and deciding on the modules that are to be implemented. The next step is to create a rollout plan that would include activities such as process analysis, design, implementation, system configuration, software component installation, customizations, development, training and so on. The second strategy is to select the minimal and basic configuration that would provide solutions for the important functional departments. Once this is done, then the system capabilities can be enhanced and other application components can be added for use by other departments, design and develop the interface software and so on. Given the underlying risks of the project, it would seem that organizations can delay the investment and wait for a certain time before making the buy decision. Such a strategy can be adopted by organizations that are not in a great hurry to adopt ERP and who could wait for more advanced technologies that are economical, to emerge. This gives rise to the ERP value creation index – VCI that has nine drivers. The model is illustrated in the following figure.
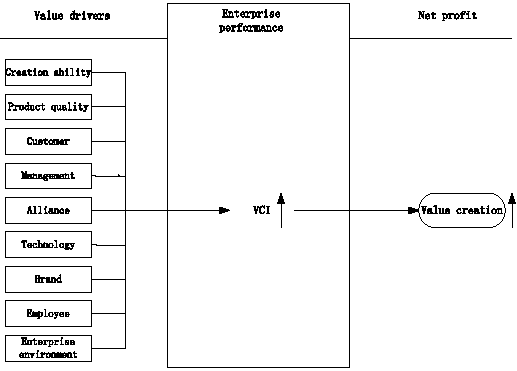
These value drivers can be assessed and quantified individually and assessed. The valuation can be done of the relative impact and this a weighting can be framed for each driver. The weighted sum of these driver values is obtained for the overall non financial performance of the VCI for an organization. The model is designed to show the overall effect of an enterprise value creation capacity as described by these drivers. When the VCI is high then the value creation capacity is higher.
ERP Architecture and Internals
Architecture of ERP systems often follows the proprietary systems developed by different software vendors. These vendors suggest different configurations based on the client requirements, modules required, industry sector and other factors. A generic discussion on the architecture used is given in this section. While some systems are designed to work on dedicated company Intranets, the current trend is to web enable the system and hence web service architecture with web enabled systems are in more common use.
Models of Architecture
W3C working group has recommended number of architecture models and these are policy model, service oriented model, resource oriented model and the message-oriented model. These are briefly discussed as below.
Message Oriented Model: This model gives importance to the messages that are relayed in the system. The focus is on the message structure and transport and the action required by the message. There is no significance attached to the importance of reason for the message. The model is as illustrated below.
While the model does not give importance to the semantics of the messages or how the content is related, the focus is on processing the messages and structure of the messages. The model attempts to focus on any relationship that is formed between the receiver and sender of the message.
Service Oriented Model: The service oriented model attempts to give importance on the service and action. It gives importance to completing the relation between the service and the agent. While the model uses the MOM, the focus is on actions required to be carried out rather than messages transportation. Please refer to the following figure.
Actions are performed by the agent in the form of rendering a service when a message is received by the agent.
Resource Oriented Model: The Resource Oriented Model gives importance that deals with resources and these are basic concepts and represent entities that can be consumed or that would provide service to meet the objectives. The model gives a focus to the important features of resources that would be required for the role of the resource and its context. Issues such as resource ownership and policies related to the context of web services are important. Please refer to the following figure.
Policy Model: The policy model gives importance to policies aspect of the architecture and would also cover the quality of service and the security. Security relates to constraints and the constraint imposed on the behavior on accessing resources and the actions, Quality of service relates the expected and actual outcomes. Please refer to the following figure.
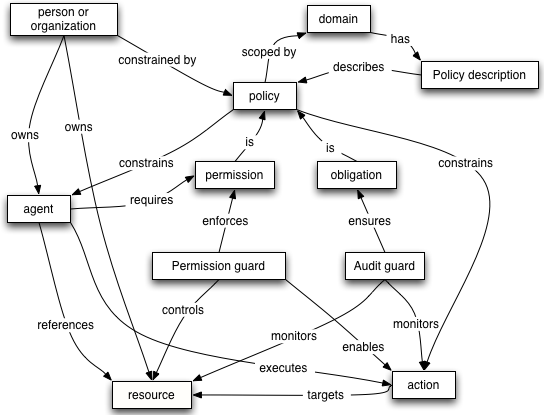
Web Services Architecture: The architecture for web services would have many layers and different technologies. Following figure illustrates the families of technology.
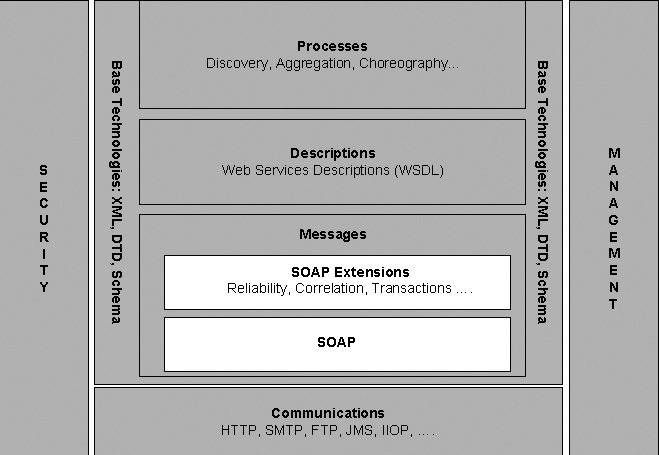
Microsoft Architecture
Microsoft offers its architecture for systems running the mySAP applications from the MS Project 2000 server. The company offers the ERP Connector solution starter that can be used for integration of the project server with ERP solutions.
There are two main components in the system. The connector uses a file drop folder that is built on the project server computer. XML data from the modules of mySAP is exported to the drop folder and XML requests are dropped to the folder. Security and data integrity can be achieved through the sending system. The mySAP ERP solution has an Export Service Component through which data is pushed into the solution rather than being pulled. By using a push system, control is maintained over the data. It is possible to plug in and integrate any module of external ERP solutions by using the ERP connector mechanism.
Model Driven Architecture PRAXIS Architecture
Illustration of the PRAXIS open source architecture for ERP systems is as shown below.
The system is designed for SMEs to allow them to integrate existing applications made up of legacy systems, older versions of ERP systems, CRM solutions and others. The connection is achieved by using XML and B2B interconnection standards that support development of different components, interoperability and allow existing systems to be modified as required. The system can be used for smaller enterprises that cannot procure expensive systems. SOAP is used as the base protocol. To achieve interoperability, other protocols that are needed are provided by means of layers on SOAP and the required transformation can be carried out as required.
Web Based ERP Architecture
Yenmez (2008) has proposed a cost effective web based ERP architecture that uses HTTP and browsers to allow users to connect to the ERP system. The architecture is illustrated as below.
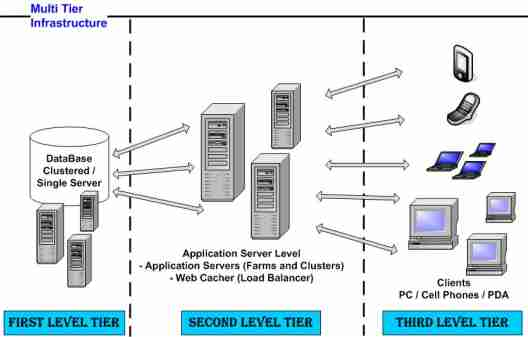
The first level tier is made of the database cluster and single server that serves requests sent by the second level tiers components. The second tier has the application server’s arms and clusters along with a web cache that acts as a load balancer. The third level is made of thin client user systems that would include PCs, handheld devices and even cellular phones.
Three tier Architecture
Dumbrava (2005) has proposed a three-tier architecture that client-server architecture to meet balance the requirements of thin clients as well as handling complexities of ERP systems. The system is distributed over the client machine, server machine and the database machine. In effect the architecture has extended the economical two-tier client/server applications to three-tier applications. An illustration of the system is shown below.
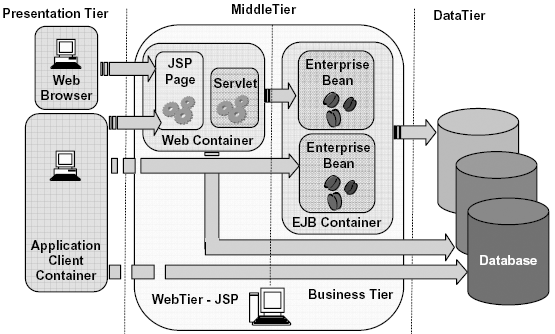
The ERP solution is created as a web based solution with server side application with partitions into three tiers. Each layer will look after a deployment feature and would have some components. The presentation tier has user interfaces that are used or user level interactions. It uses web-based deployment with JSP, HTML or Java Applets. Middle tier is made of the web tier with JSP and the business tier. This tier is the webserver component and would act as a web container with J2EE specifications protocols, there would also be components such as JSP pages, web event listeners, servlets and filters and it would handle HTTP requests that are sent by the web clients. It is also used for XML generation or creation of data in other formats that would be used by other applications.
SAP Architecture
SAP Web Application Server is used for implementing the server and client based solutions. Server applications such as portals and online shops can be created in an external tool or the integrated development environment. These contain HTML pages as well as web pages along with dynamic script code. The server can be used to run ABAP as well as Java programs. The server forms the application platform for the NetWeaver application of SAP. Please refer to the following figure.
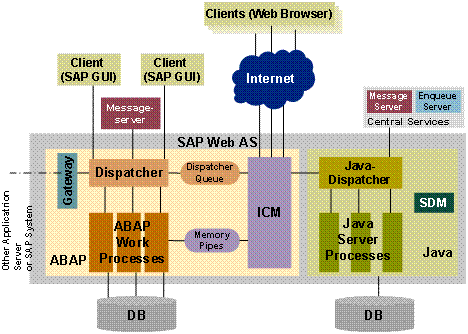
As seen in the above figure, some interlinked components make up the SAP server. The ICM – Internet Communication Manager connects to the Internet. It is used to process the client web request and also the server components and it supports protocols such as SMTP, HTTPS and HTTP. The server can play the role of a web server and the web client. The dispatcher is used to distribute the requests to the appropriate work processes and all the processes are engaged, then the requests are queued in the dispatcher queue. ABAP code of the application is executed by the ABAP work process and the SAP Gateway is used to initiate the RFC interface between the SAP instances in the SAP system and also beyond the system boundaries. The message server is used to exchange messages and also to perform load balancing actions in the SAP system. The java component there are three sub components, software development manager, server process and the java dispatcher (SAP WebAS, 2008).
Linux and ERP
Ogbuji (2009) has written about using Linux based ERP systems and the political struggle rather than the technical struggle that Linux faces. The author notes that Linux is very similar to Unix and could very well port with ERP systems but the problem comes when integration of legacy systems is to be undertaken. As it is, integration and data migration is a big struggle and the case becomes very complicated when additionally the integration has to be done for Linux operating systems. However, with rising software costs and increase in the number of systems and servers running on Linux, ERP systems based on Linux are becoming more popular. Following figure illustrates the architecture of the Linux system.
Ogbuji (2009) reports that more and more organizations are using Linux as the operating system in their servers. The shift has been mainly due to the large software acquisition costs for systems running on Linux. While it is always possible to integrate systems using Linux, the problem is that database manufacturers have tried to move away from using Linux. PeopleSoft and IBM WebSphere have both accepted Linux and in fact, PeopleSoft has launched about 170 of its offerings on the Linux platform. OpenPro, a leading developer of solutions for Linux platform has also launched an ERP system that is supposed to cost just 1000 USD. However, organizations have shown some resistance in accepting Linux systems and it only when vendors and buyers increase Linux applications, would the move to open source platforms such as Linux, Apache and Eclipse would be able to break the stranglehold of Windows systems.
ERP Vendors and Market Direction
Hamerman (2005) estimates that the ERP market is worth 21 billion USD out of which the license revenues is worth 6.2 billion USD. There are some large and small players with larger players such as Oracle, PeopleSoft, SAP, leading the market with implementations in large organizations. However, the lower end of the market is fragmented with a large number of smaller companies offering niche products. In addition, there are the emergence of freeware and low cost web based solutions that are very competitive in terms of price and that offer good functionalities. Following figure gives the functional footprints of ERP.
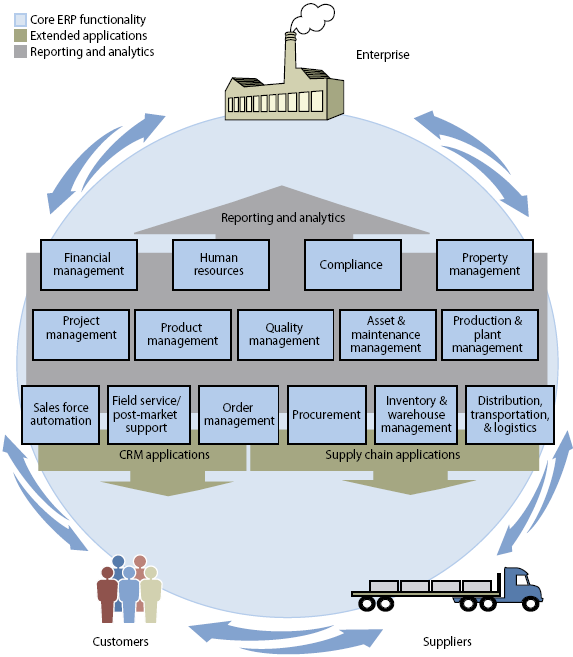
As seen in the above figure, ERP systems run the core operations of an organization and these include finance/accounting, production, inventory, order management, procurement, and HR management. However, it has been observed that implementations have often been fragmented and departmentalized, and different applications have had varying levels of success. Financial and HR applications have been the most successful in supporting the needs of most types of businesses, while companies have struggled to implement packages that support the core production and product/service delivery operations. As a result, ERP software providers have expanded their product footprints to address deeper industry-specific operational requirements as well as historic best-of-breed applications areas, such as customer relationship management (CRM) and supply chain/supplier relationship management – SCM/SRM. Investment in ERP and enterprise applications in general remains the top IT spending priority and a major driver for many large companies is regulatory compliance imperatives, such as Sarbanes-Oxley for public companies, BASEL II in the banking industry, and FDA Part 11 for biotechnology and pharmaceutical organizations. Regulatory compliance continues to catalyze some overdue systems consolidations and upgrades to achieve better controls. At the same time, companies recognize that support and integration costs may be reduced by consolidation to fewer systems and application instances. Following figure shows the market share in ‘000 USD of major ERP vendors. SAP has obtained a share and it is the largest vendor in terms of value of implementations and licenses sold. There was uncertainty in Oracle’s fortunes as it entered into prolonged negotiations with peoplesoft. SAP’s particularly strong growth in the US market where it has 38% license revenue growth on a constant currency basis and its license growth was also boosted by its program to convert customers over to the expanded mySAP ERP and mySAP Business Suite licensing program.
PeopleSoft’s acquisition of J.D. Edwards and Oracle’s acquisition of PeopleSoft has brought in new market dynamics to the ERP vendor landscape. While SAP is leading the market, other companies such as Oracle and Microsoft Business Solutions are far behind, with new competitors emerging through the consolidation. smaller players look to mergers and acquisitions to gain economies of scale. These mid market vendors have taken varied approaches to differentiate. The net result is a new breed of sizable competitors in the mid market. Lawson announced a merger with Intentia to broaden geographic and vertical presence and while both focus on the upper end of the mid market, Lawson has concentrated on services verticals in North America and Intentia on manufacturing verticals in Europe. With similar technology strategies around IBM WebSphere and J2EE, the merged company can potentially achieve product and market synergies within the next two to three years. SSA Global is among the top 5 ERP vendors with 661.7 million USD sales in 2004. It has acquired Max International, interBiz Product Group (from Computer Associates), Infinium Software, Ironside Technologies, Elevon, Baan, EXE Technologies, Inc., Arzoon, Inc., and Marcam. The ERP midmarket shows intense activity as different types of vendors converge on this less-mature segment. SAP and Oracle are refining packaging of existing products to enable rapid implementation and stronger vertical alignment, as well as expanding indirect sales channels. Microsoft Business Solutions, meanwhile, is leveraging its already extensive indirect model in an attempt to establish leadership in this segment. Competitive pressure is also coming from the lower end of the segment, with Sage Group, Epicor, and NetSuite adding scalability to appeal to larger accounts. Though traditional midsize ERP vendors are positioned to deliver, vendors that not only grow through acquisitions but also deliver integrated, process-centric solutions will survive. Newcomers will build strong partner networks. A highly leveraged, indirect channel is needed to reach the tens of thousands of midsize companies. Microsoft Business Solutions has built a vast indirect partner channel that has proven successful in this market. SAP and Oracle have a long way to go to build similar channel leverage, although SAP has made some good progress to date in channel development and has recently developed a more structured approach with an initiative called PartnerEdge. Incumbents will respond with various growth strategies. Incumbent midmarket ERP vendors have built barriers of entry through the investment in deep verticals and are approaching the market in three growth strategies. Organics are continuing to build capabilities internally. Aggregators are buying customer bases, re-branding, and focusing on maintenance revenue streams. Assimilators are acquiring competitors to develop breadth and depth and are focused on fully integrating product offerings (Hamerman, 2005).
With SAP and Oracle dominating in the ERP market. this has led to deeper specialization by smaller competitors in areas where the Big 2’s functional depth is not as extensive. Incumbent midmarket ERP vendors have built a loyal installed base through the investment in deep industry expertise that goes beyond broad industry classifications, such as manufacturing into micro verticals like food, medical products, and consumer electronics manufacturing. Though Oracle and SAP continue to seek deeper domain expertise, Oracle will continue to consider a strategy of acquisitions while SAP will be more inclined to develop in-house expertise. Manufacturing-focused vendors deliver deep domain expertise with micro-verticals and some vendors like Intentia have gone deep into areas with solutions for high fashion and footwear while building on their MRO strengths. QAD and Glovia International continue to expand their presence in automotive with OEM and tier N suppliers. While IFS has a strong solution in discrete and process manufacturing, it has been focused more on aerospace and defense, utilities, and enterprise asset management. Recent partner strategies announced by Microsoft
Business Solutions and SAP highlight their commitment to developing micro-verticals through their partners. Service-based industries represent a large opportunity and while a majority of ERP vendors built on their manufacturing roots, other vendors diversified and focused on service-based industries. As services businesses are outpacing manufacturers in overall growth in developed countries, vendors like Lawson and Epicor are stepping in to fill the void left by Oracle’s acquisition of PeopleSoft. Consistent traction in healthcare and local and state government and has recently seen an upturn in human resources application activity with PeopleSoft no longer a factor. Meanwhile, Epicor has proven its strengths in hospitality and distribution. PeopleSoft in the past had a strong higher education and federal and state government presence. Oracle’s recent acquisition of Retek improves its presence in retail, and it continues to be a strong competitor in government and service industries. Healthcare market continues to be untapped and areas of growth include healthcare, which is only served around the edges by ERP vendors. Larger ERP vendors will invest inpatient care systems via acquisition some time in the next three to five years. This lucrative opportunity has been underserved by the ERP vendors. The only ERP vendor to achieve significant success in healthcare is Lawson, whose solutions cover finance, HR, and materials management, but do not extend to the patient care side of the business. Following figure gives the market share of different segments of services, maintenance and license.
As seen in the above figure, all the three segments show an upward trend with maintenance receiving the highest growth and this is expected since the number of implemented systems has increased over the years. The technology stack is also centered around the following main technologies such as IBM Websphere, Microsoft.NET, SAP NetWeaver, Oracle Fusion and other systems. Out of them, IBM WebSphere appears to be used the most by the mid market segment of application developers.
ERP and e-businesses Competitive Advantages
Ash (2003) has pointed out that ERP offers some competitive advantages for organizations. The author has researched the use of e-business applications in enterprise resource planning based organizations. Multiple structured interviews were used to collect data on 11 established organizations from a diverse range of industries. The author reports early adopters of e-business show a trend towards cost reductions and administrative efficiencies from e-procurement and self-service applications used by customers and employees. More mature users focus on strategic advantage and generate this through an evolutionary model of organizational change. Till recently, ERP benefits were available only for traditional business enterprise. The Internet helps to extend the value proposition of ERP by breaking down institutional barriers and rendering cross-organizational boundaries almost obsolete. Internet technologies offer an ERP-based organization the opportunity to build interactive relationships with its business partners, by improved efficiencies and extended reach, at a very low cost. Organizations that fail to seize this opportunity become vulnerable as rivals establish themselves first in the electronic marketplace. They may eventually be forced to participate in Internet commerce by competitors, customers or consumers. The author reports that early adopters of e-business applications focused on improved efficiencies, realizing the benefits from procurement and self service applications. Statoil obtained savings of 30% from a 2 billion USD annual purchases bill and British Biotech has reduced the time to fill an order from ten to less than two days. As organizations mature in their use of e-technologies benefits arise from applications, which focus on improved services internally and externally such as UBS Banking with an intranet for the internal organization of 40,000 employees globally and Siemens with an expected 25% improvement in global sales from its e-shopping mall. Reports of benefits derived from such implementations provide mixed evidence of success and a lack of empirical data to support higher profitability and productivity claims. An e-business implementation is from the outset aimed at integrating business processes with external business partners and is built on and supported by the ERP foundation. The main focus of the implementation will therefore be the integration of cross-company value chains using e-business tools. An ERP implementation has a defined lifecycle, typically 12–24 months depending on the scope and other parameters. After the initial implementation, upgrade and functional enhancement projects follow in irregular intervals. e-Business implementations need to be significantly faster than initial ERP implementations. However, it can be expected that these activities will continue on an ongoing basis to accommodate changing relationships with business partners and enhance functional and technical scope of existing relationships. The importance of combining ERP packages with the Internet has a two-way benefit and return on investment. Once Internet technology is efficiently integrated into the internal operation, its effective use for external interactions becomes a natural and easy extension. Without the internal infrastructure, external interactions will always be strained and limited. The coupling of these technologies is seen as a shift from the traditional emphasis on transaction processing, integrated logistics and workflows to systems that support competencies for communications building, people networks and on-the-job learning.
Following figure illustrates how concepts of business relate to a set of B2B models that include a business to supplier (B2BS) and a B2E and business-to-corporate customer (B2BC). B2BS refers to a sub-set of B2B, where the organization’s employees have Web access to suppliers’ internal system such as materials catalogue and prices within the procurement agreements. B2E is viewed as Intranet access for all employees to their organization’s ERP data, from anywhere, anytime also called 24×7). It offers transparent Web-based access to important policy, manuals and procedure documents across all departments. B2BC refers to a sub-set of B2B where corporate customers and distributors have access to the organizations order system. B2BC is differentiated from B2C where the latter infers ‘direct’ online selling to end-consumers, who have no internal business systems.
To maximize the benefits of ERP, a recognition that the inspiration of employee self service applications comes from key users is required. The implementation requires a concerted corporate focus and a recognition to create the Intranet system as a learning system. Managers and IT staff must learn together to seek new business models. To minimize the barriers, the design of Intranet interface has to accommodate least trained employees and the design of the Web interface must enable users to be more efficient than other means. To realize the superior benefits, some critical factors were found to apply and they are continuous improvement of the quality of the web interface from the end-users perspective; formalizing an agreement with partners on a common IT platform, standardizing purchasing agreements with suppliers, and communicating the business strategy to employees. Please refer to the following figure that illustrates the relationships building cycle model from staged growth of e-business.
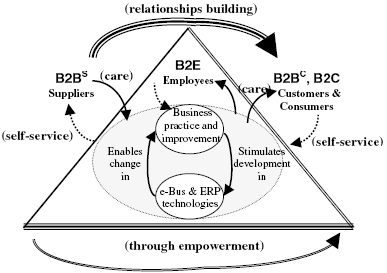
The model illustrates how changes in industry practices and e-ERP developments relate to B2E, B2C and the B2BS, B2BC models. It identifies that there is an accelerated symbiotic relationship between e-business technologies and business improvement caused by a shift in customer demand. The arrows connecting customers, employees, suppliers indicate the business interactions through self-service, care and empowerment towards extensive relationships building with multiple alliances. To realize the benefits from the symbiosis of e-ERP developments and business practice, organizations are optimizing B2B models to offer cheaper products with efficient service by utilizing customer self-service in B2BC, and customer self-service in B2C. They also procure materials cheaper through e-procurement agreements by utilizing employee self-service in B2BS optimize both B2BS and B2BC for customized service by utilizing employee and supplier empowerment in B2E. Firms also generate effective alliances through B2E, B2C, B2BC and B2BS with all players in the e-ERP environment.
ERP Cultural Perspectives
Boersma (2005) comments that in the early 1990s, when many firms embraced ERP, it was regarded and welcomed as a cure-all for many major organizational problems. ERP promised significant increases in management control, competitive advantage, reductions in the costs of business operations and flexibility in production and distribution processes. While these advantages are still the primary objectives of ERP, they are nowadays no longer naively presented as relatively simple and self-evident outcomes of a technological fix. Instead, ERP itself is presented as problematic, laying heavy burdens on organizations. This redefinition of ERP is informed by alarming stories about chronically exceeded budgets and deadlines and serious disruptions of business processes because of ERP. In short, the image of ERP seems to have changed from a highly promising into a highly demanding technology. ERP systems are complex and dispersed within and between organizations. In a sense these systems are elusive as they are in constant flux and to be found everywhere and nowhere. Those involved in the production of ERP will, depending on their position in the organization, have quite different views of and experiences with ERP. Individual or group definitions of ERP will vary according to their “awareness context”. There are three perspectives of ERP and they are constitution of ERP, ERP as a condition of organizations and the unintended consequences of ERP.
The constitution of ERP refers to the material, time-spatial appearance of ERP and it concerns the artifacts and persons ERP systems are made of, including scanners, PCs, cables, mainframes, software packages such as SAP, Peoplesoft, Baan, Oracle or JD Edwards, interfaces, reports and ERP consultants, programmers and operators. The ensemble of ERP components can probably never be grasped as a whole, but each individual that has to do with ERP will in one way or another interact with at least some parts of it. The constituent parts themselves as a rule already represent complex technologies of which in everyday working routines and specific incidents only certain aspects will be considered relevant for ERP. For instance, a PC used for the input of (Beck, 2002) reports that ERP data can perhaps also be used for e-mail and surfing the Internet. Just like the Internet, the virtual character of ERP as a whole may obscure its physical foundations. Therefore, a cultural study of ERP should devote serious attention to the material and geographical aspects of these systems. Moreover, anthropological conceptions of organizational culture usually not only refer to values and rules but also to material artifacts, which increasingly consist of ICT equipment. Artifacts are endowed with symbolic meaning. This makes the attribution of symbolic meanings crucial for conceptualizing ERP in terms of its constitution. ERP as a condition of organizations refers to the functional integration of subsystems by ERP. It concerns the infrastructure that results from the connections, laid by ERP, between various organizational networks, in particular functional divisions within organizations such as finance, marketing, procurement, warehousing, human and material resources planning and between organizations such as various suppliers and customers. Indeed, within the history of ICT systems ERP is generally considered and defined based on its capacity to integrate formerly segregated ICT systems. In this respect ERP represents a new phase in the informatization of organizations. Technological systems do not simply comprise physical artifacts, but involve heterogeneous interactions between organizations, sciences, markets and state regulations.
Chadhar (2004) reports that ERP systems may contribute to globalization in two ways. First, as a software product they may lead to the proliferation of standardized business solutions based on the supposed best practices, usually based on Western capitalistic enterprises), more or less similar to the process of “McDonaldization”. This raises questions about the displacement and rearrangement of former localized business practices, identities and labor markets. In addition, the standardization can make it relatively easy to move business units towards the most profitable regions, for instance those with relatively high levels of education or relatively low wages. This may influence local business networks and communities. However, to what extent ERP leads to the transformation of historically grown business practices, or elicits local responses, will also depend on the power relations involved. In this respect scholars have argued that globalization in many cases can better be understood in terms of “glocalization”. Schein (1992) argues that the concept of glocalization challenges the widespread view that globalization and localization are separate and opposite ways of thinking. Second, the backbone of business processes ERP systems may contribute to the coordination of businesses on a transnational level. After all, the main managerial objective behind ERP is to enhance control over processes within separate user organizations. However, in the context of globalization it remains to be seen to what extent managerial control over the implementation of ERP and global business processes can be realized. The relative autonomy of modern science and technology produces all kinds of uncontrollable risks and side effects. The awareness of these risks strengthens the “risk society”, which is marked by a reflexive attitude towards the unintended consequences of business strategies and market mechanisms. The acknowledgment of risks may in turn change the conditions of their existence.
Hanseth (2001) argues that the dynamics of the risk society apply to ERP systems. Increasing risk means decreasing control. The risks increase as ERP affects everybody and everything in and around a corporation. In addition, modern corporations also get more integrated with their environment that includes customers, suppliers, partners, stock markets, suggesting that such companies are affected more by events taking place in other companies. The author points out that in their study of a global Norwegian oil company, the introduction of ERP has led to outcomes that are the opposite to the intended increase in managerial control. They suggest that ERP in the context of a global enterprise can be characterized as a runaway device, which behaves in unforeseen, erratic ways. Although they can be counter-productive, these erratic effects are not necessarily negative. For instance, the re-engineering of business processes within the oil company appeared to be “self-reinforcing” – integration generating more integration – as a side effect of the ERP implementation. In this case ERP had similar unexpected consequences for other IT systems, like the hardware infrastructure and the use of Lotus Notes software. In particular, the introduction of Lotus Notes significantly improved the necessary collaboration throughout the company, which also affected the corporate culture.
ERP Systems Today
Djuric (2008) has researched the latest ERP trends and directions and the trend is towards adopting lean systems where the burden of costs are substantially reduced and the size and time for implementation also are reduced. There is an increasing demand and outcry to rationalize the costs of implementation, both in terms of software costs and the cost of employees. Large organizations that have already implemented ERP systems from SAP and Oracle are forced to use their existing systems, though they incur high maintenance and upgrade costs. Such organizations simply cannot afford to shut down their systems and move to a new architecture. The author argues that in some cases, the ERP systems that were initially implemented in the early 1900’s have themselves become legacy systems; massive, cumbersome that takes ages to retrieve information. The centralized architecture they used when high speed computing and network connectivity was not available means that data is stored on a central server and then information is relayed around to different nodes. There is very little they can do about such systems as the replacement costs would be impossible to handle. This is not to say that these systems are obsolete but just that the method of archival and retrieval seems very long and unwieldy.
McLaughlin (2007) notes that there is an increasing move by new companies to adopt open ERP systems that are light on costs, give only modules that are required and that can be implemented without too much changes in the organization structure. According to the author, many new open source ERP product suites such as OpenBravo, Compiere, Thingamy and others. The author notes that some advantages that open source enjoys are the vast amount of learning available from legacy ERP systems such as SAP and Oracle. These companies have an established set of best practices that can be easily adopted by small ERP vendors to build customized solutions at a fraction of the cost. Small to medium sized companies that may require ERP systems for automation, sales handling, invoicing, billing, HR solutions and even CRM finds these products appealing. The level of customization and further coding required is also very low and in effect, ERP solutions can be procured and consumed as a ready to use product with the least amount of extra efforts required. Following figure illustrates the trend of current ERP systems. The focus is on controlling spending and rationalization of costs. There is a move to consolidate large and monolithic enterprise systems and to build flexible solutions architecture. This trend is evident in hardware products, databases, middleware, web based applications and other elements of enterprise systems. The trend is to build as the needs arise and with scalable architecture, this is feasible. To start with, an organization would have smaller enterprise systems and as the organization becomes bigger or as more departments need to be brought in, other modules are integrated. While this concept was practiced in legacy ERP systems even earlier, the whole system had hidden coding and in effect, the whole redundant system was bought by a customer. While framing the requirement analysis, the possibility that future modules would be required was always understood and part of the coding was devoted to large access routings of non-existent modules.
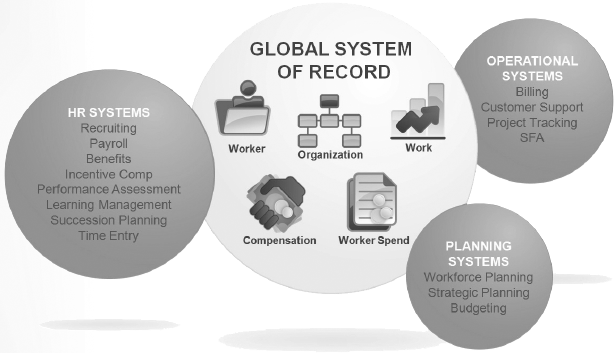
Large global enterprises that have global enterprise systems would have some localization. It would be observed that for example, the HRM solution would have widely varying local requirements for salary and wages, benefits and leave. A major issue that legacy ERP systems have is that the earlier systems were designed for the business practices that were prevalent in the bygone days and the systems do not manage the current systems of business process management. Some examples are HCM, performance management, e Learning, agile systems, reengineering, workflow management and so on. Older systems were designed for back end users who would be entering values, updates and records into the systems while some managers would use commands and menus to make projections and plan the activities. In the current business scenario, this is not the case and users want hands on windows GUI type of interface that allows manipulation of data. To provide extra functionality for users in different locations, management implemented local copies of their “enterprise” system. Since there was a lack of focus on new talent-management functionality, they integrated the best solutions of the ever expanding user population and attempted to use enterprise portals, integration to third party business intelligence. As a result, there was multiple occurrence of highly monolithic applications with bolt-on integration. As a result, this has forced IT managers to raise questions of minimizing costs and complexity of the environment and how to move to an environment that would allow and not inhibit continuous business optimization.
Next generation of products that appear would be able to offer flexible data models for the main business objects that are maintained by that application; role based security for access to application data transactions and reports; configurable workflow. It must be noted that core functionality can also be formed from low level services over the data model and then combined with generic services from a BPM platform. However, this process is very complicated. The latest trend is to create applications that are focused, globally relevant and built for integration. The focus will be more on conducting a thorough job of modeling the key business objects and not a casual modeling of the entire business. Instead of one data model for the full business and one set of fixed business process definitions, the next generation cores would give importance on the relevance for the customers products and services.
Best Practices for ERP
Senior management with a vision for ERP implementation with supporting goals and aims that are based on improving specific capabilities will achieve success in implementation. For IT implementation, leadership must extend the essential high level support and backup that protects funding and removes organizational roadblocks. In some IT implementations, the use of SAP experts to advise and assist has been encouraged and allowed, and their involvement helped avoid many typical implementation pitfalls in key areas (Tomb, 2006).
Organizational culture can affect the duration of an implementation. If the organizational culture supports individual competence and capability, problem solving in the field, and creativity in getting a job done, then implementations can take longer. The reason for this importance on individual competence – and in some cases, individual team competence – impedes progress. As a team or an individual tries to solve a problem independently, time is wasted, and when the call for help finally goes out, the problem is often greater than it first appeared (Tomb, 2006).
Process change must begin before the ERP implementation and continue throughout implementation as an integral part of configuration. All successful implementations begin with a business case that quantifies the precise areas for process improvement and then sets up a tracking mechanism to make certain quick wins are identified. In successful implementation, for example, the company standardized business processes, applications, and the data center before proceeding with the implementation (Tomb, 2006).
A life cycle approach to the solution will help remove organizational impediments, as the solution is allowed to evolve naturally. Implementation of SAP with a lifecycle approach from inception through support helps guarantee success. The most important phases with a life-cycle approach from inception of the life cycle from a value realization perspective are the initial phases requirements gathering/business case development and solution design (Tomb, 2006).
Before the implementation begins, it is important to remove organizational roadblocks such as a culture that is more adept at “flying under the radar” or an IT community content with the status quo. An Enterprise-wide PMO can help change culture by communicating the need for change from the start and continuing to update the organization on the types of change that are needed. The Enterprise PMO can coordinate across divisions and implementations. The PMO must support and manage the implementation of configurations already accomplished as well as those to come, providing the leadership and direction necessary to develop the business case and quantifying the specific process improvements that must be made. An Enterprise-wide PMO will help make the myriad of decisions necessary along the way and help organizations avoid past mistakes. The Enterprise-wide PMO will provide the streamlined governance necessary to rapidly respond to issues, document the response, and make certain that issues do not escalate beyond the boundaries of the area in which they are first observed. The PMO must have the responsibility and authority to make decisions that will be supported by the rest of the organization. The Enterprise-wide PMO can develop a single integrated work plan, critical-path focus, and better scope management. It can wield the decision-making power necessary to eliminate inefficient practices, and provide the impetus to rapidly respond to problems, document issues and their resolution, and monitor implementation progress (Tomb, 2006).
The decision-making governance process must be clearly defined and include all key stakeholders. The main objective is organizational acceptance. If the process owners are involved in decision-making and help design the goals for their process, they would have a much stronger stake in the project’s success. A well-constructed business case quantifying the specific process improvements necessary to achieve long-term goals is an important ingredient. When an organization starts with a specific goal, the program is far more likely to succeed. When a large corporate transformation is the ultimate goal, specific business-based objectives need to be cascaded to each of the ongoing implementations. In that way, the connection between these objectives and the broader goals supporting the overall transformation is most clearly articulated. All actions and decisions around organizational implementations should be measured by how they will help the company achieve its vision (Tomb, 2006).
Best practice indicates that implementations should be pursued according to an extremely aggressive implementation schedule that is accelerated at every opportunity. Such aggressive scheduling is important since it helps assure organizational buy in and acceptance. Problems that crop up are more likely to be solved in real time instead of going undetected as attention turns elsewhere. For implementations to work, the end user must know he will benefit from the specific capabilities of the solution from day one through training, for example, or a familiar user interface. Research has shown that implementations are far more likely to achieve their goals when end users are given the proper training to master the new solution at the start of the implementation. Those that involve the end user, even to the point of helping to design the goals for process improvement, have a greater chance of succeeding. Including end users from the beginning of the project provides the best approach to achieving their buy in and cooperation. This can be achieved in many ways. One very effective tactic is for senior management to designate end-user champions or “super-users” who can clearly articulate user needs, assist in blueprinting, and explain the benefits of the new system to peers (Tomb, 2006).
Solution vendors must be part of the process from the beginning and their capabilities leveraged to meet productive needs. While independent systems integrators are necessary, they are sometimes motivated by maximizing time and materials, which is not necessarily conducive to a quick and effective implementation. With SAP Consulting on board, specialists in SAP software provide thought leadership on product design and in developing an implementation plan that provides a precise road map for success, including the creation of interim milestones, and the potential for interim victories, which helps create virtuous process. A life-cycle approach to the solution will help remove organizational impediments, as the solution is allowed to evolve naturally. Implementation of SAP with a lifecycle approach from inception through support helps guarantee success. The most important phases with a life-cycle approach from inception of the life cycle from a value realization perspective are the initial phases requirements gathering/business case development and solution design (Tomb, 2006).
Regular strategic meetings should be held to review the achievement of benefits and other goals and ensure alignment between the end user and the implementation. All involved parties must be represented to understand what is required from end users, implementers, and software vendor. Once the goals for process improvement are articulated, they must be monitored and refined throughout the implementation. If one of the goals for the implementation is the elimination of legacy systems, it is imperative to plan for it via a systems realignment and closure process. Such a plan will help determine the most appropriate way to integrate the new system with the old, enhancing the capabilities of the legacy systems without destroying them (Tomb, 2006).
Successful implementations always include direct access to senior decision makers by IT project managers. Senior management commitment is the only thing that is universally understood and accepted as an imperative for successful IT implementations. Senior level management must have a clear understanding of the discipline required for an integrated system. Too often, senior executive leadership participates in the strategic discussions leading up to an implementation but do not keep the implementation of the new IT system on their radar screen throughout the project. Certainly, they know and care about the strategic goals for such systems. But once the decision to invest is made, too often they move on to other important problem, and hand over complete responsibility to the CIO or IT project manager. Senior executives must realize that a large ERP implementation is a major transformation project, which will change the way an organization thinks and acts about a certain process. As a result, they must involve a team of senior management, functional and technological experts to resolve issues in real time and make the right decisions along the way, always considering the long-term strategic impact. When senior executives recognize the difficulty of implementations, they provide the leadership and resources necessary to make them work (Tomb, 2006).
The learning curve is the life of the system; overtraining is impossible. Research and experience prove that training the users of the system before they must use it is essential. Each ERP implementation establishes a foundation for the future – and as such, changes and evolution are a natural offshoot. To be prepared for change, users must start with a solid understanding of how to use the new technology, and the organization must expect to provide top-notch training before, during, and after every implementation or upgrade. Using a proven implementation methodology is the best way to keep the project on track. A proven methodology is the wisest course of action, using tools and techniques that have demonstrated their effectiveness over countless other profitable implementations. The methodology should begin with a business case development and transitions into system design, and is carried out by experts with solid experience in large, complex projects (Tomb, 2006).
Global Strategic Management with ERP and SOA
Walters (2006) points out that strategic management covers some issues such as strategy formulation and implementation, strategic planning and decision processes, strategic control and reward systems, resource allocation, diversification and portfolio strategies and so on. There is a clear link in leveraging ERP and SOA assets and implementations so that these assets can be used to provide the required strategic management capability. The current business environment has become changed very much from the earlier era where only business acumen mattered in succeeding the business. With the advent of computers and advancement in ERP and SOA, these applications have become the business drivers in an increasingly competitive world. Organizations have shifted their strategy and business orientation as per the advances that have occurred over the decades. At the beginning when mainframes were common, ERP management strategies tended to be centralized around the big central mainframes with dumb terminals across the organizations. While thousands of employees would be completing assigned tasks, the actual work of creating and implementing the application along with a strategy formulation was left to only a few people who worked on complex mainframes. The business environment was not so dynamic and fast changing as it is today and hence slower systems that ran on mainframes were acceptable. From the 1980’s to 1990’s, microcomputers made rapid inroads and it was possible to have client side applications for ERP systems. This was a move away from the earlier server side applications and so now strategists could work away from the central servers, in the comfort o their cabins. With the advent of Internet in the 1990’s, the enterprise computing market situation changed and customers increasingly demanded a web interface that was both secure and which could provide the required access. Global strategies underwent a quick change and the market dynamics has perhaps changed forever. Following figure shows how strategy has evolved over the years.
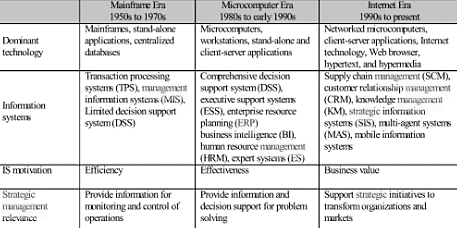
Global Strategies of ERP vendors
There are some major changes in the global strategies of companies that use enterprise wide applications. Some of the changes can be seen in the technology stack leverage and the move towards SOA. SAP has been leading this evolution on both fronts with its NetWeaver and enterprise services architecture initiatives. Microsoft and Oracle are dealing from a position of strength in the stack movement, but lag SAP in SOA development. All these days, the technology battle is Marketing Hype Component-based architectures with open connection tools are promising on the surface but still a long way from reality in packaged applications. The hype is about three years ahead of adoption and five years ahead of real business benefits. Adoption of SOA will evolve from the fringes to the application core, with most vendors moving through different strategies (Hamerman, 2005).
SOA is now being used mainly for integration and open integration standards, such as SOAP, etc., are being used to enable application integration. Vendors are simultaneously delivering on SOA to provide internal integration frameworks for acquisitions and take market share from EAI vendors like SeeBeyond, TIBCO, webMethods, and Vitria. Application components will become more granular; allowing reassembly and the SOA architecture is moving into the mainstream and will continue to be pervasive in new ERP systems in the next two to three years. Suites will become more componentized, allowing for deeper industry offerings and better business process support. SOA will lead to standardization of application parts and the evolution of component-based architectures will lead to greater use of standard definitions of functionality. This will make it easier to use components from different vendors without the complex integration that must be done today. As related Web services standards emerge, best-of-breed vendors like i2 will be able to deliver supply chain expertise on the.NET, WebSphere and NetWeaver frameworks, allowing for easier integration with ERP suites. Services and platform ecosystems will extend market influence and leading vendors such as SAP, Oracle, and Microsoft Business Solutions, will gain additional traction with ecosystems for services and platforms. SAP has the broadest ecosystems play, encompassing leading vendors ranging from consulting to software infrastructure and hardware platforms. Oracle and Microsoft are more self-reliant in terms of software infrastructure. Oracle, in particular, will need to amend its tendency toward isolation related to professional services and infrastructure (Hamerman, 2005).
Enterprises are attempting to reduce costs while creating greater value. For manufacturers in particular, SOA supports virtual manufacturing where many plants no longer have excess capacity for sudden increased demand. This has resulted in some manufacturing being done in contract facilities while maintaining control and status. For others, it has meant making changes and tracking the business in near real time. While consolidating systems to reduce IT costs is beneficial, better business process support produces far greater potential benefits to the business. Application integration enables composite applications, with integration at the user-interface level, at the data level, and the workflow level, enabling business processes to execute more effectively. SOA technology allows the assembly of composite applications to support this type of seamless process flow. This is driving the major ERP vendors to extend their products into deeper platform elements, using their technology or by standardizing on technology platform components from industry leaders (Hamerman, 2005).
ERP and SOA is a long-term investment of 10 to 20 years and as long as the vendor remains viable and supports the company’s growth and business evolution. Protect the investment by keeping current on the release path and by leveraging expanded functionality where appropriate. Minor upgrades near-term will enable more long-term flexibility to adopt, or not adopt, next-generation releases. Reassess the viability of second-tier and specialized vendors on an annual basis. As vendors invest heavily in new software versions based on SOA, disruption to customers is inevitable. Avoid big-bang upgrades and early adoption of next-generation products until product stability and clear business value are established. Sarbanes-Oxley compliance has provided more justification for ERP consolidation projects to achieve faster close and reporting cycles. Less-diversified businesses up to 5 billion USD can achieve single-instance ERP control and efficiency benefits. Diversified companies and large enterprises should focus consolidation efforts primarily on core financial management and human resources applications rather than the entire ERP suite. Even as the two ERP titans, SAP and Oracle, work to improve support for specific industries, specialized vendors continue to be viable choices for deep industry support in certain areas. Balance this depth of industry expertise against the possibility that these vendors will be slower to convert aging and proprietary architectures to more compatible, open architectures supporting SOA standards (Hamerman, 2005).
Shifting Paradigms in ERP/ SOA and RFID integration
Rego (2007) large organizations such as Wal-Mart that have billions of transactions and probably million of pallets of material being transported every yet, can obtain large savings in labor and increased data accuracy by using RFID technology. Driven backwards through supply chain mainly by large retailers, RFID is expected to become a universal and entrenched part of the physical buyer and seller transactions in sectors that have large volumes of transactions. The system of RFID devices is a part of the automated data collection – ADC tools that are seeing a lot of activity. Current users are increasing their use of the existing functionality and new users are obtaining more and more applications to meet business requirements, AD C and bar-coding tools use fixed and portable barcode scanners that read labels as and when the packed goods are passed through the production cycle. This allows the transactional product data to be wirelessly transmitted through a wireless network to radio antennae that seamlessly update the ERP system. With the introduction of RFID devices and SOA, the integration becomes very effective and simple since it is expected that the packaged products would travel hundreds of miles and carry the information along with them. With the introduction of SOA, the problem of disparate barcode readers, reading the RFID tags properly is mitigated, as SOA would have a common set of open source standards that can be used by any entity. When such systems become viable and are implemented widely, then the impact of this evolution on accounting and MIS would be very deep. There would be a demand for more strategic staff and lesser clerical staff and the inherent integration of transaction processes connected to ERP systems users have to understand at least one step before and one step after their job functions.
McKinsey’s 7-S Framework
McKinsey offers the McKinsey’s 7-S Model that can be used for analysis of seven different factors to draft a global strategy. This is a management and business analysis tool but it can also be used for ERP and SOA integration. Please refer to the following figure that illustrates the model (Jeffrey, 1996).
The seven critical factors are: service, structure, systems, style, skills, staff and shared values. Strategy is the central concept that is integrated with other factors and speaks of how the organization objectives would be achieved. The main part of the strategy is to find a set of core business activities that can be used to create value for customers. Structure refers to the method by which people are organized, there is coordination of tasks and how authority is shared and distributed. Systems refer to the IT systems that support internal business processes; reward system and performance measurement and reward for managing human capital; knowledge management systems to help distribute the best practices and other types of resource allocation systems, budgeting and other planning. Style refers to the approach used by the leaders and the operating culture of the organization; how employee would present themselves to vendors, suppliers and customers. Skills refer to what the agency can best do and it has excellent capacity and competency that are a part of the organization. Staff refers to the firms human resources and speak of how people are trained and developed, motivated and how their careers are managed. Shared values are the guiding concepts and principles that make up the firm, the aspirations, values and aspects that are beyond the nominal statements of corporate objectives (Jeffrey, 1996).
The Control Devolution and Globalization
Hanseth (2001) argues that the main objective behind the development and implementation of ERP, is to enhance control over processes within the organization. The objective can be achieved in different ways. Organization gains higher control over its IS application portfolio because a large number, in some case more than one hundred, separate systems and applications are replaced by an integrated one. Better governance is achieved through integration of the data created and used in different parts of the organization. An integrated system enhances the management governance capabilities. More effective and comprehensive control is obtained when the ERP system is implemented in parallel with a BPR project that integrates the different units; this can make it easier for management to streamline and centralize the whole organization. Control and governance are the main issues that drive any strategy to develop and use IT solutions. Beniger (1986) analyses the control revolution and describes all technologies as tools that help their adopters to improve their control over processes in nature and society. IT is regarded as the control technology par excellence, and the so-called IT or information revolution is a control revolution, or a revolution in terms of our control capabilities. Giddens (1999) describes the modern world being held captive on a careening juggernaut. He uses the juggernaut as an image to illustrate modernity as a “run-away engine” of enormous power. It is a runaway device in the sense that there can be some degree of collective steering, but the juggernaut also threatens to rush out of control. The juggernaut crushes those who resist it, and, while it sometimes seems to have a steady path, there are times when it veers away erratically in unforeseeable directions. The juggernaut of modernity is far from being monolithic and coherent. It is not an engine constructed as integrated machinery, but one in which there is a push and pull of tensions, contradictions, and different influences. ERPs are composite infrastructures that seem to behave erratically. Such behavior is shown to be caused by the relentless emergence of side effects from the intertwined dynamics of technology and globalization. Globalization is widely regarded as an important contemporary phenomenon and globalization and technology are mutually reinforcing drivers of change (Konsynski, 2003).
The role of IT as a key factor of change comes about because IT is often thought of as an opportunity to enhance control and coordination, while also opening access to new global markets and businesses. Firms operating in global markets are at a serious strategic disadvantage if they are unable to control their worldwide operations and manage them in a globally coordinated manner. Corporations should focus on closer coordination of increasingly complex and global processes. Bartlett (1998) speaks of four strategies that multinational corporation may choose when they become global. Firms follow a sequential path through these strategies: from multinational to international, then to global, and finally to transnational. A company pursuing a multinational strategy operates its foreign subsidiaries nearly autonomously, or in a loose federation to quickly sense and respond to diverse local needs and national opportunities. In the model, the value chains are duplicated across countries, and the local units have a strong degree of autonomy. The company pursuing an international strategy exploits the parent company’s knowledge through worldwide diffusion and adaptation. Rapid deployment of innovation is the prime operating principle. A company that is after a global strategy, closely coordinates worldwide activities through central control at headquarters benefiting from a standard product design, global scale manufacturing, and centralized control of worldwide operations. The firm bases management on a centralization of assets, resources, and responsibilities. Decisions are still decentralized but controlled by the headquarters and organized to achieve global efficiencies. These models and strategies focus on integration and control. Each strategy proceeds one step further along these dimensions than the previous one. Bartlett argues that companies should move beyond the global model and converge towards a common configuration because of the complex environment, technological change, and creation of large integrated markets. They call the new organizational solution the transnational model. This model combines the needs for integration and control, on the one hand, and flexibility and sensitivity towards local needs, on the other.
Ives (2009) finds four generic patterns that are seen as aligned with the strategies proposed by Bartlett and Ghoshal. One pattern is the independent global IT operation, in which the subsidiaries pursue independent systems initiative and common systems are the exception. Technology choices reflect the influence of local vendors and prevailing national communication standards, resulting in a lack of integration in both hardware and software. This pattern most closely relates to the multinational strategy, with the focus on local responsiveness and the application portfolio strongly oriented toward local requirements. Another pattern is the headquarters-driven global IT, where the firm imposes corporate-wide IT solutions on subsidiaries. Compelling business needs and the opportunity to harvest worldwide economies of scale propel the firm towards a global systems solution. This approach is aligned with a global strategy. Ives found that, without a strong global business need, the headquarters-driven global IT approach runs into problems.
Giddens (1999) has analyzed modernization by looking at the nature of modernity. The separation of time and space, which has in particular been possible through the invention of various technologies such as the clock, the standardization of time zones, calendars, and so on. These tools are essential to the coordination of activities across time and space. Powerful tools for coordination across time and space are preconditions for the rationalization of organizations and society, and the development of more powerful control technologies. The development of disembodying mechanisms that enable the “lifting out” of social activity from localized contexts, and the reorganization of social relations across time-space distances. There are two main disembodying mechanisms: symbolic tokens and expert systems. Giddens does not define symbolic tokens but presents a paradigm example. Other examples are other forms of money: stocks, bonds, funds, derivatives, futures, and so on. Symbolic tokens can also be interpreted as various forms of formalized information. Expert systems are systems of experts and expert knowledge. Expert knowledge within modernity develops under regimes underlining universality and objectivity. Expert, and scientific, knowledge should be built upon facts, theories, and laws that are universal and not linked to specific contexts or subjective judgments. The fact that expert knowledge is free of context implies, of course, that it can be transported anywhere and applied to anything. Both forms of disembodying mechanisms presume, as well as foster, time-space distantiation. The reflexive appropriation of knowledge. Modernity is constituted in and through reflexively applied knowledge. This means that social practices are constantly examined and reexamined in the light of incoming information about those very practices, thus constitutively altering their character. The production of systematic knowledge about social life becomes integral to systems reproduction, separating social life from the fixities of tradition. Globalization and modernization are closely related to integration and control. Giddens sees increased control as the key motivation behind modernization efforts and, further, integration as a key strategy to obtaining higher control. Time-space distantiation is largely about enabling the integration of process across time and space. The same is the case for the development of disembedding mechanisms. Common symbolic tokens and expert systems can be established for communities otherwise distinct and separate. By sharing disembedding mechanisms, communities become more equal; having more in common and becoming more integrated makes interaction and collaboration easier. Modernization and globalization are closely connected and Globalization, the most visible form of modernization, is the global level of modernization. Thus, modernity itself is inherently globalizing. The modernization and globalization processes Beck and Giddens describe are exactly what happen when a corporation moves from one of the organizational models to the next or from multinational to international to global.
The first general consequence of modernization and globalization is the emergence of what Beck (1992) calls “risk society.” He uses this term to argue that most characteristic of our contemporary society is the unpredictability of events and the increased number of risks with which we are confronted. The globalization of risk in the sense of its intensity, for example, threat of nuclear war. The globalization of risk in the sense of the expanding number of contingent events that affect everyone or at least large numbers of people on the planet, for example, changes in the global division of labor. Risk stems from the created environment, or socialized nature (the infusion of human knowledge into the material environment. The development of institutionalized risk environments affects the lives of millions for example, investment markets. All these risks affect global corporations and risks created in terms of a growing number of contingent events affecting more or less everybody. Contingent events include those taking place in one local context inside a corporation that affects everybody in it. The more a global company is integrated into one unit, the more this kind of risk arises. However, modern corporations also become integrated with their environment, customers, suppliers, partners in strategic alliances, stock markets, and so on. Such companies are strongly affected by events taking place either in other companies or other parts of their relevant environment. Increasing risk means decreasing control and in this respect, current modernization and globalization processes represent a break from earlier modernization. Traditionally, modernization implied more sophisticated control according to the tenets of the control revolution. More knowledge and better technology implied sharper and wider control. In the current era of modernity and globalization, however, more knowledge and improved control technologies may lead to more unpredictability, more uncertainty, and less controllability – in two words, more risk.
ERP and Strategic Enterprise Management – Case Study from Denmark
Rom (2006), speaks of integrated information systems to explain a system of integrated and real-time systems sharing common databases. These are also system of systems such as ERP systems that are transaction oriented and systems and analysis-oriented SEM systems. ERP systems have a modular design and are based on the client-server technology and they have a comprehensive functional. The systems are designed to interface with external systems and they usually have Data stored in a single database. By this strategy, redundancy is eliminated and there is no need to update data in different subsystems. In effect, ERP systems tend to focus on the tactical and operational level but it is often argued that they do not have extensive reporting and analysis functionalities at the strategic level. SEM systems operate at the strategic levels and they work in combination with a data warehouse and are focused on the tactical and strategic level. SEM is a system that is built on an ERP system and uses data warehousing tools. It also has a range of integrated applications like simulation and planning and would have an internal and an external focus. SEM is used for strategic decision-making. SEM systems providers are Oracle, SAP, Hyperion and others. A good example of SEM is SAP SEM and this is a suite with multiple modules of business consolidation, planning and simulation, strategy management, performance measurement and stakeholder relationship management. Business planning and simulation module extends help for budgeting and allows inputs from MS Excel and the UI is built around MS Excel. Strategy management module is a type of balanced scorecard module and allows drilling down and connecting to a strategy map.
SAP SEM does is just an application shell and not contain any data. A data warehouse such as SAP’s business information warehouse (SAP BW) is required for storage of data and all modules of the suite store data in the same database. SEM systems range is not restricted to suites supplied by the major ERP vendors and thus includes products from Cognos and QPR. These products are termed as best-of-breed – BoB products. These BoB products focus on supporting tasks such as activity-based costing, budgeting, performance management, consolidation, balanced scorecard, shareholder value management and others. BoB products are not a suite and do not have an integrated user interface but they are still the data used by other SEM applications. Consolidation occurs between BoB products and develops as completely integrated SEM suites (Rom, 2006).
ERP and SEM systems provide different business tasks, and the difference between those two kinds of systems must be known when finding how they affect the use of management accounting and control methods in practice or management accounting practices. The systems as such are not foreseen to directly change management accounting practices and the impact of ERP and SEM systems have to be understood as part of their ability to foster or inhibit change in management accounting. One of the main reasons to implement ERP system was because of the 2000 issue. Other reasons include new business processes development, accuracy and slowness of existing systems, introduction of euro currency, reduction in the number of different systems and so on. Therefore, firms were focusing mainly on the technical functionality of the ERP system and then on how the system supports different control and business decisions. Fahy (1999) reports that ERP systems gave many improvements in data gathering. However, the systems have had an ambiguous effect on strategic decision support systems used by organizations. Spreadsheets are still used in the companies to meet the flexible information needs. ERP systems are more suited for transaction processing and less for reporting and decision support (Rom, 2006).
Granlund (2002) conducted a study on impact of ERP systems on management accounting in ten Finnish companies. He reports that companies that have integrated the cost accounting with the ERP system and had transferred the costing principles from the existing system to the new system. The rest of the companies used spreadsheets or standalone software without formal integration with the ERP system, mainly because they could not invest the amount of time and effort necessary to implement even a plain vanilla solution of the ERP system. In eight out of ten of the cases, activity-based costing (ABC) was applied in parts of the organizations, but this was – with one exception – accomplished outside the ERP system. The main argument for not integrating ABC with the ERP system was that the existing version of the ERP system was considered too complex for that purpose.
An important conclusion is that ERP systems have only a limited impact on management accounting practices. ERP systems are good tools with regard to transaction processing, while reporting and decision-making are not well supported by the systems. Leading vendors such as SAP and Oracle argue that ERP systems are built for transactional management while SEM systems are built for management at a more strategic level. ERP systems have no important connection to analysis, reporting, budgeting, external, non-financial, ad hoc management accounting, and allocation of costs. However, a significant and positive relationship is found between ERP systems and data collection and organizational breadth of management accounting. It is confirmed that ERP systems are powerful tools with regard to transaction processing and integration of the organization, as data collection can be considered a proxy for transaction processing, and organizational breadth of management accounting is a proxy for integration. ERP systems are also related to exploitation of and support from US, which indicates that ERP systems have the capability of supporting current management accounting practices. This conclusion supports the claim that having an ERP system is still better than having no ERP system with regard to the support of the existing management accounting tasks (Rom, 2006).
SEM adopters are pleased than non-SEM adopters with the support of their HS to the reporting, budgeting, data collection, and analysis activities. Comprehensiveness of the SEM system has a considerably higher affiliation to utilization of and support from the HS than do ERP systems and a better match exists between SEM systems and management accounting than between EItP systems and management accounting. SEM systems are better than ERP systems at sustaining changes in reporting and analysis, non-financial, external and ad hoc management accounting, and allocation of costs. With the implementation of an SEM system, changes in management accounting practices and mainly for strategic enterprise management practices are anticipated. ERP and SEM systems are corresponding systems and ERP systems seem to be the main driver of change in data collection and management accounting, while SEM systems are the main drivers of change in reporting and analysis, budgeting, non-financial, external and ad hoc management accounting, and allocation of costs (Rom, 2006).
ERP and Competitive Advantage
Kalling (2003) speaks of two aspects of ERP, relation between ERP and competitive advantage and organizational processes that provide for ERP-based competitive advantage. There are questions if investments in ERP systems have yielded competitive advantage and while there is a shortage of empirical research, some references regard the issue of competitive advantage in a comparatively simple manner or simply overlook it. The Resource-Based View RBV gives a larger point of view because it gives importance to the sustainability of competitive advantage. One restraint is the comparative interest on the strategy content or the strategic resource attributes and not the strategy process or how resources turn into valuable and unique. In relation to IT, this stream of analysis relates to the second issue: not only is there lacking insight into the attributes of ERP resources that provide competitive advantage, there is also lacking insight into the processes that provide for ERP-based competitive advantage. The processes by which such advantages arrive, and how managers and users, manage the IT resource to become a source of competitive advantage, are still relatively difficult to understand. The main part of RBV is it assumes that “firms are heterogeneous and that resources are imperfectly mobile across firms within industries”. This places RBV from the industrial firm perspective where firm-external issues such as the five forces explain competitive advantage. As per RBV, organizations have competitive advantage when they have one or more resources that are fit, valuable, leveraged, unique, and costly to copy or substitute. The preliminary assumption is that the overarching process of creating competitive advantage involves attempts to meet these resource attributes. For the sake of simplicity, the outline of the discussion about such processes can be formed according to these tasks or sub-processes. The Idiosyncratic fit has to do with resource identification processes. The Value refers to resource development processes and resource leverage needs internal resource distribution. Uniqueness and costly imitation substitution, finally, require resource protection.
The capacity to find out the resources to invest in, its cost, is important in any procurement situation. It affects the price the resource obtains on the factor market, and if successful it allows for a quicker payback. The identification processes imply that the task is complex and related to the management of different constraints on ‘rationality.’ Resource investment decisions are difficult because of uncertainty about technology, markets, and firm capabilities. The consequence might be over-emphasis on past strategic actions and, ultimately, a lack of creativity. For competitors that approach the decision more ‘imaginatively,’ there might be opportunities for resource investments with first-mover advantages. The decision context is often multivariate, creating problems for decision-makers working under bounded rationality. There are two ways to find how a resource will affect competitiveness: correlation and causal reasoning. Correlation reasoning means learning through empirical association between variables, and depends on the notion of correlation. Causal reasoning is deductive and based on theory. Co relational reasoning is difficult due to the tendency to disregard minor correlations and non-linearity if there is no guiding theory or statistical analysis at hand. Conversely, when a priori theory exists, humans tend to overestimate the relation. Thus resource decisions can turn out as either ‘unrealistic’ or too conventional (Schoemaker, 1994)
A resource is considered as valuable if it results in the organization implementing strategies that increase revenue or reduce costs. It means that if the resource has been acquired, internalized, firms should develop it to enhance the effects it has on cost and quality features of the end product and service. Resources affect processes or the value chain and this in turn affects product and service features. This is fundamentally a knowledge issue and hence related to learning about resources and their fit with operations and strategy. From a managerial perspective, it involves the allocation and balancing of slack resources to projects. Knowledge infusion, continuous improvement, experimentation, creation of dynamic routines help development. Exploration and discovery are important and chances of learning from customers and alliance partners, should be availed. Organization mainly the composition of project groups has to be dealt with. Different types of knowledge comprehension and the ability to work as a team deftness are two main features that drive competence. Culture and beliefs are also important and Knowledge that has proved itself successful over the years can be difficult to challenge, due to unbridgeable perceptions of perfection. Stronger communication channels and internal marketing efforts, as well as clear structures, may help organizations overcome such obstacles. Development of resources, initiated when the resource is internalized, is fundamentally a learning issue requiring both organization and a coordinative management style (Mata, 2005).
A basic assumption among content-orientated IT and RBV proposes is that IT only creates sustained competitive advantage when it supports or is embedded with other valuable and unique firm resources. However, others claim that a unique system possibly created in-house as such can be a source of advantage. It is assumed that such processes are culturally, politically, cognitively constrained, and rarely the result of grand plans set by apex decision-makers. Instead, IT processes are bottom-up, incremental rather than radical, local rather than central, ad hoc rather than planned, and so forth. Local tinkering and trial-and-error learning, is often the antecedent to larger, leveraged IT projects, that develop in three ‘learning loops,’ as individual routines are improved, capabilities created, and strategic advantages generated through the use of IT. These processes are often bottom-up, without a clear strategic intent upfront. The role of top management is to empower and create slack for such local ventures. Uniqueness is created through the idiosyncratic embeddedness IT has with operational routines. The strategy-orientated ERP literature is focused on success factors in implementation and project phases, and the preceding strategy decision process and the succeeding ERP deployment are still relatively obscure. Process descriptions focus on alterations of the design, implementation, stabilization, continuous improvement, transformation stages and imply that problems include the underestimation of requirements on organization and business changes, failure to set objectives, and technical issues such as data clean-up and bug hunting. Frameworks are relatively close to technology and functional operation, not strategy or sustainability of advantages (Ross, 2004).
Kalling (2003) reports the findings of a case related on the development of an integrated ERP system within SCA Packaging (SCAP), a Swedish MNC supplying paper packaging via more than 200 plants across Europe. Data was gathered through interviews, archival research and by observation. Seventy-seven in-depth structured and unstructured interviews were conducted with 51 top managers, representatives for users and operational management, alliance partners, and consultants and vendors. Written sources include more than 2,500 pages of project documentation (project plans, evaluation reports, audits, specifications, selected sections of contracts, correspondence, board meeting minutes, annual reports, industry organization reports, personnel magazines, internal market analyses, and consultants’ reports, ranging from 1991 to 2001. Data gathering aimed to outline the longitudinal, historical sequence of incidents and events in terms of decisions, actions, and factors that were important in SCAP’s quest to build and use a system that would help them improve their performance and realize their strategic goals. This meant creating a chronological outline ranging from the very conceptualization of the idea to use ERP until the system was installed and employed. The theoretical constructs of Identification, Development, Protection, and Distribution were used as ‘sensitizing categories’. The process of building competitive advantage can be seen as holding four major tasks, or phases, i.e., identification, development, protection, and internal distribution. In relation to that, the case findings offer two observations that extend theory. The theory should include a fifth task – usage – to clarify managerial efforts post implementation.
ERP and Six Sigma Implementation Global Strategy
Hsieh (2007) speaks of ERP and Six Sigma implementation as a part of the global strategy that is aimed at reducing quality related problems and costs. The strategic importance of Six Sigma has also become the center of studies and some business executives regard it as a tool to improve competitive advantage. The expanded Six Sigma system known as Keki Bhote’s Proven System, can be used to help business change from quality excellence to total business excellence. The strategic value makes the Six Sigma methodology even more important, especially in the global environment. The Six Sigma approach refers to identifying known and not unknown entities about the various processes that a company uses upon to run its business and then measures of problem solving teams working on projects in targeted areas, to reduce the errors and rework within these processes, errors that cost money, time, opportunities, and customers. A successful Six Sigma project is not just about data tools and defect fixing but it is a “broad and comprehensive system for building and sustaining business performance, success, and leadership”. It has to be seen as a context within which the organization will be able to integrate many valuable but often disconnected management “best practices” and concepts, including systems thinking, continuous improvement, knowledge management, mass customization, and activity-based management. The importance of a Six Sigma initiative being part of an overall strategic vision by a business is crucial.
ERP and SOA help in realizing the goals of six sigma by providing an authentic direction on the customer supported by an manner that puts the customers’ requirements first, as well as by systems and strategies direct the business to the customer. Data, a management that uses facts, with effective measurement systems that follow results, process, input, and other predictive factors are followed. By using ERP, the process focus, management, and improvement as an engine for growth and success are yielded and Processes in Six Sigma are properly documented, communicated, measured, and refined on an ongoing basis. They are also designed or redesigned at intervals to stay current with customer and business needs. In addition, a proactive management that involves habits and practices that anticipate problems and changes, apply facts and data, and question assumptions about goals are important. The problem of boundary-less collaboration, with cooperation between internal groups and with customers, suppliers, and supply chain partners is mitigated. A drive for perfection, and yet a tolerance for failure, that gives people in a Six Sigma organization the freedom to test new approaches even while managing risks and learning from mistakes, thereby “raising the bar” of performance and customer satisfaction (Chowdhury, 2002).
Point-of-sale and data-gathering technologies such as scanners, smart cash registers, credit card systems, etc. have been around for almost two decades. However, they have been integrated recently into daily operations when ERP systems were used. Data from retail-store barcode scanners are used to feed information to automatic replenishment programs that send computerized reorder notices to product manufacturers. It is a waste when after huge investment in data warehouses where large volumes of raw facts are collected about customer transactions and behaviors, some companies do not use these resources properly. According to a survey where 50 U.S. companies were polled, some 72 percent said that as of 1999 they were not making use of the customer data provided by their transactional information system. By integrating these data warehouses to the ERP systems, the proper analysis and trend can be forecast and provide quick benefits to organizations. There are many IS/IT software solutions such as ERP that allow tracking progress and returning on Investment (ROI) of six sigma projects. Proper use of data mined from IS/IT within these projects brings opportunities for innovation and growth to light where they might have been missed before (Raisinghani, 2005).
ERP modules can be used for specific parts of an improvement project. This is a data driven, process approach commonly referred to as the DMAIC roadmap, which stands for define, measure, analyze, improve, and control. The sigma, or standard deviation, tells how much variability there is within a group of items. The more variation there is in a process, the bigger the standard deviation. The purpose of Six Sigma is to bring down deviation to obtain very small standard deviations so that almost all products or services meet or exceed customer. The ability to reduce the standard deviation in a process is the key to reducing the Cost of Poor Quality – COPQ and positively impacting customer satisfaction. The smaller the value of s in a data set, the greater is the “scapability” of the process. This may not seem intuitive until one realizes that “s capability” is defined in terms of “how many of ‘s” can be absorbed within a specified tolerance range of a performance measure. Sigma capability is also directly related to defect rates. A 4s capable process has 6,210 defects per million opportunities dpmo, a 5s capability is 233 dpmo, and a 6s capability is 3.4 dpmo. If a process is said to be operating at a Six Sigma level it means that there are only 3.4 defects per million opportunities in that process. Six Sigma is much more than a mathematical definition and is about producing better products and services faster and at a lower cost. The Six Sigma methodology uses statistical tools to identify the vital few factors that matter most for improving the quality of processes and generating bottom-line results. It consists of the following five phases: define, measure, analyze, improve and control (Lawton, 2004).
Define means that in this phase, the problem is identified and customer requirements are determined. The tools used for a top down look at the processes from a business perspective and the focus is on customers requirements and needs. Tools used here help to prioritize and focus on the areas where the greatest opportunities of improvement are available and each project should be very well defined. Tasks that are included in the phase are establishing a project charter that includes the business case, problem statement, project scope and constraints along with budget, assumptions, team guidelines and membership, project schedule, and identifying significant stakeholders. Customer, both internal and external are identified and details such as who uses the process, customer requirements in the form of a Voice of the Customer (VOC) exercise, output requirements, and service requirements are documented. ERP application includes all these tasks into one comprehensive study is known as Quality Function Deployment (QFD) or House of Quality. This is an iterative process for continually refining customer requirements to ever increasing levels of detail and specificity. QFD is very useful when determining what the customer requirements and priorities are and then flowing these requirements down to critical product, process, and control design parameters. The following set of cascading matrixes or Houses of Quality demonstrates the flow from customer expectations to supplying a finished product or service. Each house matrix shows the weighted relationships between requirements down the left side and the characteristics of each level of detail across the top. Each relationship is rated on a scale of 1 (weak), 3 (moderate), or 9 (strong). A blank represents no relationship at all (a zero rating). The results then become the prioritized CTCs that form the left side of the next matrix. Sources of data and information to start the QFD regarding customer expectations are typically gathered from: Targeted and multi-level interviews and surveys, Customer scorecards, Data warehousing and data mining. The cascading of customer requirements into design parameters for the product, process, and control function is the essence of QFD. QFD is the tool used to translate the Voice of the Customer into system design parameters. Most of the other IS/IT tools associated with this phase consist of worksheets and other computerized templates aimed at planning the project (Lawton, 2004).
- Measure is the phases in which the process and its defects are quantified.
- Analyze is the phases where data is statistically reviewed and the root causes of the problem are found.
- Improve is the phase in which the process is modified to remove the causes of defects.
- Control is the phase where the improved process is run in such a way that the defects do not recur.
SOA and ERP for small enterprises
Zdravković (2007) the small sector enterprise is more concerned about generating income than cost reduction activities. All planning activities are focused on the low margin and risk dominated business ventures and this approach means that the ICT technologies used are inefficient and ineffective and the technologies are implemented inefficiently. The author has presented a customized approach for the implementation of an integrated enterprise IS by employing a stepwise SOA and this is operated with the least threat to business continuity. The author reports that Start-up investment of small enterprises is used to fund activities such as market development; short-term business continuity management and all these activities are done with the lowest margin. The planning horizon is less since the investment is small and the production strategy is scaled down with short-term forecasts. In such a scenario, integrated enterprise IS, is not considered and a set of different applications that support separate business segments are used and there is the danger of data redundancy that would threaten the integrity of the enterprise. The strategy and reality of low margins drive the daily business and the main priority is to mitigate the immediate risks that all resources help to achieve the sales objectives. The focus is unfortunately not cost reduction which is the main goal in business IT systems. The workforce may be reduced but it is more flexible and can quickly adapt to business process re-engineering deliverables. In some cases, e-commerce practices and web-based marketing are used since they are not so demanding about investments and workforce and are not like the conventional sales activities. Small enterprises do not have an approach for strategic risk management approach and this is due to identification of short-term risk.
In large manufacturing and production environments, small changes in the actual and planned demand or supply can create high deviations because of the bullwhip effects. This effect cannot be made up without an extensive negative impact on customer loyalty or cost of manufacturing. Any change of success of local business environment that is brought in by market fluctuation would depend on an accurate and proper identification of the business process of the company. Any identification of the disruption in the business and feedback of the proposition is possible when accurate and qualified information is available. The author suggests the ERP systems can be used as the main tool for storage of data, management and delivery of the firm’s assets and these systems can be successful only if the quality of data is accurate planning and management of all enterprise departments – sales, purchase, supply and accounting, on basis of real-time generated, accurate views of business information. The existing ERP systems are due to vendors response for globalization processes and for hardening of the competitiveness as required in the system. The changeover of current ERP systems is divided into three ways, expansion of business processes that extend over the scope of individual enterprises; vertical specialization of ERP solutions in the industry and the introduction of modular and component based architecture. These three methods have brought in the move towards ERP II. ERP implementation in an organization would have to be synchronized and integrated with different business functions and the repositories of information. The process is complex and takes a lot of time and there are some stakeholders who would help to transform the business environment and appropriate ICT methods. In many cases, the transformation would have radical impacts in the manner that one enterprise would perform the functions. The costs of change management during ERP implementation can go up by 70% of the budget and it is difficult to plan and manage the budgets. The change management process of ERP implementation this becomes crucial. The important principles for ERP implementation are: Limited and managed change, Graduate and step-wise change, Homogenous system, Integration capacity and a Fast ROI. One of the main principles for business integration through ERP is managed and limited change and the selection of a limited number of actions that have a maximum impact on the business improvement, The principle if done by ascertaining key business processes that add maximum value to business deliverable in the context of revenue and profits. Following figure shows the transformation of a legacy IS into an ERP system.
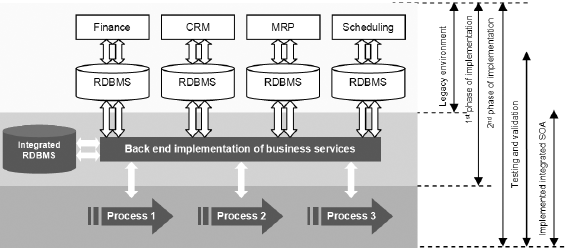
As seen in the figure, the gradual introduction of changes is brought in by a continuous preservation of integrity of the current information systems that are used by legacy applications and the functionality of the different client layers. During implementation, actual changes are created in different streams of development that are carried out at a hot site. The actions are, integration of repositories, back end implementation of layers with business services for their management and the implementation of front end layer for business services orchestration. Feasible alignment of SOA architecture with the approach in migration of legacy IT infrastructure can be done through implementation of specific design methodology. The methodology is executed iteratively, until the project objectives are achieved and it has a top-down feature with design development stages are shown below.
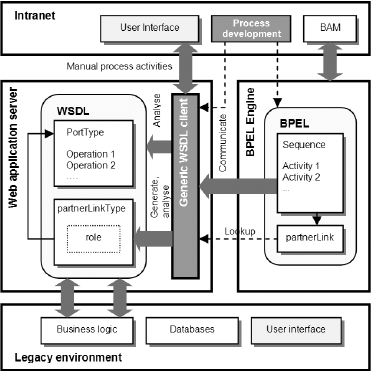
Research Findings
As a part of the research, a survey with 32 questions was used to elicit responses from the industry experts about their views on ERP and SOA. The survey was administered by email to experts and ERP practitioners, and 8 people responded by filling out the instrument and mailing it back. This chapter provides an analysis of the survey.
Design of the Questionnaire
The questions that have been included in the instrument were formulated after the extensive secondary research done in the previous chapters. Initially a much larger question bank was formed and these were later filtered to produce questions that were most relevant to the scope of the study. The survey instrument was sent to about 21-targeted personnel from different companies. Out of these, only 8 responded positively and were ready to spend the time and effort to reply to the questions. Though the survey covers only 8 respondents, the replies have been thoroughly analyzed and it is felt that the responses are a representation of the general trend.
Analysis Process
Very good amount of focused information was obtained from the survey responses. A few statistical methods were used to obtain proper results and they are: Correlation, Test of Proportions and Chi-Square analysis. The test of proportion and co-relation was mainly used to find appropriate conclusions from the survey. Both methods were used to produce the most meaningful results but since the sample size was small, the statistical methods could not be used in full. Analysis with the Chi-Square methods was used for certain questions where only a single answer was allowed from each company and this was different from the ‘Select all that applies’ question type and this method was used only for questions where there were two choices for answers.
Survey Analyses and Results
This section provides an analysis of the survey results for different questions. The questions have either been identified as per the groupings or as per the question numbers. Sample size for the survey is 8.
Question 1 to 3 – General Questions
Question 1 asked about the size of the company as specified by the number of employees. Six companies had 100 to 1000 employees while one each was for number of employees 1 to 100 and another was between 1000 to 10000 employees. Please refer to following graph.
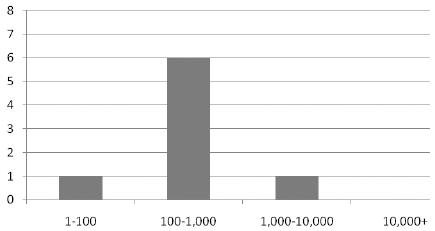
Question 2 asked about nature of the work and the type of manufacturing company. Multiple replies were given by some firms indicating that the firms had in effect different manufacturing environments. Please refer to the following graph.
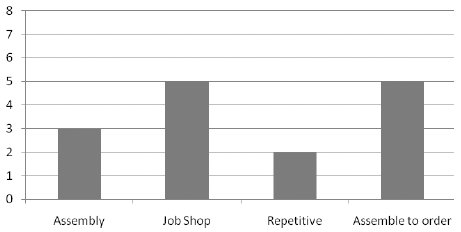
Question 3 asked about the nature of manufacturing environment. The replies show that the firms had a mix of build to stock and build to order environment. Please refer to the following graph.
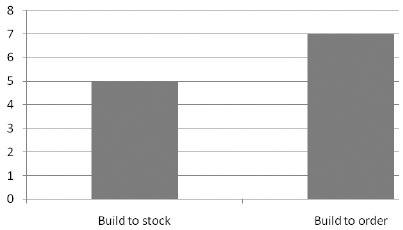
Question 4 Type of ERP Used
This question was to find out the software name if it was a packaged application developed by outside vendors or if it was a customized in house system. Out of the eight responders, four said that they used SAP, two indicated that they used Oracle, one said they used web based free ware solution while only one respondent said that they had developed the software application in house.
Questions 5 -7
Question 5 was formulated to understand how ERP concept was regarded as a part of the strategic plan of the company. The question also attempted to find if ERP was streamlined across the company through a centralized or decentralized effort. This was an important question since it attempted to find what the management felt about ERP as a strategic tool.
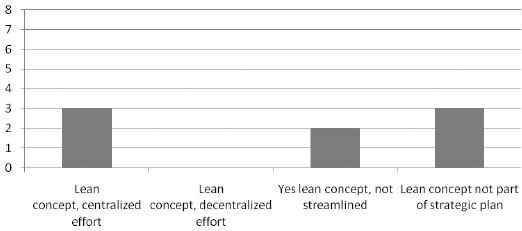
Question 6 was designed to find the approximate percentage of the companies that use ERP concepts. Majority of respondents had only 50% or less of the company departments may not be operating as effectively as possible.
Questions 8-9, on Employee Training on Lean Concepts
Question 8 was meant to find out departments that were provided training on ERP conversion. The results show that various departments have been trained on ERP. The majority of responses show that manufacturing departments, middle and department managers, and line supervisors receive the most training, whereas human resources, IT, accounting, and maintenance receive the least. This is mainly because ERP is regarded as something that manufacturing people should practice and that majority of the activities are carried out by shop floor people. However, it must be noted that ERP is not restricted to only manufacturing but all other departments are involved. Please refer to the following figure.
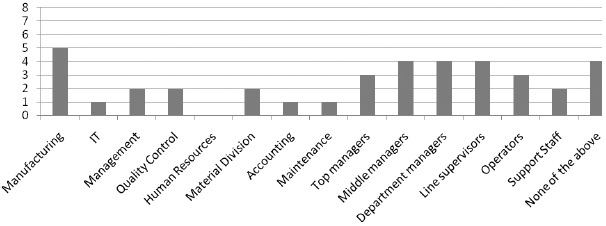
Question 9 asked about the method used for training and whether external consultants gave the training or if the training was done by internal means. While 60% used external consultants for the training, the rest of the 40% training was done by internal teams.
Question 10
The question was related to the amount of training that was given to the employee. It can be seen that while support staff were trained every month, department managers and line supervisors received training every three months.
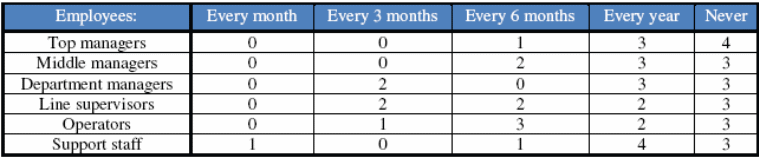
Question 11 and 12
The questions related to the broad ERP implementation details and question 11 asked if the ERP system that was implemented was designed as an end-to-end solution with total integration or if it was designed as a partial integration for the business area. Survey results for question show that the majority of companies implemented only a partial ERP system, as opposed to an end-to-end integration.
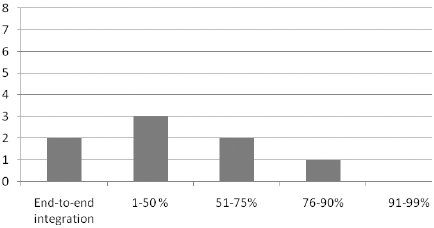
The next question 12 asked about the duration required for ERP implementation and the duration ranged from less than a year to five years. Six of the customers had implementations that went from 1 year to 3 years while 1 each had implementation duration of 3 to 5 years and even more than 5 years.
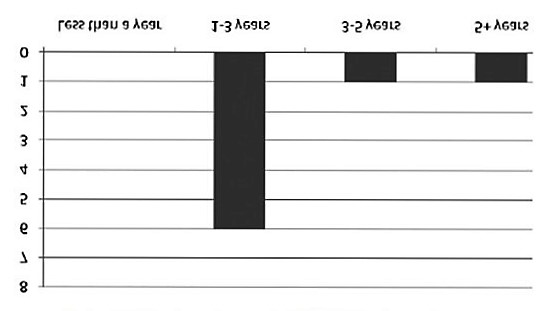
It has to be noted that such a long duration of five or more years is not beneficial for the company and can lead to higher costs that had been budgeted.
Questions 13 and 14
Question 13 was related to finding out why different modules were implemented and while 7 response were because the modules were deemed necessary by the company, one response said that it was recommended because an ERP consultant recommended it and another response was because the modules were part of the overall ERP package and could not be removed. The last choice assumes significance since it would be seen that ERP vendors tend to bundle a lot of unnecessary ERP modules that are often not required by the customer. However, since the modules are a part of the bundling, then it would not be possible for the customer to buy only what is required, or so claim the ERP vendors.
Question 14 asked if the ERP implementation was done as per the allotted budget and within the stipulated time. The survey showed that none of the companies met the budget and time allotted when implementing their ERP systems. Half exceeded both, and three exceeded one of the two factors. Four of the implantations have exceeded both time and cost that was allocated and this is one of the most common causes why people lose their interest in ERP implementations and why firms complain about high costs.
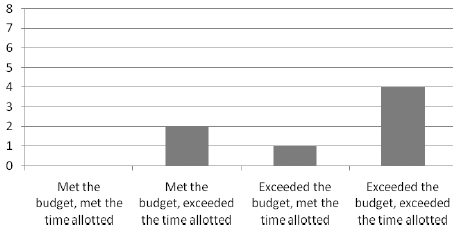
Question 15
The question was a continuation of the previous question and asked that if the ERP implementation exceeded the target budget, what was the cost overrun. Survey results for question indicate that implementation went over budget for a majority of the budgets. Three of eight respondent exceeded by 50% or more.
Question 16
The question had a multiple-choice selection and asked for rating to be applied for the rate for each factor on how it contributed to the total cost of ownership of the ERP system. Survey results for the question show e a widespread range of factors that impacted the overall cost of ownership for ERP systems. Half of the respondents cited extensive non ERP software upgrades as a for out of five cost and this indicates that his category may be a source of cost overruns for ERP implementation.
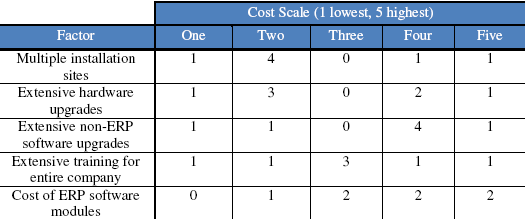
Question 17
The question was asked at the levels of the organization where ERP was used and multiple choices for the answers was allowed. Survey results for the question indicate that ERP is uniformly used at various levels of the company.
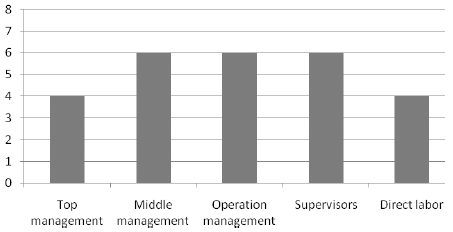
Question 18
The question was designed to understand the different departments where ERP was being used. Survey results for the question indicate that ERP is applied overall uniformly used at different departments within the company. Departments such as materials division, manufacturing and management had much higher use with HR and maintenance being the lowest users.
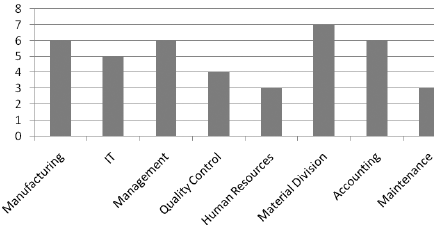
Question 19 – 20
Question 19 asked if any in house software tools were used by the employees to avoid using the tools in the ERP systems. It has been observed that in some cases, employees are inclined to use non ERP tools for storing information and for small computations. Such issues are known to cause severe problems later on when integration is to be done. Survey results for question show that 50% of the respondents have in-house tools that are used to avoid using the ERP system. This trend has to be reduced and done away with.
Question 20 asked if the ERP system was capable of collecting lean or value added and waste or non value added information and if the system alerts the ERP system user if waste is entering the system. The results showed that only one respondent’s ERP system can detect waste entering the system. This important feature is required in ERP systems and speaks of a high level heuristic system that is capable of finding various issues and problems for controlling waste.
Question 21
The question was designed to know if the ERP system supported any of the choices of measurements at cell, operations and corporate level. The choices were that ‘the system supports completed units per man hour’, ‘system supported completed units per hour’ and ‘system supports revenue per employee per unit of time’. Survey results for the question indicate that the majority of measurements are being supported at cell, operations, and corporate levels. Only one respondent did not have any of the measurements supported.
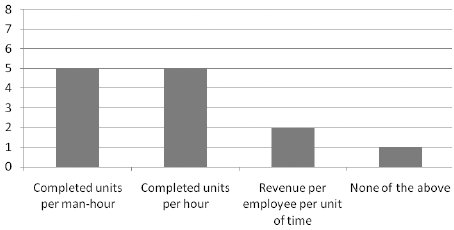
Question 22
The question listed some questions and respondents had to select the feature that was available in the ERP application. To a certain extent, some the items in the list were forward looking and represented the high end of the features that were required. Survey results for the question indicate that the majority of respondents do not have intelligent ERP functionality built into their ERP systems. Only three categories, of twenty-two have a majority of respondents indicating that their system supports the specified functionality. Following figure shows the selection and responses for each feature.
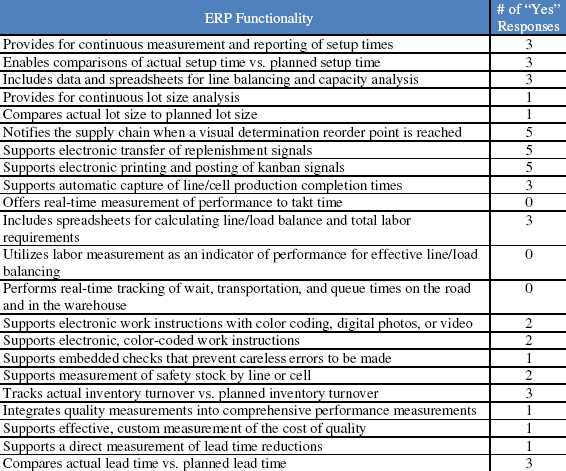
Responses were maximum for the following questions: ‘Notifies the supply chain when a visual determination reorder point is reached’, ‘Supports electronic transfer of replenishment signals’, ‘Supports electronic printing and posting of kanban signals’. These three features received 5 responses each and this indicates that five applications had the feature enabled in the system. On the other hand the number of features that had three responses is many. Some of them are: ‘Provides for continuous measurement and reporting of setup times’, ‘Enables comparisons of actual setup time vs. planned setup time’, ‘Includes data and spreadsheets for line balancing and capacity analysis’, ‘Supports automatic capture of line/cell production completion times’, ‘Includes spreadsheets for calculating line/load balance and total labor requirements’, ‘Tracks actual inventory turnover vs. planned inventory turnover’ and ‘Compares actual lead time vs. planned lead time’.
Question 23
The question was designed to understand how managers used ERP in the company. Some choices were given with multiple choices. Some of the choices included tracking finance, tracking scheduling and so on.
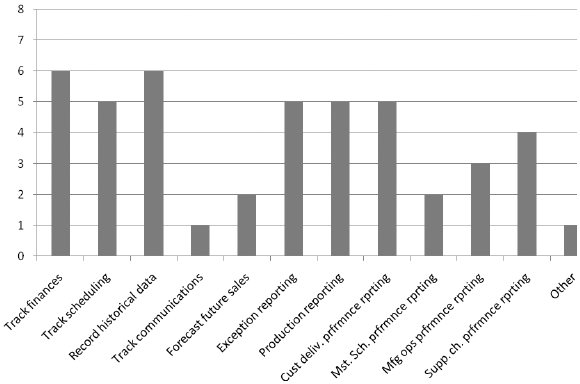
As seen in the figure, the maximum The highest use was for activities such as tracking finances and recording historical data and these tasks are very much important to judge the organization health and understand the historic factors and these scored 6 responses each. The uses that came next and that received five responses include track scheduling, exception reporting, production reporting and customer delivery performance reporting. Other reasons for which senior management uses ERP is for supply chain performance reporting, manufacturing operations performance operating and master schedule performance reporting, forecast future sales and tracking of communication.
Question 24
The question was directed at finding how manager specific information is stored after the ERP system has been implemented. There were three choices and choices available were ‘information is manually entered by employees in non managerial areas of the business’, ‘information is automatically collected from non managerial areas of the business’, ‘managers manually enter the information’. Survey results for question 29 indicate that manager specific information is largely entered through manual means, either by the managers themselves or by other employees.
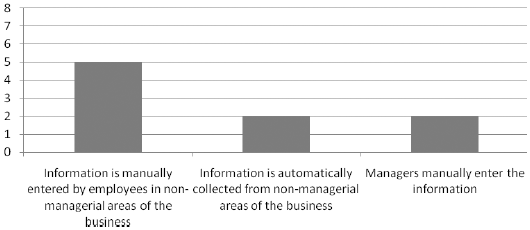
Question 25
The question was formatted to understand how managers improve the efficiency of their daily operations by using ERP. Available choices are ‘organize tasks more efficiently by using ERP scheduling systems’, ‘automate tasks through the use of the ERP’s automation system’, ‘incrementally perform manual tasks faster without using ERP. Survey results for question 30 show that more than half of respondent’s managers do not attempt to improve efficiency of their daily operations in any manner. This is a waste as the full power of the ERP system can be put to use.
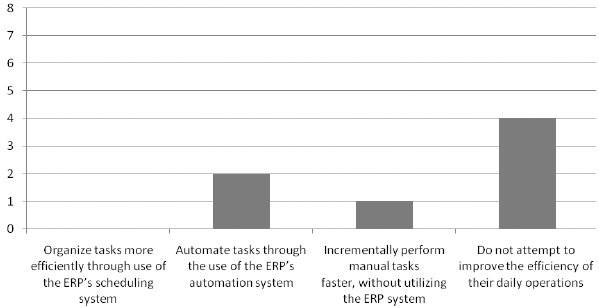
Question 26
The question was designed to find out if the company had an IT database and it was a part of the ERP package. Survey results for question indicate that the majority of IT departments have an IT database that is integrated into the ERP system.
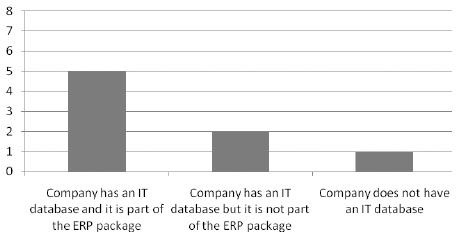
Question 27
The question was designed to find out how are incoming IT problems handled by the ERP system. The choices available were ‘they are emailed by the request initiator and then IT enters them into the IT database’, ‘the request initiator enters the incoming request into the IT database’, ‘they are emailed and exist only as an email and there is no IT database or that they are conveyed through a different method such as paper, forms, phone calls, etc.
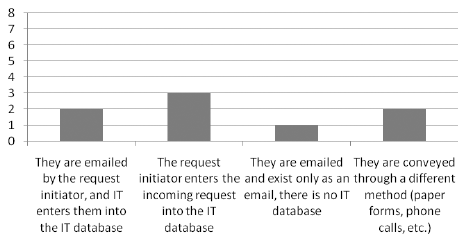
Question 28
The issue of difficulty to incorporate additional ERP modules into the current ERP system was asked and users were asked to rate the difficulty on a scale of 1 to 5. Survey results for the question indicate that the subjective difficulty of implementing additional ERP modules can vary greatly depending on the company.
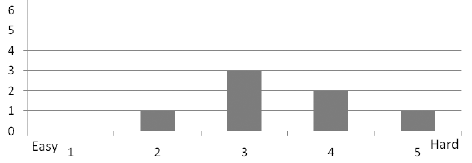
Questions for Co-Relational Analysis
The first four questions of the survey such as the company size, type of manufacturing, manufacturing environment and area of manufacturing were correlated against all other questions. The table given below contains the main correlations with a confidence level of 90% or greater. The top value in each table is the Pearson correlation coefficient, showing the strength of the correlation and whether the correlation is positive or negative. The bottom value is the p-value for that particular correlation, corresponding to the test of hypothesis for the strength of that correlation with the probability of Type 1 Error.
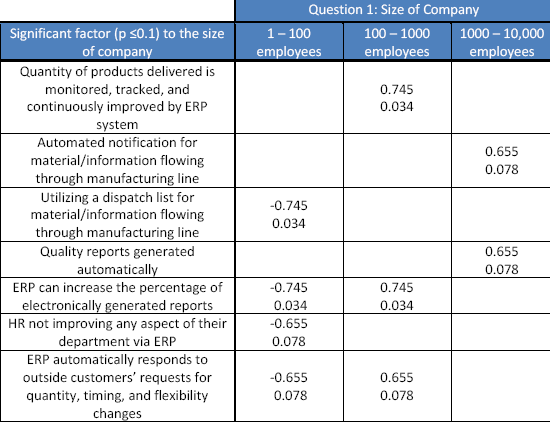
The above table gives details of the significant size of the company correlations. As per the results, a larger number of firms with 100-1000 employees track, monitor and take up continuous improvement of the product quality through the ERP system. By perusing the correlation results, it can be seen that a significant number of companies of 1-100 people tend to not utilize their ERP systems efficiently. All of the categories under the 1-100 people column are negatively related. Therefore, small companies tend to not use dispatch lists, increase electronically generated report, and their ERP does not respond to outside customers’ requests.
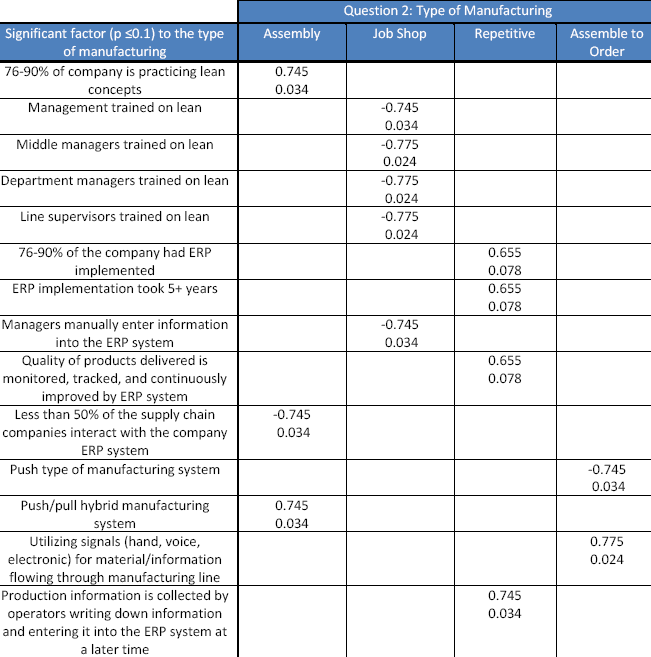
A significant number of small component manufacturing firms indicate that at least 76-90% of the company had ERP implemented, and that quality of products delivered is monitored, tracked, and continuously improved by the ERP system. However, the same results also indicate that the cost of products delivered is not monitored or tracked, showing that there are areas of improvement for all areas of manufacturing.
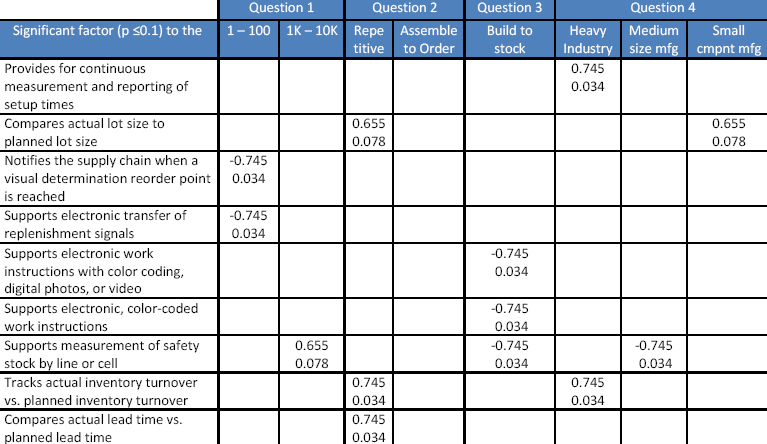
Tests of Proportion
Six out of eight, seven out of eight, and eight out of eight replies were analyzed with the test of proportions. The charts below represent all answers that fell within one of those three categories. The test of proportions was calculated by pushing the hypothesized proportion as high as possible without falling beneath the 90% confidence level. All three stated with a hypothesized proportion of p=0.50 vs. p>0.50, and adjusted accordingly. Answers that had six out of eight respondents reply positively indicated that the null hypothesis failed to be rejected at 0.46. The samples show that the population practicing these methods is significantly larger than 46%.
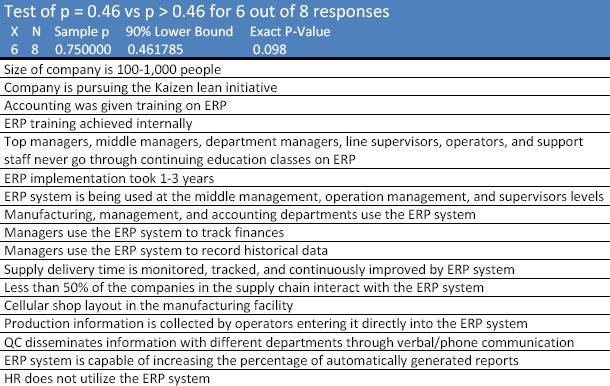
Conclusions and Recommendations
The paper has examined in detail the practice of SOA and ERP. An extensive literature review, detailed study of the texts along with research using a survey instrument has been formed. This section provides conclusion and recommendation for the research.
- Out of the eight responders, four said that they used SAP, two indicated that they used Oracle, one said they used web based free ware solution while only one respondent said that they had developed the software application in house.
- Various departments have been trained on ERP. The majority of responses show that manufacturing departments, middle and department managers, and line supervisors receive the most training, whereas human resources, IT, accounting, and maintenance receive the least. This is mainly because ERP is regarded as something that manufacturing people should practice and that majority of the activities are carried out by shop floor people. However, it must be noted that ERP is not restricted to only manufacturing but all other departments are involved.
- About the method used for training and whether external consultants gave the training or if the training was done by internal means. While 60% used external consultants for the training, the rest of the 40% training was done by internal teams.
- While support staff were trained every month, department managers and line supervisors received training every three months.
- Survey results for question “the broad ERP implementation details and question 11 asked if the ERP system that was implemented was designed as an end-to-end solution with total integration or if it was designed as a partial integration for the business area” shows that the majority of companies implemented only a partial ERP system, as opposed to an end-to-end integration.
- Duration required for ERP implementation and the duration ranged from less than a year to five years. Six of the customers had implementations that went from 1 year to 3 years while 1 each had implementation duration of 3 to 5 years and even more than 5 years.
- A question was related to finding out why different modules were implemented and while 7 response were because the modules were deemed necessary by the company, one response said that it was recommended because an ERP consultant recommended it and another response was because the modules were part of the overall ERP package and could not be removed. The last choice assumes significance since it would be seen that ERP vendors tend to bundle a lot of unnecessary ERP modules that are often not required by the customer. However, since the modules are a part of the bundling, then it would not be possible for the customer to buy only what is required, or so claim the ERP vendors.
- For the Question asking if the ERP implementation was done as per the allotted budget and within the stipulated time. The survey showed that none of the companies met the budget and time allotted when implementing their ERP systems. Half exceeded both, and three exceeded one of the two factors. Four of the implantations have exceeded both time and cost that was allocated and this is one of the most common causes why people lose their interest in ERP implementations and why firms complain about high costs.
- A question was asked about the continuation of the previous question and asked that if the ERP implementation exceeded the target budget, what was the cost overrun. Survey results for question indicate that implementation went over budget for a majority of the budgets. Three of eight respondent exceeded by 50% or more.
- The issue of difficulty to incorporate additional ERP modules into the current ERP system was asked and users were asked to rate the difficulty on a scale of 1 to 5. Survey results for the question indicate that the subjective difficulty of implementing additional ERP modules can vary greatly depending on the company.
- For the question to understand how managers improve the efficiency of their daily operations by using ERP. Available choices are ‘organize tasks more efficiently by using ERP scheduling systems’, ‘automate tasks through the use of the ERP’s automation system’, ‘incrementally perform manual tasks faster without using ERP. Survey results for the question show that more than half of respondent’s managers do not attempt to improve efficiency of their daily operations in any manner. This is a waste as the full power of the ERP system can be put to use.
- The question was directed at finding how manager specific information is stored after the ERP system has been implemented. There were three choices and choices available were ‘information is manually entered by employees in non managerial areas of the business’, ‘information is automatically collected from non managerial areas of the business’, ‘managers manually enter the information’. Survey results for the question indicate that manager specific information is largely entered through manual means, either by the managers themselves or by other employees.
- A question was designed to understand how managers used ERP in the company. Some choices were given with multiple choices. Some of the choices included tracking finance, tracking scheduling and so on. The highest use was for activities such as tracking finances and recording historical data and these tasks are very much important to judge the organization health and understand the historic factors and these scored 6 responses each. The uses that came next and that received five responses include track scheduling, exception reporting, production reporting and customer delivery performance reporting. Other reasons for which senior management uses ERP is for supply chain performance reporting, manufacturing operations performance operating and master schedule performance reporting, forecast future sales and tracking of communication.
- Survey results show that 50% of the respondents have in-house tools that are used to avoid using the ERP system. This trend has to be reduced and done away with.
Recommendations for Best Practice
Some best practice have been framed and they cover the areas of Vision and Leadership, Policy and Security, Strategy and Roadmap Development, Acquisition and Governance and Implementation and Operations.
Policy and Security
- Technical standards must be established and published extensively. These standards have to be made available to internal as well as any partners who may be developing compatible solutions. While SOA is designed to handle integration of diverse applications, the architecture development should be standardized to avoid excessive configuration problems. These would include XML and WSDL standards and toolkits.
- Portfolio management policies have to be created along with policy information standards and they must be published in the standards registry.
- Interoperability of applications must be developed to form many to many loose coupling web services. Such an arrangement helps to resolve problems related to versioning of services.
- There should be established directives and policies for reuse, governance, risk management, compliance, versioning and security.
- Security and integrity of services are very important and multiple approaches for ensuring security at the service level is important. There should be a facility to conduct audit trails of all transactions as and well required.
- It should be clearly defined if services are run for a user or a user role and this makes user identification management and authentication critical. Security must be enforced through strict security policies at the transportation and the messaging level.
- There should be a plan for business continuity and disaster recovery planning along with disaster management. In the current scenario, threats can come from terrorists as well as natural disasters. There must be sufficient backup procedures of data and transactions so that recovery of the system can be quickly done if a disaster strikes.
Vision and Leadership
- Evangelize and advertise about the advantages of SOA and web services and transformation that can be accrued.
- Change mindset and think differently since the traditional deployment methods are not suited for SOA. Issues such as boundary, operational and functional scope have to be rethought.
- Since there would a paradigm shift in the transformation, there is a need to manage issues related to strategic, cultural and other tactical issues related to the transformation.
- There is a need to address issues related to cross business and domain transformations since the firm would be dealing with resources across the organization. There is a need to make cultural adjustment and not just the business processes.
- All activities have to be properly documented and business cases for SOA have to be prepared. This is required to bring in transparency, plan and execute strategy, manage resistance and help to mitigate risks.
- There is a need to adopt both a top down and a bottom up approach to ensure that cultural differences and issues are resolved.
Acquisition and Governance
- All activities of web services acquisition should be incremental and priority applications should be targeted first.
- Collaborative demos, simulations and experiments should be used to understand how the system functions, before taking up enterprise wide integration
- Enterprise modeling can be used to identify business processes. This helps to define the dimensions, scope boundaries and the cross boundary interactions.
- Policies should not just be documented but also enforced. Compliance to policies should be made mandatory.
- Since the services are loosely coupled, the framework adopted should be much more robust. There should be clearly defined compliance rules and for mapping of the business and IT policies with the infrastructure.
- The SOA network should be monitored, analyzed and measured as per the metrics to understand its performance. It should not be left to run on its own and would need intervention at least in the initial stages before the process stabiles.
- Standards based registry should be used to promote discovery and governance of the services. The registry is the core of the SOA solution and it helps to increase reusability, reduce redundancy and allow loose coupling by using service virtualization and orchestration.
- Run time discovery can be implemented during actions such as load balancing to handle large number of service requests or when high value information has to be transported.
- BPEL, UML and other standards based process models should be used to increase the process model interoperability.
Implementation and Operations
- Implementation has to be done incrementally with lower applications and then the back end migrations and migration of applications to services interfaces should be done at the last stage. There should be a priority set and the first tasks should be for applications that have the highest business value.
- Partnerships and collaborations approach brings better results.
- Implementation is more difficult than creating demos and prototypes.
Strategy and Roadmap Development
- The SOA strategy and imperatives must be planned, discussed and documented and details such as current scenario and targeted outcomes must be specified. There is also a need to specify SOA metrics that would be used to measure the current and changed state.
- Transformation planning and deployment should be incremental since SOA is an iterative process. The process should first begin with extensive data collection and development should be done phase wise. Such an approach helps to observe and take feedback along with any corrective actions.
- The concept of shared services for time and return should be taken with proper investment plan. A cross channel view should be taken of the projects and feedback taken from multiple users.
- Shared services should be added as and when new requirements are developed. Redundancy should be reduced.
- There is a need to first create a topology of different services that would reveal the business processes.
- There should be a common vocabulary of taxonomies so that there is a proper understanding of the hierarchies. With a common vocabulary, it is possible to manage different business areas and increase collaboration.
- Cross enterprise architecture is important as it removes boundaries between business partners and removes information silos.
- There is a need to have common interoperability standards by using standards such as WSDL and SOAP contracts.
References
Bennett, Keith. December. Service-based software: the future for flexible software: in Seventh Asia-Pacific Software Engineering Conference, 2000. APSEC 2000. Proceedings: Seventh Asia-Pacific Software Engineering Conference, 2000. pp: 214-221
Brehm Nico, 2006. An ERP solution based on web services and peer-to-peer networks for small and medium enterprises. International Journal of Information Systems and Change Management, 1(1), pp. 99-111.
Carey, M.J., March 2008. SOA What? Computer, IEEE Xplore, 41(3), pp. 92-94
Classon Peter, December 2004. The Business Value of Implementing a Service Oriented Architecture. Discussion on the business drivers and benefits of SOA, Horizons, LiquidHub
Fu Ruixue, Xin Zhanhong, 2008. A Research on the Architecture of ERP for Small & Medium-Sized Enterprise Based on Agent and SOA. IFIP International Federation for Information Processing, 254, pp. 599-608.
Hansen Torben, 2006. Multidimensional Effort Prediction for ERP System Implementation. Springer Berlin / Heidelberg, pp. 1402-1408
Hitt, L.M. & D.J. Wu, 2002. Investment in Enterprise Resource Planning: Business Impact and Productivity Measures. Journal of Management Information Systems, 19(1), pp. 71-98.
Kashef Ali E., 2001. ERP: The Primary Solution Provider for Industrial Companies. Journal of Industrial Technology, 17(3), pp. 1-6.
Maurizio Amelia, Girolami Louis, 2007. EAI and SOA: factors and methods influencing the integration of multiple ERP systems. Journal of Enterprise Information Management, 20(1), pp. 14-31
Muscatello Joseph R, 2008. Enterprise Resource Planning (ERP) Implementations: Theory and Practice. International Journal of Enterprise Information Systems, 4(1), pp. 63-79.
Open ERP, 2009. Features of Open ERP solutions. Web.
Rego Rod, 2007. Strategic application. CMA Management, 80(8), pp. 19-22.
Rettig Cynthia, 2007. The Trouble With Enterprise Software. MIT Sloan Management Review, 49(1), pp. 20-29
Specht, T. Drawehn, J. Modeling cooperative business processes and transformation to a service oriented architecture. E-Commerce Technology: CEC 2005. Seventh IEEE International Conference, pp. 249- 256
Ajzen, I, Fishbein, M. 1980. Understanding attitudes and predicting social behavior. Englewood Cliffs, NJ: Prentice-Hall.
Bass Frank. 1969. A new product growth model for consumer durables. Journal of Management Science. Volume 15. Issue 5. pp: 215–227.
Bagozzi, R. P., Davis, F. D., & Warsaw, P. R. 1992. Development and test of a theory of technological learning and usage. Journal of Human Relations. Volume 45. Issue 7. pp: 660-686.
Brown Susan A, Venkatesh Viswanath. 2003. Bringing non adopters along: the challenge facing the PC industry. Communications of the ACM. Volume 46. Issue 4. pp: 77-80.
Davis, F. D. 1989. Perceived usefulness, perceived ease of use, and user acceptance of information technology. MIS Quarterly 13 (3): 319-340.
Davis Fred D, Venkatesh Viswanath. 1995. A critical assessment of potential measurement biases in the technology acceptance model: three experiments. International Journal of Human Computer Studies. Volume 45. pp: 19-45.
Fishbein, M, & Ajzen, I. 1975. Belief, attitude, intention, and behaviour: An introduction to theory and research. Addison-Wesley, Reading, MA.
Lilien Gary, Rangaswamy Arvind. 1999. Diffusion Models: Managerial Applications and Software. Web.
Rogers, E. M. 1962. Diffusion of Innovations. New York, NY: The Free Press.
Venkatesh Viswanath, Davis Fred D. 2000. A Theoretical Extension of the Technology Acceptance Model: Four Longitudinal Field Studies. Journal of Management Science. Volume 46. Issue 2. pp: 186-204.
Venkatesh Viswanath, Brown Susan. 2001. A longitudinal investigation of personal computers in homes: adoption determinants and emerging challenges. MIS Quarterly. Volume 25. Issue 1. pp. 71-102.
Venkatesh, V., M. G. Morris, G. B. Davis, and F. D. Davis. 2003. User acceptance of information technology: Toward a unified view. MIS Quarterly 27 (3): 425-478.
Byrne David. 2002. Interpreting Quantitative Data. Sage Publications Ltd.
Collopy Fred and J. Scott Armstrong. 1992. Rule-Based Forecasting: Development and Validation of an Expert Systems Approach to Combining Time Series Extrapolations. Management Science, 38 (10), 1394-1414.
Denzin, Norman K. & Lincoln, Yvonna S. (Eds.) 2000. Handbook of Qualitative Research. Thousand Oaks, CA: Sage Publications.
Freiman, J.A., T.C. Chalmers, H. Smith et al. 1970. The importance of beta, the type II error and sample size in the design and interpretation of the randomized control trial. New England Journal of Medicine, Volume 299, pp. 690-694
Galliers R D, D J Klass, M. Levy & E. M. Pattison, 1991. “Effective Strategy Formulation using Decision Conferencing and Soft Systems Methodology”, in P Kerola, R Lee & K. Lyytinen, Collaborative Work, Social Communications and Information Systems, Amsterdam: North Holland, 157-177.
Neumann Peter. 1994. Computer-Related Risks. MA, USA. Addison-Wesley Publishing Company.
Neumann, A, 1997. Ways without words: learning from silence and story. New York. Columbia University, Teachers College Press.
Orlikowski Wanda. 1991. The Duality of Technology: Rethinking the concept of technology in organizations. Organization Science, 3(3), pp. 398-427.
Remenyi, D., Williams, B., Money, A., and Swartz, E. 1998. Doing Research in Business and Management. London, Sage Publications.
Sekaran Uma. 1992. Research Methods for Business, 2nd ed., New York, Wiley Publications.
Silverman David. 2001. Interpreting Qualitative Data: Methods for Analyzing Talk, Text and Interaction, Second edition. Sage Publications.
Vitalari NP, et all, 1985. Computing in the home: shifts in the time allocation pattern of households. Communication of the ACM, 28(5), pp. 512-522.
Williamson Jon. 2000. Approximating Discrete Probability Distributions With Bayesian Networks. Proceedings of the International Conference on Artificial Intelligence in Science and Technology, pp. 16-20.
Yin, R.K. 1989. Case study research: Design and methods, Revised Edition. London: Sage Publications.
Zikmund William G. 1991. Business Research Methods, 3rd ed., Chicago, The Dryden Press.
Booth D, et al. 2004. Web Services Architecture: W3C note. Web.
Boehm B., 1996. Anchoring the Software Process. IEEE Software, 13(4), pp. 73–82.
Chen Rebecca, 2008. Applying SOA and Web 2.0 to Telecom: Legacy and IMS Next-Generation Architectures. IEEE International Conference on e-Business.
Chou Tung-Hsiang, 2008. Integrating E-services with a Telecommunication E-commerce using EAI/SOA Technology. International Conference on Information Management, Innovation Management and Industrial Engineering.
Dijkstra E., 1968. The Structure of the ‘t.h.e.’ Multiprogramming System. Communication ACM, 18(8), pp. 453–457.
Durvasula Surekha, et all, September 2006. SOA Practitioners’ Guide Part 2: SOA Reference Architecture. Web.
Enrique Castro-Leno, 2008. IT and Business Integration through the Convergence of Virtualization, SOA and Distributed Computing. IEEE International Conference on e-Business Engineering.
Erickson John, 2008. Web Services, Service-Oriented Computing and Service-Oriented Architecture: Separating Hype from reality. Journal of Database Management, 19(3), pp. 42-54.
Erl T.,2005. Service-Oriented Architecture (SOA): Concepts, Technology, and Design. NY, Prentice Hall.
Fragidis Garyfallos, 2008. An Extended SOA Model for Customer-Centric E-Commerce. IEEE Computer Society, IEEE International Conference on e-Business, pp. 771-776.
Hadded Chris, 2005. Building the Business Case for Service-Oriented Architecture Investment. Application Platform Strategies: Methodologies and Best Practices, 1, pp. 23-45.
Lämmer Anne, 2008. A Procedure Model for a SoA-based Integration of Enterprise Systems. International Journal of Enterprise Information Systems, 4(2), pp. 1-12.
Li Hao, Liu Qingtang, 2008. Design and Implementation of Educational Information Resource Management System Based on SOA. IEEE Computer Society.
Lin Kwei-Jay, 2009. Building Accountability Middleware to Support Dependable SOA. IEEE Computer Society.
Maurizio Amelia, et all, 2008. Service Oriented Architecture: Challenges for Business and Academia. IEEE Xplore, Proceedings of the 41st Hawaii International Conference on System Sciences.
Mulik Shrikant, et all, 2008. Where Do You Want to Go in Your SOA Adoption Journey? IT Pro: IEEE Computer Society.
Laplante Phillip A, et all. 2008. What’s in a Name? Distinguishing between SaaS and SOA. IT Pro: IEEE Computer Society.
Lu Hanhua, Zheng Yong, 2008. The Next Generation SDP Architecture: Based on SOA and Integrated with IMS. Second International Symposium on Intelligent Information Technology Application.
Papazoglou M.P., et al., 2007. Service Oriented Computing: State of the Art and Research Challenges. Computer, 40(11), pp. 38–45.
Parnas D.L., 1972. On the Criteria To Be Used in Decomposing Systems into Modules. Communication ACM, 15(12), pp. 1053–1058.
Pasley James, 2005. How BPEL and SOA Are Changing Web Services Development. IEEE Computer Society, 11089-7801/05. pp. 60-68.
Peng Kuang-Yu, Lui Shao-Chen, 2008. A Study of Design and Implementation on SOA Governance: A Service Oriented Monitoring and Alarming Perspective. IEEE Computer Society.
Perry D. & Wolf A., 1992. Foundations for the Study of Software Architecture. ACM Sigsoft Software Engineering. Notes, 17(4), pp. 40–52.
Portier Bertrand, May 2007. SOA terminology overview, Part 1: Service, architecture, governance, and business terms. Web.
Prahalad C.K and Ramaswamy V., 2007. Co-opting customer competence. Harvard Business Review, 78(1), pp.79–87.
Ribeiro Luis, 2008. MAS and SOA: A Case Study Exploring Principles and Technologies to Support Self-Properties in Assembly Systems. IEEE Computer Society, pp. 192-198.
Tang Longji, Dong Jing, 2008. A Generic Model of Enterprise Service-Oriented Architecture. IEEE Computer Society.
Yang Liu, Enzhao Hu. Architecture of Information System Combining SOA and BPM. 2008 International Conference on Information Management, Innovation Management and Industrial Engineering, pp. 42-46.
Zachman J.A. 1987. A Framework for Information Systems Architecture. IBM Systems Journal, 26(3), pp. 276–292.
Ash Colin, Burn Janice, 2003. Assessing the benefits from e-business transformation through effective enterprise management. European Journal of Information Systems, 12, pp. 297-308.
Beck. U., 2002. Risk Society: Towards a New Modernity. Sage Publications, London.
Boersma Kees, 2005. Developing a cultural perspective on ERP. Business Process Management Journal, 11(2), pp. 123-136.
Brazel Joseph F, Li Dang, 2008. The Effect of ERP System Implementations on the Management of Earnings and earning release dates, Journal of Information Systems, 22(2), pp. 1-22.
Briggs Warren, 2007. Competitive analysis of enterprise integration strategies, Industrial Management & Data Systems, 107(7), pp. 925-935.
Chadhar Mehmood Ahmad, 2004. Impact of National Culture and ERP Systems Success. Proceedings of the Second Australian Undergraduate Students’ Computing Conference, 2004, pp. 23-32.
Chen Injazz J. 2001. Planning for ERP systems: analysis and future trend. Business Process Management Journal, 7(5), pp. 374-386
Dehning B, Stratopoulos T., 2003. Determinants of a Sustainable Competitive Advantage Due to an IT-enabled Strategy. Journal of Strategic Information Systems, 12, pp. 56-68.
Dumbrava Stefan, 2005. A Three-tier Software Architecture for Manufacturing Activity Control in ERP Concept. Web.
Djuric Miroslav, December 2008. Lean ERP Systems: Existence and viability in today’s manufacturing industry. Thesis for Master of Science in Industrial Engineering, California Polytechnic State University, USA.
Fiona Fui-Hoon Nah, 2001. Critical factors for successful implementation of Enterprise Systems. Business Process Management Journal, 7(3), pp. 285-296.
Hamerman Paul, Wang Ray, 2005. ERP Applications-The Technology And Industry Battle Heats Up. Forrester Research, Inc. USA.
Hanseth Ole, Ciborra Claudio U., 2001. The Control Devolution: ERP and the Side Effects of Globalization. The DATA BASE for Advances in Information Systems, 32(4), pp. 34-47.
Ho. Chin. Fu., 2004. Strategies for the adaptation of ERP systems. Industrial Management & Data Systems, 104(3), pp. 234-251.
Kakouris A.P., 2005. Enterprise Resource Planning (ERP) System: An Effective Tool for Production Management, International Journal of Production Research, 28(6), pp. 66-80.
Ho Chin Fu, Wu Web Hsiung, 2004. Strategies for the adaptation of ERP systems. Industrial Management and Data Systems, 104(3), pp. 234-251.
Infosys, 2009. Business Process Management – Enterprise Application Integration. Web.
Kim Yongbeom, 2005. Impediments to successful ERP implementation process. Business Process Management Journal, 11(2), pp. 158-170.
Loh Tee Chiat, Lenny Koh Siau Ching, September 2004. Critical elements for a successful ERP implementation in SMEs. International Journal of Production Research, 42(17), pp. 3433–3455.
Lummus Rhonda, Vokurka Robert, 1999. Defining supply chain management: a historical perspective and practical guidelines. Journal of Industrial Management & Data Systems, 99(1), pp.: 11-17.
McLaughlin Laurianne, 2007. Open Source ERP: Today’s Hottest Emerging Technology? Web.
Molla Alemayehu, 2005. Success and Failure of ERP Technology Transfer: A Framework for Analyzing Congruence of Host and System Cultures. Paper 24, Working Paper Series.
Monk E, Wagner B., 2006. Concepts in Enterprise Resource Planning, 2nd Edition (Eds) Mac Mendelsohn, Canada: Thomson Course Technology.
msdn, 2009. ERP Connector Architecture. Web.
Ogbuji Uche, 2009. Linux in an ERP World. Web.
osserpguru, 2009. ERP History and Timeline. Web.
Rettig Cynthia, 2007. The Trouble With Enterprise Software. MIT Sloan Management Review, 49(1), pp. 21-30.
Richardson Bruce, 2006. ERP Doomsday Scenario: Death by SOA. AMR Research Inc. USA.
SAP WebAS, 2008. Architecture of the SAP Web AS. Web.
Stijn Eveline Van, 2001. Organizational memory and the completeness of process modeling in ERP systems: Some concerns, methods and directions for future research. Business Process Management Journal, 7(3), pp. 181-194
Tomb Greg, 2006. Implementing ERP: Lessons learned from the front. SAP Insight, www.sap.com
W3C, 2004. Web Services Architecture. Web.
Waldner Jean-Baptiste, 1992. CIM: Principles of Computer Integrated Manufacturing. UK. John Wiley & Sons Ltd.
Wu F, LI HZ, 2009. An approach to the valuation and decision of ERP investment projects based on real options. Annals of Operations Research, 168, pp. 181-203
Yenmez Ali Bahadir, 2008. Web-based ERP Architecture Experience. Web.
Bartlett, C.A., and Ghoshal, S. 1998. Managing across Borders: The Transnational Solution. Boston: Harvard Business School Press.
Beck, U. 1992. Risk Society: Towards a New Modernity. London: Sage Publications.
Beniger, J.R. 1986. The Control Revolution: Technological and Economic Origins of the Information Society. Cambridge, MA: Harvard University Press.
Chowdhury, S. 2002. Design For Six Sigma. Dearborn Trade Publishing Co., Chicago, Illinois.
Fahy, MJ. and Lynch, R. 1999. Enterprise resource planning (ERP) systems and strategic management accounting. Paper presented at the 22nd Annual Congress of the European Accounting Association, Bordeaux, May 5-7.
Granlund, M. & Malmi, T. 2002. Moderate impact of ERPS on management accounting: a lag or permanent outcome?. Management Accounting Research, Volume. 13, No. 3, pp. 299-321.
Hamerman Paul, Wang Ray, 2005. ERP Applications-The Technology And Industry Battle Heats Up. Forrester Research, Inc. USA.
Hanseth Ole, Ciborra Claudio U. 2001. The Control Devolution: ERP and the Side Effects of Globalization. The DATA BASE for Advances in Information Systems, 32(4), pp. 34-47.
Hsieh Chang-Tseh, Lin Binshan, 2007. Information technology and Six Sigma implementation. The Journal of Computer Information, 47(4), pp. 1-10.
Giddens, A. 1999. Runaway World. Cambridge: Polity Press.
Ives, B., and Jarvenpaa, S.L. 2009. Applications of Global Information Technology: Key Issues for Management. MIS Quarterly, p. 33-49.
Jeffrey Bradach. 1996. Organizational Alignment: The 7-S Model. Harvard Business School publications.
Kalling Thomas. December 2003. ERP systems and the strategic management processes that lead to competitive advantage. Information Resources Management Journal, 16(4), pp. 46-62.
Konsynski, B. R., and Karimi, J. 2003. On the Design of Global Information Systems, in Bradley, S. P., Hausman, J. A., and Nolan, R.I. (Eds.), Globalization Technology and Competition: The Fusion of Computers and Telecommunications in the 1990s. Boston: Harvard Business School Press.
Lawton, L. 2004. The Power of Ultimate Six Sigma: Keki Bhote’s Proven System for Moving Beyond Quality Excellence to Total Business Excellence. Journal of Organizational Excellence, Volume. 23 Issue 3, p. l08- 115.
Mata, F. J., Fuerst, W. L. & Barney, J. B. 2005. Information technology and sustained competitive advantage: A resource based analysis. MIS Quarterly, 19, 487-505.
Raisinghani, M., 2005. Six Sigma: concepts, tools, and applications. Industrial Management & Data Systems, Volume 105 Issue 4, pp. 491-505.
Rego Rod, January 2007. Strategic application. CMA Management, 80(8), pp. 19-21.
Ross, J.W. & Vitale, M.R. 2000. The ERP revolution: Surviving vs. thriving. Information Systems Frontiers, 2, pp. 233-241.
Rom Anders. 2006. Enterprise resource planning systems, strategic enterprise management systems and management accounting: A Danish study. Journal of Enterprise Information Management, 19(1/2), pp. 50-67
Schoemaker, P.J.H. & Amit, R. 1994. Investment in strategic assets: Industry and firm level perspectives. In P. Shrivastava, Huff, A. & Dutton, J. (Eds.), Advances in Strategic Management, 10A, 3-33. Greenwich, CT: JAI Press.
Wang Ray. 2006. Eleven Entry Points To SOA: How To Prepare For Upcoming Enterprise Application Trends And A World of SOA. Teleconference, Forrester Research Inc.
Walters. Bruce. A., 2006. IT-Enabled Strategic Management: Increasing Returns for the Organization. Idea Group Publishing, USA.
Zdravković Milan, Trajanović Miroslav. 2007. SOA based approach to the enterprise resource planning implementation in small enterprises. Facta Universitatis, Series Mechanical Engineering, Volume 5, Issue 1. pp. 97-104.
Djuric. Miroslav., 2008. Lean ERP Systems: existence and viability in Today’s manufacturing industry. Thesis for Master of Science in Industrial Engineering, California Polytechnic State University, San Luis Obispo, USA.
Sekaran Uma. 1992. Research Methods for Business, 2nd ed. New York, Wiley Publications
Zikmund William G. 1991. Business Research Methods, 3rd ed., Chicago, The Dryden Press.