Introduction
Supply chain management – SCM “is the art and science of network management in which multiple business entities and actors are interconnected so that services and products are delivered at the required time and quantity” (Gattorna, 1998). Cox (1995) defined SCM as “the processes from the initial raw materials to the ultimate consumption of the finished product linking across supplier user companies and the functions within and outside a company that enable the value chain to make products and provide services to the customer”. The ability of organizations to be able to react quickly to the supply demand, with the least delay often makes the difference between survival and making profits and failure and going bankrupt. With globalization practiced, it would be observed that many components and products are manufactured in one corner of the globe and consumed in another. This paper provides an in depth review of SCM practices, discusses various models and theories and presents some cases of successful and failed SCM implementations. After reading the report, the reader would have a better understanding of the dynamics involved in SCM.
Objectives and Purpose
Objective of the paper is to critically examine different aspects of supply chain management theory and practice, to find emerging trends that shape the SCM and procurement practices; to examine practices and case studies of SCM practices across different regions such as US, Europe, developing countries, Asia and other areas. The purpose is to create a paper that would bring out the best practices from a wide range of industries covering retail, food, music, manufacturing, apparel and other sectors. Once these findings are obtained, a framework of best practices would be created to help scholars and industries to obtain an overall perspective of SCM.
Rationale for the Research
There is a fine connection between SCM and outsourcing that has become a commonly accepted as a term in the English lexicon. Countries such as China, India and other South Asian countries have emerged as the main outsourcing hubs. These countries with their low cost labor, low government tariffs and highly skilled workforce have a unique competitive edge that allows organizations from Europe and USA to outsource a wide range of products such as automobiles and automobile components, apparel, food items, electronic goods, toys, chemicals and many others. However, while these countries have a competitive advantage in the form of resources, it is still up to the western companies to ensure that they set up a supply chain that allows the raw materials and finished products to move from one destination to other, like a clockwork. However, SCM is not only confined to China or India but to the local vegetable seller, the newspaper vendor, the person who delivers flowers, the music and toy shop down the corner and even the postal mail and courier service that people use everyday (Ross, 1998).
There are no prima donnas in the SCM and it should be remembered that often the weakest and the slowest entity in a network would determine the SCM efficiency and speed. The emphasis is on creating an efficient network in which all the elements are able to scale their activities as per the forecast demand. SCM does not involve work improvement process at individual organizations as this is a different branch of science and it is assumed that the entities are ready and willing to make the required improvements and investments for process improvement. SCM is mainly concerned in increasing the reaction speed in a network and how fast and how efficiently goods are transported from one destination to another, consistently and periodically. Work improvement process in an organization is one of the tools and methods that would be used by organizations to improve their sourcing and manufacturing techniques so that they can participate in a successful SCM network. Many organizations such as Tesco, GM, Toyota, Zara and thousands of companies use some form of supply chain management to reach their products. While companies such as Tesco and Toyota have their own SCM systems for procurement, smaller companies use the services of courier companies such as FedEx to send and receive their products. SCM covers almost all aspects of the industry and it has become a very important process with companies investing in millions of dollars to ensure the information and products are received and sent on time (Ross, 1998).
With SCM providing a ‘make or break’ situation, there is a need for developing an understanding of different aspects of SCM. There has been ample literature and research on specific areas of SCM such as transport, logistics, processes, importance of software and a number of case studies on different organizations have also been published. However, these publications provide a fragmented view of SCM practices and it would be difficult to find a single publication that consolidates and integrates different practices. To a certain extent this is gap in the literature and a reader would have to read multiple sources to understand what SCM practices and theory are. This paper would attempt to bridge the gap and provide the bigger picture and perspective and focus on key aspects of theory and practice.
Emerging trends in SCM
The current economic crises has fragmented the market and while economic recession is a reality, people still have to eat, clothe themselves and go for work if employed. This has produced a different marketing mix where transport companies are faced with reduced load and this would mean that trucks and ships would not run at reduced capacity and thus increase the overall costs for the transporters, the manufacturer and the vendor. This means that with reduced market share there is an increased consolidation among transporters and service providers and it is the age of collaborative practices rather than competition. Practices such as Cross Docking are gaining more importance and in this process, use of the warehouse for storage is done away with and goods are transferred directly from one truck to another. Pooling methods along with transhipment methods are being explored with the goal of reducing inventories to what is actually on the road and stocks in warehouses being kept only for emergency purpose (O’Marah, September 2008).
Demand forecasting has acquired a great urgency and conventional forecasting models are becoming ineffective because they rely on historic data such as GDP, growth, cost of living index and so on. The recession and the economic slowdown was not predicted well in advance and took just a couple of months to engulf the world. Crude oil was selling at 147 USD per barrel in July and within a few months, the rate has become less than half and even this fall in price was not forecast. With uncertain variables, demand forecast becomes uncertain and companies cancel orders at the last moment when goods have already been dispatched to a port and as a result, many of the ports are clogged with large number of containers and bulk products. This creates a nightmare for transporters and port authorities and the worst thing is that no one has any solution and it is a wait and watch attitude (PMI, October 2008).
McCrea (9 January 2008) reports that software development and practices in SCM is undergoing a change. The author suggests that new versions of software applications assume both the tasks of planning and execution of strategies and sit on top of the ERP systems that organisations have. Such systems are able to analyse any disruptive patterns more easily and scan the ERP network many times in a day so that applications become more predictive, fast and intelligent. The author also reports the increased use of RFID and GPS systems in the SCM industry and this trend reflects the need for information that can lead to decision making process. Frequently, large ERP and SCM systems are integrated with the RFID receivers and are able to track the order, estimate the time required to reach the destination and then appropriately place the work orders. Using such systems reduces the slack in the chain and reduces the inventory holding costs.
O’Marah (September 2008) points out that the demand driven supply networks – DDSN of the 20th century have undergone a vast change from the linear push model that was being used. The DDSN model has undergone a change and to a model that has three overlapping responsibility area and this is the supply management, demand management and product management. Please refer to the following figure that illustrates both the models.

The author also speaks of the ‘value chain maturity model with 12 dimensions’ and these are the 12 dimensions that a demand driven transformation has to cover.
Radjou (2008) has conducted research to understand the implications of SCM practices and how CEOs view SCM practices in the current economic scenario. According to the author, procurement is closely integrated with SCM and the emphasis is on value addition and cost reduction. Organizations have realised that merely procuring items based on the cost, if the vendor is in a remote and far off location has no meaning. This would mean increasing the procurement cost, lost opportunity cost and inventory holding cost. The author has pointed out that there are a number of mega-trends that are shaping the SCM industry. These are illustrated in the following figure.
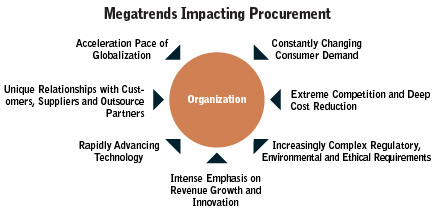
As seen in the above figure, a number of mega trends are impacting procurement and these would in turn serve as the directions for SCM. A major shift is the procurement is closely associated with SCM practices and large companies need to factor the delays while calculating the procurement costs.
The thesis would examine the above issues and a number of other issues, both historic and current to understand how SCM solutions have been actually implemented. There is a strong support from both theory and practice in the paper.
Methodology Used
The student first began by studying a number of publications such as trade magazines, news reports, books and peer-reviewed journals to understand the extent of the subject. SCM is a very vast domain with hundreds of niche practices and terms. After a through review of the domain, a number of key words related to SCM were noted down and some examples were logistics, demand, Tesco, Bull Whip and many others. These key words were again searched to understand their overall impact on SCM practices and a long list was prepared to create a list of key words that would be used in the research. The list was again refined to form a shortlist of final words and headings that were representative of common SCM practices across all industries.
Using these key words, databases such as ProQuest, Questia, Internet and other sources were searched to find documents that would be considered for the study. The search also yielded a number of organizations that had successfully implemented SCM practices. The documents were perused to obtain a final set of headings and then a method was used to extract the required ideas from the documents and rewrite the ideas and content to form different chapters. In the course of writing, important notes and points of an article were noted and these would be later used in the conclusions chapter.
Limitations of the Research
The research has focused on an empirical literature review of a large number of sources and has not attempted to conduct interviews of SCM professionals. However, responses to questions and some previous survey results have been used to understand the expert’s opinion of the subject. This has been due largely to location and readily available respondents in the English language as the writer’s home country is Thailand, where questionnaires would need to be in local language and not the author’s mother tongue. Some initial attempt and mailings outside of Thailand to seek further input resulted in a poor response rate.
Timeline for research
The research involved different areas and phases and was conducted over a seven-month period, beginning from May 08 and ending in November 08. The timeline of the paper is presented as below.

There are certain overlap areas for the Research and Reference material collection and documents and sources were collected right from the initial study period.
How the Thesis is arranged
The thesis is made up a number of chapters and an overview of each chapter is given below:
Chapter 2. ‘SCM- Understanding important concepts and ideas’. This chapter has extensively discussed important concepts related to supply chain management. A brief history of SCM is provided and topics such as bull whip effect, models of SCM, Quick response and techniques of cross docking are discussed. Other topics presented include warehousing techniques, performance measurement of supply chains, demand driven value chain and the effects of corporate culture and HRM on SCM strategy. Important topics such as cluster theory and supply chain and the value chain have also been examined.
Chapter 3. ‘Case Studies of SCM implementation’: This chapter has presented supply chain implementations from different industrial sectors such as retail of Tesco, manufacturing, perishable commodities, fashion and toys retailing, music industry, Wal-Mart, Toyota and Amazon. The paper has also examined failed SCM implementation of Nike, WebVan and other supply chains that were disasters.
Chapter 4. Conclusions. The findings from the paper are presented in this section and an overview of the various topics are given
SCM – Understanding important concepts and terms
Some important concepts and terms related to SCM are discussed in this chapter. While some of the terms discussed are common for different SCM types, some are specialised methods that are used where there is a specific requirement. It should be noted the SCM is not restricted to only trucks and courier agencies but covers the whole process of procurement strategy and managing the various entities such as vendors, buyers, purchase departments, stores, warehouse management, sales, forecasting, software applications and so on. The literature review would attempt to consolidate all these areas and present the findings in a comprehensive manner.
Brief History of SCM
Lummus (1999) comments that the emergence of modern SCM practices started in the textile industry of US in 1980 where the quick response program was initiated. The movement later was adopted by the grocery retail industry. The author reports that the US apparel industry was facing huge capital lockup in inventories and this had led to high costs. As a result, some members of the US apparel sector in 1984 decided to form the ‘Crafted With Pride in the USA Council’. They asked Kurt Salmon Associates in 1985 to analyse the supply chain that the council members used to procure items from overseas. The report showed that the delivery period required for the apparel, counting the days from the raw material despatch to despatch of the finished products took an incredible 66 weeks. Out of this huge period, goods that were despatched often languished in the stores and warehouses or were in transit. Council members, as per the agreement had to make the payment when the goods were lifted from the vendor and they were burdened with a huge idle inventory for which they had paid and members were incurring huge financial losses, not because of adverse market conditions but simply because no one had looked into the problem of how long purchased raw materials took to enter the workshop.
Kurt Salmon Associates and the Council developed a strategy known as QR – Quick Response strategy. In this strategy, entities such as the vendors, buyers, retailers work on a cooperative basis with each other in a network and share information. This practice allowed the network to respond quickly to the demands from the customer. The report suggested that to improve performance, very few changes in technology were required and this led to the creation of a number of standards. As a result of this strategy, a number of standards were established and adopted by industries such as the UPC code for grocery sector, EDI standard that allowed information between systems to be exchanged, Point of Sales bar codes for scanning and transferring information on sales to manufacturers and distributors. A set of best practices was suggested that would substantially improve overall performance by expediting quick and accurate flow of information up the supply chain. ECR enabled distributors and suppliers to anticipate future demand far more accurately than the existing system. By implementing best practices, a reduction of an overall inventory level of 37% was achieved and the cost reduction that was achieved was about 30 billion USD, as per 1985 prices. A number of further refinements were done such as continuous replenishment (CRP), just in time, customer relationship management and so on (Lummus, 1999).
New (1997) comments that a number of organisations embraced the concept of SCM. Some of the companies that started early were Hewlett-Packard in 1993, Whirlpool in 1992 with 20 percent reduction in inventory, lead time of 5 days and product availability up to 95 %; West Co., Georgia-Pacific Corp. in 1994 with $ 20 million savings per year from freight handling Wal-Mart in 1995, Becton Dickinson in 1990, and others.
Dunning’s Eclectic Theory of International Production
Dunning (1980) has proposed the Eclectic Theory of International Production that attempts to define the behaviour of international organizations and to a large extent, the theory can be applied to the offshoring model of Toyota. The theory is based on the OLI paradigm that blends different theories related to foreign direct investment. According to Dunning, the Foreign Direct Investment is a function of ownership, Location and Internalization Advantages. The components of this theory are discussed as below.
Ownership Advantages: The ownership advantages cannot be exactly defined but they can be transplanted by the parent organization when it opens a unit in another country and factors such as the brand value and name, technology and quality, economies of scale and others are transferred along with the management vision and philosophy. The advantages are in the form of lower costs, higher revenues and increased acceptance in the market. Toyota has leveraged its brand name and TPS to a very high degree for its advantage.
Location Advantages: These are the country specific advantages that the firm can employ in its off shoring activities. Different issues involved here are the economic advantages in the form of skilled manpower, skilled vendors who can be trained, reduced costs of operations, transport, reduction in tariff’s concessions in the form of land and power and other factors; Political advantage and this includes the government policies that encourage the employment of local population and foreign direct investment; and the social cultural advantages that include bridging the gap between gaps of language and culture.
Internalization Advantages: These refer to the manner in which the companies operate in the country such as wholly owned subsidies, partnerships, technical collaborations, marketing and distribution arrangements and so on.
Hymer’s Theory of MNE
Hymer (1960) proposed the theory of multinational Enterprises (MNE) and it changed the focus from the country to a firm. Hymer examined the structure of national markets that are dominated and segmented by local manufacturers. The author argued that when trade barriers are lowered and transportation costs are reduced, competition in between two companies would tend to create certain behaviours where the two firms would merge or one firm would be acquired by the other to create the MNE. This theory tries to explain why a major manufacturer would attempt to set up a unit in a foreign country. He suggests “MNEs were instruments through which different competitors in various industries reduced the competition where large barriers to entry had created certain sustaining local monopolies”.
Models of SCM
SCM combines a number of key supply business processes such as Customer service Management, Procurement, Product development and Commercialisation, Manufacturing flow management/support, Physical Distribution, Outsourcing/ Partnerships and Performance Measurement (Cox, 1997). Different models for SCM have been proposed based on the activities involved and these are strategic, tactical, and operational.
Strategic: Refers to the Strategic network optimisation and this includes the number, size and location of distribution centres, warehouses and facilities. Model suggests developing strategic partnerships with distributors, suppliers and customers with two way communication and information flow (Gattorna, 1998).
Tactical: Deals with decision making related to production, contracts, scheduling and planning. Includes strategy for transportation, frequency and routes and benchmarking against competitors (Basnet et all, 2004).
Operational: Covers daily activities such as production, node distribution, production scheduling, demand planning and forecasting for the organisation and suppliers (Heng et all, 2005).
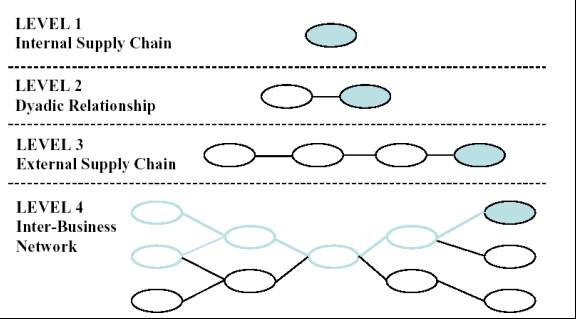
Harland (Harland, 1996) proposed that there are three levels of SCM in an organization and these are illustrated in Figure 2.
/var/www/blog-sandbox.itp/wp-content/uploads/2021/09/192259_4.jpg 576×319 24bit N JFIF [OK] 25308 –> 25244 bytes (0.25%), optimized.
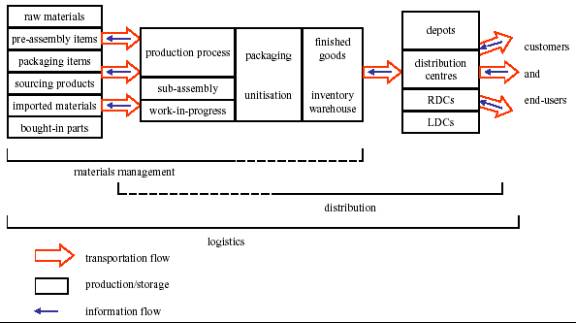
Christopher (Christopher, 1994) has suggested that there are different types of logistics and these are:
Military logistics: This type covers the defense forces and provides for efficient movement of men, materials, munitions, equipment, food, medicines, etc. Military logistics are very critical for the success or defeat of an army.
Business Logistics: This type covers the operations of an organization and can include activities such as marketing and distribution, procurement, shipment, etc. There are a number of segments such as food distribution, medical logistics, liquid and bulk material logistics and so on.
/var/www/blog-sandbox.itp/wp-content/uploads/2021/09/192259_5.jpg 576×323 24bit N JFIF [OK] 23297 –> 23232 bytes (0.28%), optimized.
Bull Whip Effect
The Bullwhip Effect occurs in forecast driven channels. This refers to an amplifying effect that is inherent in supply chains that try to maintain a buffer stock so that any upsurge in demand does not result in stock out’ situations The effect can occur due to uncertainties in the supply chain with regards to cost, schedules, political fallout, scarcity and other factors (Lee, 1997).
The bullwhip effect, induced within the supply chain greatly increases the level of risk for each partner. The further the partner is from the marketplace, the greater is the likely increase in risk. Therefore, for the supply chain as a whole to remain competitive, it is essential that each value stream be engineered to minimise unnecessary bullwhip (Towill, 2005).
/var/www/blog-sandbox.itp/wp-content/uploads/2021/09/192259_6.jpg 361×282 24bit N JFIF [OK] 21423 –> 21403 bytes (0.09%), optimized.
Bull Whip effect causes excess or low inventories, increases cost of production and transportation and raises costs to the consumer. Mark and Spencer ended up losing a sizeable market share when they tried to reduce the costs by shaving 1 per cent off the factory price of overseas suppliers at the cost of greatly reduced flexibility (Holmstrom, 2002).
Some methods used to solve this effect are: level scheduling or LS with constant orders placed on the shop floor. Purchase where orders equal to external demand placed on the shop floor and pragmatic demand management or DM that is a strategy based on a compromise approach (Andrew, 2004).
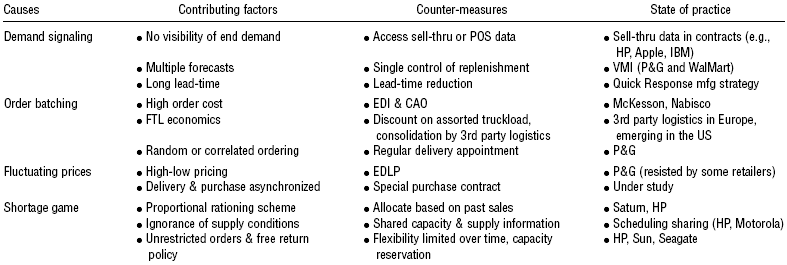
The bullwhip phenomenon has occurred in many areas and Procter & Gamble observed that orders for diapers issued by the distributors have some amount of variance that is not related to only consumer demand fluctuations alone. Hewlett- Packard found that orders by reseller for the printer unit have much higher swings and variations than the actual demands from customers and that the orders to the integrated circuit unit had even higher swings. The market for DRAM market has traditionally been faced with a much higher volatility than the computer sales. Distortion of demand information means that manufacturer that depend only on the immediate order data would be misled by the amplification in the demand patterns leading to serious cost impacts. Manufacturer would face excess cost of raw materials since the purchase of supplies is unplanned. There would also be extra manufacturing costs that are created by inefficient utilization, excess capacity, overtime, extra warehouse costs and extra transportation costs due to wrong scheduling and premium shipping rates. It is estimated that such activities can create wasteful costs of 12.5% to 25%. Another estimate is that is of the estimated 100 billion USD worth extra inventory in the network of the annual 300 billion-grocery industries. There are four main reasons for Bull Whip Effect and they are: rationing game, demand signal processing, price variations and order batching. Demand signal processing is the condition when demand is not steady and buyers rely on past demand information to create forecasts. Rationing game is the strategic ordering behaviour used by buyers when shortages in supply shortage is expected. Batching of orders occurs when the fixed order cost has a non-zero value and it would not be economical to place orders in each period and so batching or orders takes place. Price variations deals with the aspect of non-constant purchase prices for goods. Order batching and Demand signal processing are related to each other as they occur when each member tries to optimise inventory and internal operations. Price variations and rationing game are related since they are impacted by the stakeholder’s reaction to the market dynamics (Padmanabhan, 2004).
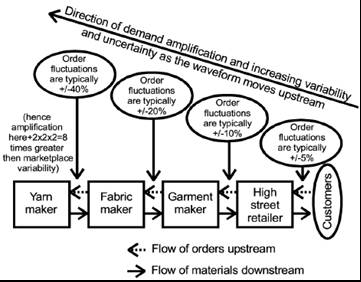
Demand information distortion occurs when the buyer places order the refreshed demand forecast. This causes the producer to ignore the true demand and any schedule for production tha is based on the distorted information is inefficient. When the number of intermediaries in the channel is more, the distortion effect gets amplified. This phenomenon is observed more in the grocery an retail market that is driven by volumes. Typically, one would see ‘offers’ such as ‘buy one, get one free’ and this has occurred because distorted demand for items such as soft drinks, soaps, chips, etc. occurred and there was an increase in the supply. Faced with a huge inventory of items, the retailer is forced to somehow push the products and this is done by such offers. If the retailer tries to play safe and reduces the demand then he is faced with a stock out situation that may make customers switch to another store or product and no retailer would want that to happen. Electronic Data Exchange systems that allow information between retailers and manufacturers to be exchanged quickly and transparently is a good tool that has led to a better understanding of the true demand. By using such systems, information on the stocks held at a retailer, inventory levels in the supply chain and other factors can be measured effectively and proper decisions can be taken about the level of manufacturing and there is an attempt to fine tune the balance between manufacture and supply. Please refer to the following figure that gives details of the causes and solutions of the Bullwhip Effect (Padmanabhan, 2004).
Quick Response – QR
Quick Response – QR is a technique where vendors and buyers partner with each other and share information so that they can respond quickly to the customer requirements. QR is needed when information flowing through a soppy chain is distorted and a bullwhip effect is created. This produces large variance in the purchase order when compared to the sales made to the buyers. There is a subsequent distortion in the demand and the information gets amplified as the information travels upstream. Members in the supply chain that receive information only from the immediate node will be mislead by the information and there is a subsequent false increase in demand. As a result, more products are manufactured and the inventory levels increase and this can cause losses to the vendor, clogging of warehouses and additional load on the transporters (McMichael, 2000).
/var/www/blog-sandbox.itp/wp-content/uploads/2021/09/192259_8.jpg 361×207 24bit N JFIF [OK] 9867 –> 9828 bytes (0.40%), optimized.
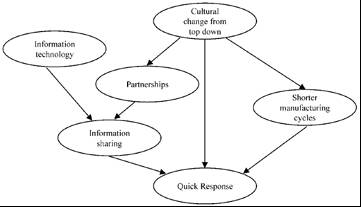
Ross (1998) points out that that QR is a strategy that is driven by the consumer and represents cooperative planning that is used by partners of the supply chain. The net effect is that products are sent to the right place, in the right quantity and at the required time. By using improved work processes such as flexible manufacturing and lean manufacturing, it is possible to reduce some of the inefficiencies in the supply chain. By using QR, it is possible to maintain the optimum inventory level and there are powerful ERP systems that automate the task of placing purchase orders and managing the supply chain. These practices become very crucial for large organisations such as Toyota, Wal-Mart, Tesco and other that order hundreds of items. It is not possible to manually enter the details in the system to order the products and it is also not possible to enter receipt of the delivered goods and check the balance. QR combined with advanced software systems helps to reduce the problems of the bullwhip effect.
A study by McMicheal (McMichael, 2000) of the 119 billion AS$ Australian retail market showed that 20, 000 jobs had been lost along with 500 million AS$ due to bull whip effects forcing the Victorian State Government to initiate the TCF QR pilot program. The program instituted EDI and system integration to enhance information flow and this resulted in better understanding of the demands and quicker response and this produced lesser upheavals in the work orders with accurate forecasting and demand and stable pricing.
Cross Docking
Cross Docking is a strategy used for warehouse management where goods are transferred directly from the receiving station to the shipping station. This means that the material is not stored in the warehouse but directly transferred to the shipping station. Receiving and shipping stations can be trucks, airplanes, ships or locomotives. This technique can help to very much reduce the cost of transportation and warehousing storage and ensure that inventories are maintained to the level required by the customer service. The technique can also reduce the processing and order cycle timing and results in improving the response and effectiveness of the distribution network (Apte, 2000).
Manufacturing process can be optimised only up to a certain level and further improvements for reduction of cycle time and other parameters would require substantial investments in plant and equipment. When the end cost of the product cannot be raised, organisations may not consider it worthwhile to make such investments. Other targets that organisations take up are to improve the logistics and distribution efficiency. Logistics and distribution account for 30% of a product cost and thus there is ample scope to reduce these costs and Cross Docking offers a good possibility for cost reduction (Schwind, 1995).
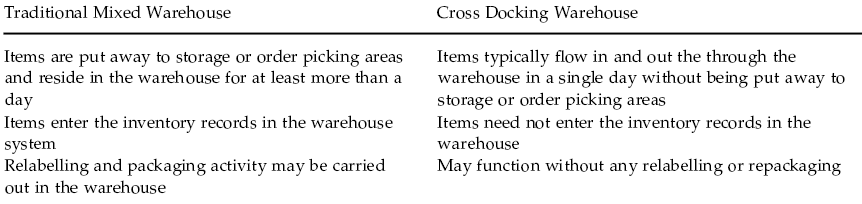
In Cross docking technique, material movement is made directly from the receiving area to the shipping area with the least dwell time. While this concept has been used on and off since a few years, mainly when an incoming shipment got delayed and a receiving truck was on standby for the goods. The concept has gained significance with other methods such as JIT and EDI. The method is also called as flow through distribution where the product is often moved from one transport media to another without storing. There are some difference between the traditional mixed warehouse and the cross-docked warehouse and these are illustrated in the following figure.
In traditional warehouse, goods are moved from receiving to storage and then to shipping areas while in cross docking, goods are moved from receiving to shipping area no storage being done at the warehouse. Dwell period is kept as small as possible in the receiving and shipping facility and with shorter period, the storage buffer needed is smaller. When volumes rise or with uncoordinated shipments, the buffer area increases and the model slowly turns to the traditional type so the logistics of receiving and shipment media have to be coordinated with a clockwork efficiency. Material handling process such as receiving, redistributing and shipping are the physical flow of goods. Along with this physical flow, there is also a flow of information and information management becomes very critical. When only one truck is bringing in goods and another is taking it out, then the process can be managed manually. But when there are many trucks, with multiple products that have to be loaded into specific vehicles and destination, then Cross Docking can only be managed with an automated material handling system that is fully computerised. Computerisation begins when the consignment is packed and collected by the package handlers who use web enabled bar coding machines that relay the consignment information even as the package is loaded in a van, to the central warehouse computer. The warehouse computer would then know what parcel is coming in at what time and in what quantity and where and when this has to be sent. The warehouse computer then makes arrangements for the onward delivery and a truck or airplane would be waiting to collect and move the package onward. This practice is used by courier agencies such as FedEx and Parcel Force that have large automated warehouses. Hundreds of trucks bring in packages from across multiple collection areas and these would have different destinations. When such operations are conducted optimally, then the consignment would be spending just a few minutes on the warehouse conveyors. In the case of courier, retail and other industries, Cross Docking techniques have become almost mandatory to retain customers, reduce costs and increase operational efficiency. The technique is also used in transfer of bulk liquids and materials such as food grains and chemicals where large ships carrying thousands of tons of food grains arrive at a dock and it is simply not possible to store the grains on the dock but they must be transferred to a truck or locomotive and pushed forward (Apte, 2000).
By transporting products in full truckloads – FTLs and by using FTL shipments, the level of average inventory is increased in the distribution channel. However, in cross docking, large reductions in costs of transportation can be obtained without increasing the average inventory levels. In many instances, the inventory level in a warehouse is reduced with cross docking thus providing reduced inventory holding cost. Cross docking also has other advantages, such as reduction of order cycle time and this leads to increased flexibility and responsiveness of the distribution network. So the key to effective cross docking comes from effective handling of physical flow of products, effective use of Information technology and information flow; effective FTL shipments and proper planning and management (Schwind, 1995).
Warehousing Techniques
Ballou (1999) comments that warehouses are structures that are used to store goods in transit. Based on the tariffs and zoning laws of a region, warehouses may be located outside the municipal limits of a city so that the goods are not subjected to Octroi and other cess and taxes. Main functions of a warehousing is to have an appropriate inventory so that enhanced customer service can be provided to customers by supplying goods as needed and to leverage the economies of scale in transpiration by transporting in full truck loads – FTLs. Different types of warehouses are consolidation warehouse, break-bulk warehouse and mixed warehouse.
In the consolidation warehouse, goods from different vendors may be sourced in less than FTL or LTL and the warehouse in located at a central place near the vendors. From this warehouse, FTL are shipped to other locations and thus the warehouse helps to ‘consolidate multiple LTL into a larger FTL. This ensures that the transportation costs are reduced. In some cases, smaller capacity vans may be used to bring in LTL loads. Please refer to the following figure that illustrates the consolidation warehouse (Ballou, 1999).
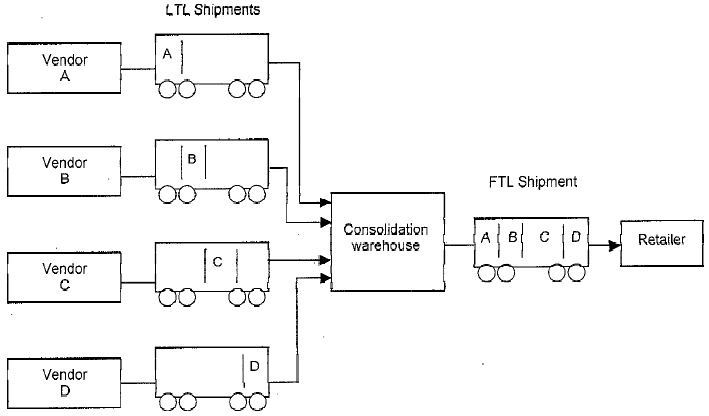
As seen in the above figure, there are multiple vendors named A, B, C and D and they send LTL with goods to the consolidation warehouse. At the consolidation warehouse, the goods may be repackaged, labelled and then sent as FTL shipment to the retailer. This warehouse is very commonly used in many warehouses and is adequate for low to medium volume goods or where the cost of goods is high.
In a break bulk warehouse, the reverse process of consolidation warehouse is used. Bulk material is input as FTL from multiple vendors or even a single vendor. This input goods is then split or broken into smaller sized lots and then output as LTLs or in smaller vans for retailers and distributors who may be located in nearby areas. Please refer to the following figure that illustrates the break bulk warehouse (Ballou, 1999).
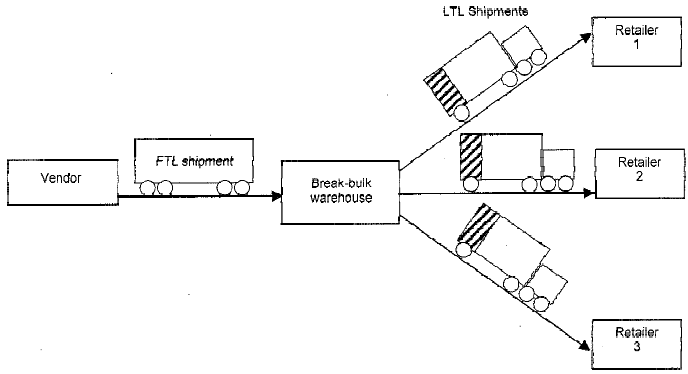
As seen in the above figure, a FTL shipment is sourced from a vendor and enters the break bulk warehouse. The FTL is then split into multiple LTL shipments and sent to different retailers. This process is often used by retail distributors who may source items in bulk from manufacturers such as Unilver or Coco Cola and then make smaller deliveries to the retailers. When the FTL is sourced, care is taken to see that items are packed in sealed cartons and boxes and at the most whole cartons of the goods are despatched as LTL and actions such as breaking open a carton and sending only one or two bottles of coca cola or a few bars of soap are not acceptable. This type of warehouse is useful since retailers can procure only the quantities that they require for a day or a week and payment is done accordingly and as a result; they are not saddled with dead inventory.
In the mixed type of warehouse, a combination of the two methods is used. Goods are received as FTL from different vendors to the warehouse and there could be multiple products. The FTL is then broken up and consolidated as different FTL shipments and there may again be different products in the FTL. The FTLs are then despatched to different retailers and distributors as per the orders. Please refer to the following figure that illustrates the mixed type warehouse.
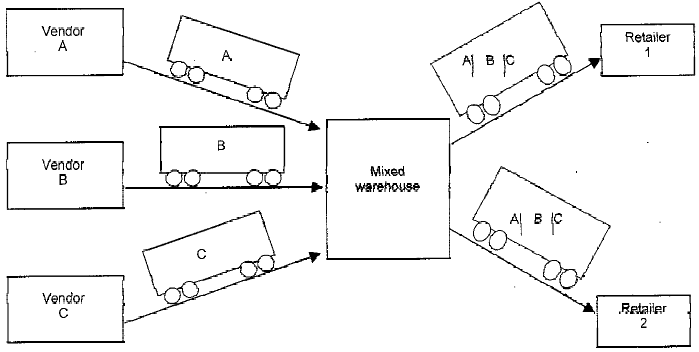
As seen in the above figure, FTLs are received from multiple vendors and these are then broken up and consolidated into separate FTLs and sent to the retailers. The above three types of warehouses are used in the traditional warehouse and it is also possible that the same warehouse would use all the three techniques. While the advantage is that retailers can source the exact quantities as per their schedules, the disadvantage is that shipments may ge stuck in a warehouse for weeks without movement and this would lead to further inventory costs and capital lock up. There is also a chance that warehouse operators may not follow FIFO techniques and despatch the goods that are nearest, thus making stocks that have arrived earlier to languish in the back rows till they may cross their useful shelf life or expiry dates in which case they have to be destroyed. To a certain extent, these problems can be solved by using Cross Docking warehouses, as discussed in Section ‘2.4. Cross Docking’.
Thus, it can be seen that managing the warehouse effectively can cut down inventory losses to a high extent and so managing warehouses in one of the key areas in SCM.
Performance measurement of Supply Chains
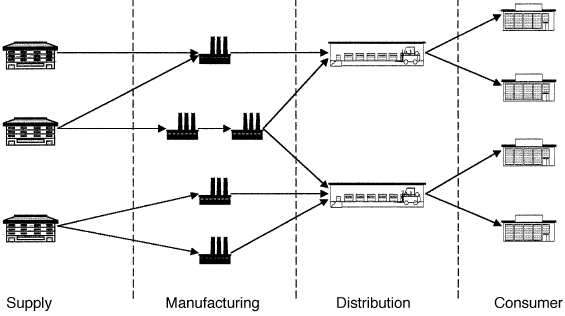
Beamon (1999) has written a paper on measuring the performance of supply chains. According to the author, quantitative measures such as good, fair, poor, excellent and other indicators become very vague and do not convey and useful information as it becomes subjective to a persons concepts about performance. Quantitative performance measures are preferred rather than qualitative measures and a measure of numerical performance can be used since such data would be available and because it may have been used for a long time. However, questions such as if a single or multiple organisations should be involved and if one or multiple products should be tracked arise. The following figure shows a typical supply chain with four levels and these are consumers, distribution, manufacturing and supply. Each of these levels may have multiple facilities and the supply chain would become complex when the number of levels and the facilities rises.
A number of characteristics are used for performance measurement systems and some of them are inclusiveness where all pertinent aspects are measured; measurability, where data needed is measurable and consistency, where measures are consistent with a company’s goals and targets. Benchmarking is also used in performance measure evaluation and it helps to identify opportunities for improvement. Some other performance measures are time, quality, cost and flexibility. However difficulties arise when question arise such as what and how often to measure, how to integrate more than one individual measure into a measurement system and the problem increases when such methods are to be started fresh. However, it is difficult to define a universal system since different types of systems would have different methods of measurement. Organisations have also used two main performance measures and these are cost, customer responsiveness and a combination of the two. The cost measure would include inventory-carrying costs and operating costs while customer responsiveness would include stock probability, lead-time and fill rate. In addition, activity time along with flexibility and customer responsiveness has also been used. However, the choice of performance measure would be based on certain strategic goals and the supply chain performance measures. Please refer to the following figure.
When a single performance measure is used then it would not be inclusive and there is a problem that the measurement system is not adequate. Certain strategic goals that are involved include some key elements for measurement of resources, flexibility and output. Resources measures such as cost and output measures such as customer responsiveness have been used in measuring the supply chain models. Therefore, the measure of a supply chain system should have three separate types of performance measures and these output measures, resource measures and flexibility measures. These are shown in the following figure along with the goal and purpose.
A further analysis of these measures is given as below:
- Resources: Measures for resources are personnel requirements, inventory levels, equipment utilization, cost and energy use. These are measured as minimum requirements or quantity or a composite efficiency measure. Efficiency evaluates the resources utilization in the system consumed for meeting the system’s objectives. Measurement of resources is important for measurement system. Lesser resources can negatively impact the flexibility and system output and using too many resources would artificially inflate the system requirements. An important target in supply chain analysis is to minimise resource. While a minimum level of output required, the effect caused by reducing resources on the flexibility is often ignored. It is possible to reconfigure a supply chain with reduced resources while demands are met by the dynamic nature of demands cannot be accounted for. Some of the resource measures are: total cost of resources used; Total cost of distribution and this would include handling and transportation; Total cost of manufacturing along with cost of labour, re-work and maintenance; Inventory holding Costs; Investment value of inventory; Inventory obsolescence Costs including spoilage; Work-in-process inventory Costs; Finished goods inventory Costs; Return on investment and this is a measures of the profitability and is the ratio of net profit to total assets (Beamon, 1999).
- Output: Measures for out put are: customer responsiveness that include, quantity and quality of the product. Some output performance measures are identified by numeric values such as: number of items manufactured; time required for production; number of on time deliveries or order. Some difficult to represent measures are customer satisfaction and product quality. Though costs for different levels of output may not be specified, the minimum level of output is usually stated. Resources would impact the supply chain output and the quality of output is crucial to determine the flexibility of the supply chain. In general, the performance measures for output should relate to the organisation and customers strategic goals, values and requirements. For some customers, rather than fast delivery, the delivery reliability is important while for others, delivery reliability is assumed but on time, delivery is important. Some of the measures of output performance are: total sales revenue, profit; fill rate or the proportion of orders that are completed immediately; target fill rate achievement, average item fill rate; on time deliveries, product lateness, average lateness, average earliness of order, percent on time deliveries; backorder or stock out, stock out probability, number of backorder, number of stock outs, average backorder; customer response time, Manufacturing lead time; Shipping errors and Customer complaints (Beamon, 1999).
- Flexibility: This measure is used to evaluate the ability to accept fluctuations and changes in schedule and volume. This is important in assessing the performance of a supply chain. There are two types of flexibility, response and range flexibility. Range flexibility refers to the extent the operation can be changed while response flexibility is the ease by which a process can be changed with reference to the cost and time. While it is not possible to make highly flexible systems as it can lead to idle capacity, the chain can be created to accept the changes of an uncertain environment. If the supply change is flexible then it can respond to changes in the demand, schedule, manufacturing unreliability, manufacture of new items, shortages from suppliers and this flexibility becomes important. Some of the advantages with flexibility are: reduction in number of backorders, lost sales and late orders; increase in customer satisfaction; capability to accept and respond to times where there is a breakdown in manufacturing; supplier fails to deliver raw material; delivery is slow and when new products are to be manufactured (Beamon, 1999). Slack (1991) has described four types of flexibility and these are Volume flexibility; Delivery flexibility; Mix flexibility and New product flexibility. Volume flexibility is the capacity to change the output levels manufactured and the supply chain would have a variable demand. Delivery flexibility is the capacity to change planned delivery dates and the supply chain would have the delivery dates change regularly and costs are associated with not meeting new delivery dates. Mix flexibility is the ability to change the variety of products produced and the supply chain would have a stationary demand for multiple product types. New product flexibility is the capacity to introduce and produce new products and take up modification of existing products and the supply chain is characterised by products with short life cycles.
Demand Driven Value Chain
The demand driven supply network works with the assumption that organisations have started to change from the earlier push type of supply chain to an innovation and supply ability, as required by customers. There is a move to transform the previous push model to the demand driven model. The main reason for this shift is that organisations that use the demand driven model are able to obtain financial returns for measures such as returns on investment, earnings per share and profit margins. Using a demand driven approach does not mean that everything is left to the market but it is the advertisers and savvy marketers that attempt to generate interest in products. The idea is to generate demand and then use the demand to drive production and fine tune the supply chain so that production is scaled as per the market demand and inventories and production just keeps pace with the demand. The whole concept of the demand driven value chain gives rise to a value chain. The following figure gives 12 dimensions that the demand driven transformation has to cover in the value chain (O’Marah, 2007).
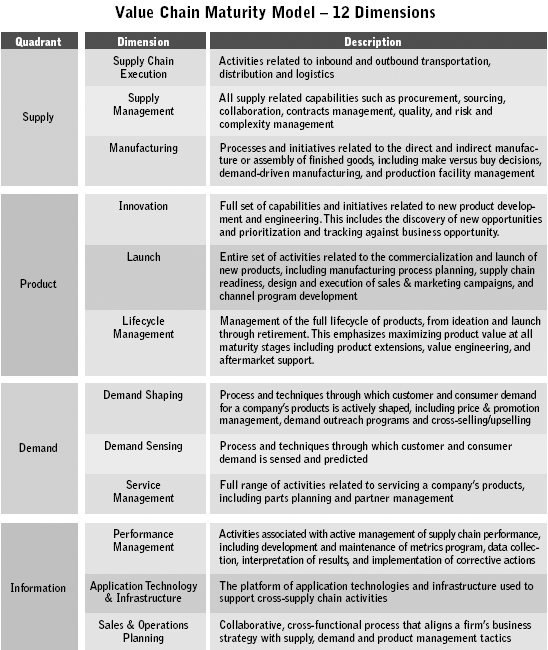
As seen in the above models, four core areas form the quadrants on which businesses operate and they are supply, product, demand and information. Each of the quadrants have a dimension in which they operate. In previous models, these quadrants were silos and did not interact dynamically and the relation that they shared was very rigid. As a result, supply, product and demand did not co relate and each acted almost independently of the other. So supply activities that included activities of manufacturing such as procurement, production, sourcing of raw materials and so on was not done to meet the demand of the market. As a result there was a certain skew ness and organisations either overproduced or under produced and the procurement of raw material and related inventories was always bloated and there would be huge stocks of products in various stages in the supply chain and a major part of the company’s money would be blocked in the inventory. The product on the other hand did not accurately follow the market demand and what was produced was never done by an analysis of the life cycle management techniques. Therefore, products that had declined in sales were also produced while innovation for product development was often delayed since the supply side was clogged with orders for obsolete products. The demand side was also lagging in intelligence since there was very little of demand sensing and demand shaping or efforts to influence the market with technology and product innovation.
To integrate these silos, information management became the enabler and with information, the impervious silos became conductive to information flow. Supply, product and demand became integrated and as a result, the required products that were in demand were supplied in the right quantities. The value chain went a step further and attempted to create a demand for ‘paradigm shift’ products such as the iPod and the iPhone.
Effects of Corporate Culture and HRM on SCM Strategy
McAfee (2002) has researched the role of corporate culture in encouraging or hindering the human resource relationships in supply chains. Corporate culture like an organisation’s personality and provides an organizational memory that reduces the need begin all over whenever changes in personnel occur. Organizational memory helps to control communication flows within a firm and among channel members by ensuring that norms continuity is affected. So shared norms suggest that the producer and seller have the belief that sharing of information is important and expected. Bur when shared norms are not supported by the organizational memory then the process of sharing information sharing would have lesser importance and would not be actively expected. When values are shared, then there is a positive influence on the trust and commitment between the channel member and a firm. HRM policies that have a direct influence and in turn are impacted by the corporate culture would have a significant influence on members of the supply chain. So decision of HRM are important since when employees are recruited that merge with the corporate culture then any actions that are taken help to enhance the consistency between the goals of the firm and the employee’s perceptions and actions. Following figure illustrates the interactions that occur between the corporate culture, supply chain orientation and HR policies. HR polices would impact and are in turn impacted by the corporate culture and this can produce in a transaction focus with staff from purchase, distribution and other employees.
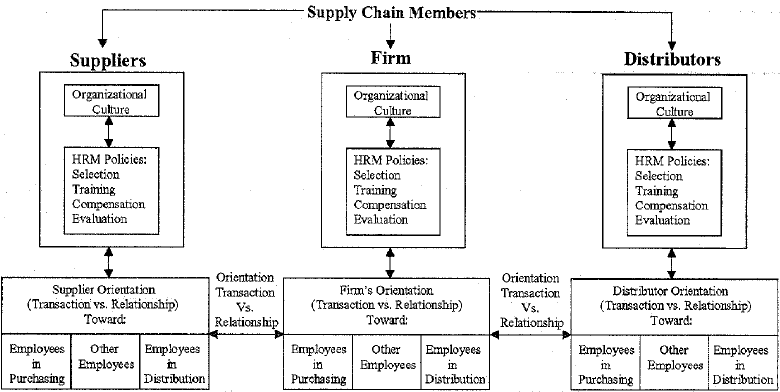
- Organisation culture: There are two main elements in the organisational culture and the first element is the shared nature of role expectations and nature of job. Over a period, after interacting with other employees, staff in an organisation inculcates an understanding of their roles and duties what is expected from them. Over some time, members of the supply chain also become aware of their expectations and the returns that in turn they can expect. So there are two aspects in the shared expectations and they are the external culture that impact expectations of the channel members and the internal culture that impact and influence employee behaviour and expectations. The next element is how stable the norms and values of the organisation are. Over a time with experience, employees exhibit certain norms of behaviour and the external supply chain network has certain predictable patterns so that members can anticipate certain behaviour norms and requirements of relations. In a normal organisation, the external culture and business relationship is impacted by the internal company culture. Therefore, consistency in culture is related to expectations that are met and both employees and channel members would have an understanding on how expectations should be met and take appropriate actions. In effect, the psychological contract has been me by both parties. When the corporate culture encourages growth and expectations are rationale, then the satisfaction among employees and the channel members would be high. When there is a conflict in the corporate culture then there are a number of unmet expectations among employees and this impacts the channel members. Such conflicts lead to dissatisfaction among employees and channel members and it would have detrimental impacts on the supply chain leading to insufficient information flow, higher inventory and more costs (McAfee, 2002).
- Culture and HRM: A symbiotic relation would be formed between the HRM policies and the corporate culture and each would affect the other. The main areas that would impact the organisational culture are recruitment, compensation, training and employee evaluation. Organisations have different measures for recruitment and while some give importance to educational qualifications, others may give importance to experience, communication and interpersonal skills, technical skills, work ethics and so on. There is a conscious effort to find if the person would fit the company culture. Some organisations offer intensive orientation and on the job training and larger organisations spend as much as 700,000 USD on initial training costs, just to ensure that the employee is ingrained with the right corporate culture. Compensation packages differ among organisations and while some provide top of the market compensation, other tend to follow the medium or lower levels of compensation. Larger companies are known to offer very good salaries in the hope of encouraging employees to give their best while other companies such as McDonalds and Tesco would give lower levels of compensations. There has been actually very little evidence that top salary payers are more profitable or efficient when compared to organisations that offer medium levels of pay. The last factor of HRM that influences corporate culture is the employee evaluation and appraisal and there is again a difference in the levels observed. While some organisations take appraisal seriously other take it casually with the result that high performers do not receive any additional benefits (McAfee, 2002).
- Relationships in Supply Chains: Supply chains have a number of combinations of relations among members and these can be evaluated by the collaborative linkages and partnerships that are formed between them. The relations strength can range from distant to cordial to close and integrated and would assume the form of a diamond configuration or a bowtie. In a bowtie, two triangles intersect at certain points and represent the interaction where a buyer would contact a seller. In a diamond configuration, the two triangles are aligned along the longer length and would allow multiple members from both organisations to interact with each other. So typically, engineers, managers, information processing people, contract procurement staff and quality control staff would interact.
Cooper (1997) suggests that there are three variables that specify the relations and these are management experience, time constraints and characteristics of the market. The author also points out that there are other variables such as uncertainty frequency geographic area and many others and these are shown in the following figure.
As seen in the above table, the variables can have a major impact on the supply chain performance. A cordial corporate culture helps to lessen the negative impact of these variables.
Cluster Theory and Supply Chain
Porter (1998) defined clusters as “groups of interconnected firms, suppliers, related industries and specialized institutions in particular fields that are present in particular locations”. According to the Porter, competitive advantage for a company is produced by the value that a firm is able to create for its buyer and this can be diagnosed through the supply value chain. He has further argued that innovation, improvement and change is critical in forming a competitive advantage by applying better methods to compete in an industry. Firms that operate in a cluster will manage to gain advantage over the national and international competitors if they can find new and better methods of production, building an economical supply chain, design, linking elements of the value chain and permit knowledge spill over. For industries in a cluster to thrive, they need to manage and administer the whole supply value chain made of vendors, buyers, suppliers, distribution and sales channels and the employees.
Kuah (2002) while prescribing to the Cluster theory points out that the cluster theory is not new and since biblical times, certain regions have carved a name for themselves. Citing examples of the ship building industry of Glasgow to the IT sector of Silicon Valley of US, steel instruments from Sheffield UK, the Indian IT industry and others, the author argues certain regions became famous cluster because of the availability of natural resources or because the climate favoured growth of items such as tea, precious metals, crops and so on. But the fact remains that clusters enjoy a tremendous advantage in the form of a pool of skilled personnel, higher influx of technology, scale of economies and when managed properly, clusters do help a particular industry, community or group of people to grow.
With the present concept of global economy, Garelli (1997) suggests that that the ‘economy of globality and proximity would tend to be a major force in a market’. By being global, the production mechanisms can be situated in one continent and the end users in another and with improvements in communications and transportation, the world has become a global village and physical distance is no longer a barrier to international business relations. Multi-national corporations thrive on tapping international resources such as cheaper labor, raw material and location advantage for added competitive advantage. This phenomenon needs to be seen in light with Porters cluster theory and the concept of the cluster would now include production clusters in small towns of India and China that again make use of the cluster relationship to provide products at economical rates.
It can be deducted from the above discussions that the key factors for a cluster to be successful are: enhanced supply chain, disbursing benefits to members in the community and a willingness to adopt new technology and ideas and to firmly believe in innovation. The most important element for a cluster to be successful is a sustainable supply chain.
Tom (et all, 2006) has used the Porters Cluster Theory to analyze the performance of the Amish Furniture industry. According to the author, the Amish people, who settled in the plains of US have a long history of farming and the related trade. Since a few decades, they have ventured into the manufacture and sales of special fine hand crafted furniture items. According to the author, the Amish furniture industry is concentrated in small clusters of community and is made up of multiple levels. A schematic illustration is provided in below.
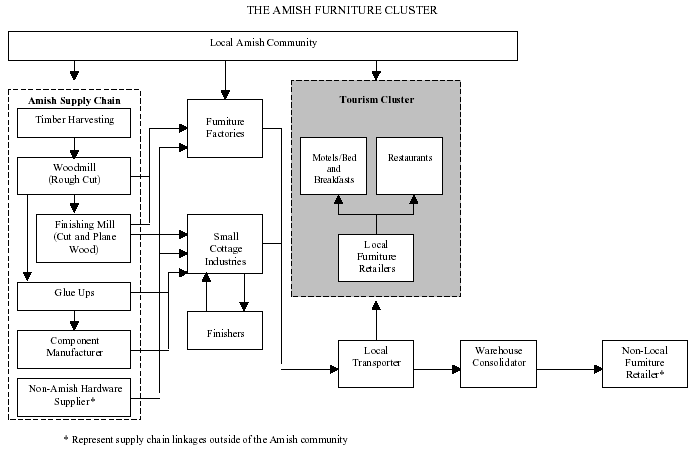
As shown in the figure, there are a number if clusters that make up the Amish furniture cluster. The furniture is manufactured by furniture factories and also by small cottage industries and these form one cluster. Other clusters of the supply chain include the raw material suppliers who supply lumber and tools, glue up units, component manufacturers and finishers. This is one side of the supply chain where the actual procurement and manufacture of goods takes place. The other clusters are the transporters who transport the finished products to tourism centres, restaurants, hotels and to non-local furniture retailers. On first glance, there is nothing special about this arrangement. However, the success of the Amish Furniture industry lies in the manner in which each cluster communicates and cooperates with each other.
Tom (2006) reports that other than the furniture factories, two or three people run the other enterprises and there is a very high degree of commitment and responsibility among the people. In the supply chain, there would be more than one group of furniture factories, cottage industries, finishers, lumber processing units and so on and these form small clusters of communities of the same profession. Each cluster cooperates with the other, communication lines are open and consequently, the turn around time and time to market is very short. Raw lumber is purchased from large lumber selling companies by the wood mills who anticipate the requirement for lumber against the orders placed by the furniture manufacturers. The wood-processing phase takes a few months since the logs have to be cured. Once the processing is done, the processed lumber is either directly sold to the furniture factories who use their own infrastructure to further process the lumber. Small cottage furniture manufacturers prefer to get it finished by the Finishing Mills. There are also other elements such as the component manufacturers; the glue ups units and other non-Amish hardware suppliers. The furniture manufacturers then prepare the furniture and deliver it to their markets through a network of local transporters and warehouse consolidator.
Tom points out that the Amish furniture cluster is the best example of not only an excellent supply chain but also of lean manufacturing. By operating in dedicated clusters, individual units are more productive. The cluster allows better access to suppliers, information related to business opportunities, complementarities between businesses, access to institutions and public goods, and better motivation and measurement. Since there are specialists in the form of glue up operators, component manufacturers and hardware suppliers, the initial financial outlay of the small Amish cottage industry owner is decreased. He can procure expertise from the supply chain without incurring undue cost. Tom reports, “there are no great fluctuations in demand for labour, as manufacturers are often content to produce just enough to maintain a comfortable living. When faced with increased production demand, firms are faced with three alternatives: work longer hours, hire more labour, or extend lead times. More often than not, manufacturers choose to extend lead times rather than compromising on quality or impinging on time with family“.
According to Tom, personal relationships and community ties foster trust and facilitate the flow of information. An important fact pointed out by Tom is that while pride and the desire to look good in the community drives Amish manufacturers to excel, the motivations for doing so are typically based on a desire to maintain group norms and standing within the community, rather than an overt attempt to outdo a competitor. Members of the Amish furniture cluster have adopted a set of underlying operating principles that are driven by a desire to maintain an individual’s own reputation for fine work rather than downgrading the reputation of competitors. The concept of price cutting or increasing the price to make profits does not exist. Members of the cluster are open to demands from customers to make different products, introduce new designs and there is regular innovation in their work practices. Since glue up and components clusters are nearby, they can be given small trail order that allow new designs to be tried out at minimal costs.
These practices go hand in hand with what Porter has suggested that “in the future, a firms competitive advantage will not be determined chiefly by greater efficiencies in the sourcing of inputs, but rather by the ability of firms to exploit the resources available in the “cluster” or network of local individuals and companies, in which they operate“.
Desrochers (et all, 2004) has pointed out some drawbacks for the Cluster theory. According to the author, such clusters perform very well when the economy is fine, but they can quickly break up with any changes or downturn in the economy. If any one link fails, then the whole supply chain would collapse. In the Amish industry for example, if the local lumber producer fell for some reason, then the furniture manufacturers would not have the required contacts or the means to procure the items in sufficient volumes themselves. Suppose a drought broke out in the region, then the local buyers would disappear and there would not be sufficient customers. The authors also point out that being a closed community; entry barriers are very high for non-Amish manufacturers who would wish to set up units in the areas.
The Value Chain
The value chain concept was first introduced by Michael Porter and it can cover all activities such as supply chains, logistics and distribution networks, services, marketing and sales lines, procurement and so on. In any business process, there are different categories of value adding tasks and these form the elements of the value chain. (Doyle Peter, 2002).
The categories are inbound and outbound logistics, production or operations, marketing, sales and services. There are also a number of support activities such as procurement, administrative, HR and infrastructure management, R&D, etc. Each of the activities have a cost and value attached to them. During delivery of products, each of these value chains combine and create a value system. The value system includes the organizations suppliers and their suppliers, the organization, consumers and so on. It is the goal of the managers to maximize the value and reduce the costs. SCM and logistics work with value chains and try to increase the efficiency while reducing the costs.
Case studies of SCM Implementation
The previous chapter has focussed on theories and concepts related to SCM. In this chapter, a few cases of SCM implementations have been presented. These cases bring to light the actual practices from the field and how organisations have managed to build robust supply chains. The chapter presents some successful and some failed cases of SCM implementation.
Tesco Meat Supply Chain
The case study analyses the Tesco Meat Supply Chain. Tesco is is the largest food retailer in UK and has stores in France, Ireland, Eastern Europe and South East Asia. The group turnover in 2002 was more than 22 million GBP and the company has more than 240, 000 employees. The company sources its food products such as vegetables, groceries and meat from various suppliers across the globe (Lindgreen et all, 2003).
Problem Statement
Tesco had problems with its meat supply division. In 1996, there was a huge scare across the world from reported diseases such as the mad cow disease (bovine spongiform encephalophathies), foot and mouth disease and other epidemics that had swamped the meat industry. Wide concerns were raised in the media and the public about the hygiene and safe procedures used in the meat processing industry and this resulted in Competition Commission code that set guidelines in the safe practices regarding meat processing. These codes were very strict and difficult to follow and there were many gaps in the Tesco supply chain that would make compliance very difficult. Tesco relied on hundreds of small time animal farmers and slaughter houses and it became increasingly evident that the existing meat supply chain was too haphazard and compliance with the codes would be very difficult. The weekly requirements of meat products are estimated at 6000 cattle, 80, 000 pigs, 20, 000 lambs and 1, 200, 000 chickens. An analysis of the existing meat supply chain is shown in the Figure 1.
/var/www/blog-sandbox.itp/wp-content/uploads/2021/09/192259_21.jpg 576×428 8bit N JFIF [OK] 21583 –> 21248 bytes (1.55%), optimized.
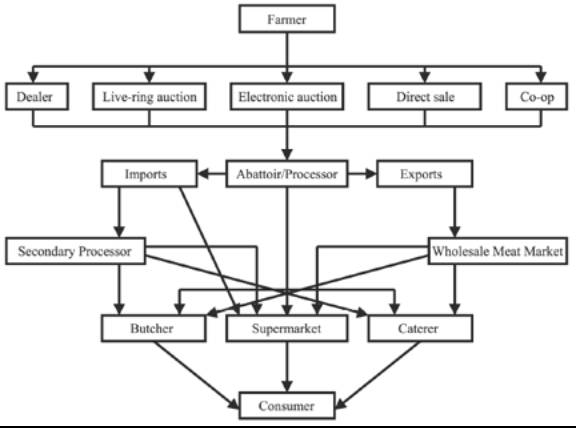
There were multiple supply chains and while the farmer was the main source, the products flowed from multiple mechanisms such as dealers, live rings auctions, electronic auctions, and direct sale and through cooperatives. To cater for excess demands and because of price differentials, livestock was also imported. The livestock was slaughtered in abattoirs and the processes meat went through multiple point of sales before the meat reached the consumers. The problems statement was that the existing meat supply chain had to be redesigned to comply with the Competition Commission code regarding quality and hygiene.
Solution
A research team from Tesco, interviewed managers with face-to-face interviews and through questionnaires and this resulted in an understanding of the complex chain (Hoek, 2002). A partnership was developed with the animal farmers and they needed to comply with the Standard Code of Ethics, framed by Tesco. The code of ethics was based on principles enshrined in the Farm Assured British Beef and Lamb agreement, Farm Quality Assurance Scheme, Code of Recommendations for Cattle Welfare (Basnet, 2004). Suppliers were treated as partners and they had to follow strict guidelines such as ensuring animals were killed with the least painful methods, animal feeds used the least chemicals and anti microbial, responsible use of medicines, slaughter houses complied with the standards for meat processing, storage and hygiene and so on (Cox, 1999). Tesco then redesigned the supply chain and this is illustrated in Figure 2.
/var/www/blog-sandbox.itp/wp-content/uploads/2021/09/192259_22.jpg 576×473 8bit N JFIF [OK] 12492 –> 12101 bytes (3.13%), optimized.
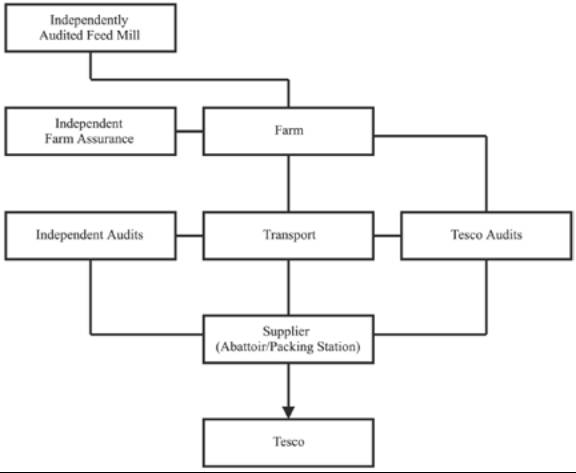
Tesco developed a centralised distribution system and bought directly from suppliers who had to be certified by Tesco’s Quality Assurance program. The meat products are distributed directly to the central warehouse and distributed to the retail outlets and the role of wholesalers and distributor has been greatly diminished and made non relevant.
The redesigned supply chain assured the quality of meat products, ensured safety and hygiene for consumers, created a reliable supply base for Tesco and gave assured business for suppliers.
General Pump Supply Chain
General Pump Corporation started as a distributor of high pressure positive displacement plunger pumps. Through its subsidiary Noramco, it designs high pressure nozzles and pump thermal protectors (Kumar et all, 2001).
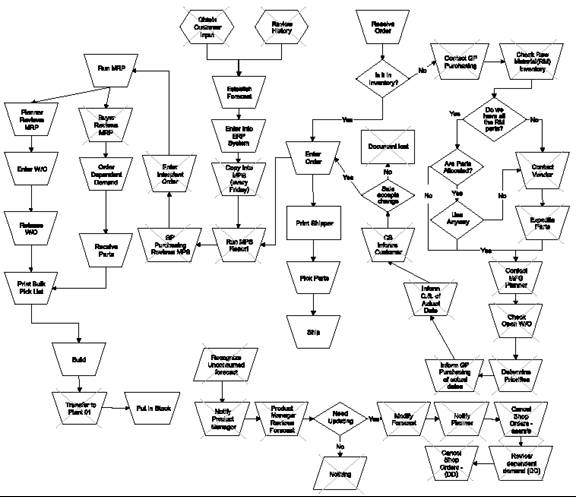
Problem Statement
The company used an ERP system with General Pump and Noramco as separate facilities. Forecasting was done at General Pump and interplant orders were processed to pull products from Noramco to General Pump using the MRP Program. The system could not respond to changes in demand and when demand was lesser than forecast, work orders already generated based on the forecast where not adjusted to reflect demand drop. This created an artificial increase in capacity requirement and inventory. According to Quayle (Quayle, 2005) work orders generated were for expected demands and not net requirements. Inventory correction measures were done every now and then and corrections were done in the work orders to adjust for the excess inventory. This resulted in gross shortages for certain items as they had a long lead-time and the production teams responded by producing more items that lead to excess inventory.
The problem statement was that the inventory had to be reduced by creating an accurate forecasting method, smoothening the production flow and by eliminating unnecessary steps. Figure 4 gives the original process flow. In the illustration, X means steps that were subsequently eliminated.
/var/www/blog-sandbox.itp/wp-content/uploads/2021/09/192259_23.jpg 576×497 8bit N JFIF [OK] 44870 –> 44477 bytes (0.88%), optimized.
Solution
The original process flow had more than 50 steps and these were analysed for the value addition and the wasteful steps were eliminated so that the final flow had 17 steps. The team analysed the consumption patterns and found that more nozzles were sold in the summer construction season but the production level had to be maintained throughout the year since there was a capacity limit at Noramco. An accurate response process was implemented that allowed the company to predict probability of sales by nozzles and balanced the capacity during off season period. They brought in concepts of Kanban, lean manufacturing and synchronous manufacturing (Narayanan et all, 2000).
/var/www/blog-sandbox.itp/wp-content/uploads/2021/09/192259_24.jpg 550×864 8bit N JFIF [OK] 32382 –> 31750 bytes (1.95%), optimized.
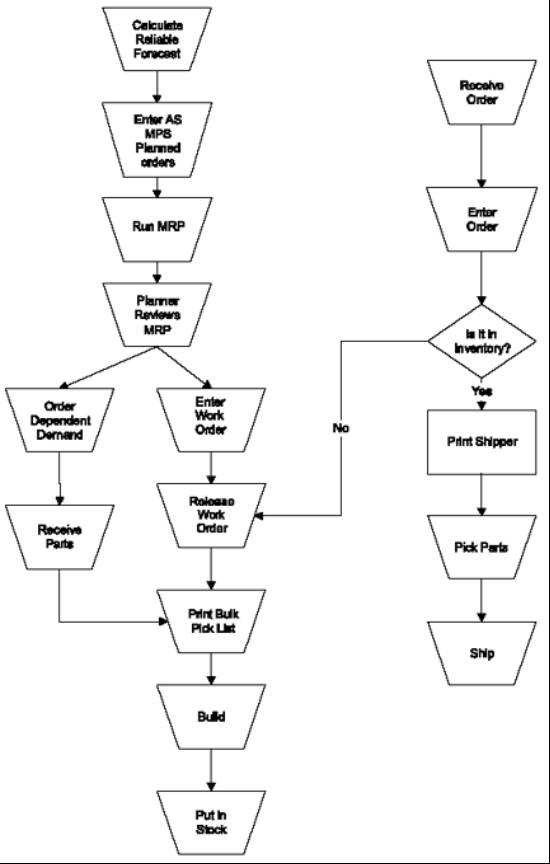
The redesigned supply chain with the enhanced forecasting method allowed optimum work orders where excess inventory was eliminated. Accurate forecasting ensured that work orders for the required nozzle type and quantity were raised as per the market demand and the redesigned process flow ensured timely production of nozzles.
Vegetable SCM in Asia
Ruben (Ruben et all, 2007) has reported that buy side model of SCM and logistics has become a major strategy in sourcing fresh vegetables in emerging East Asian countries. The study examined Huacheng supermarkets in Nanjing City of China, TOPS supermarkets in Bangkok Thailand. The results showed that small suppliers delivered in small lots, in non-refrigerated trucks, non-standardized crates and high variations in price and quality and it took up to 50 people to grade the produce. The small suppliers were also unreliable and stock outs were a frequent problem. In 1998, Ahold initiated the World Fresh distribution centre named TOPS where a group of preferred suppliers was created. Figure 6 shows the optimisation in variable costs and the higher margins that were realized by eliminating middlemen and reducing the transportation costs.
/var/www/blog-sandbox.itp/wp-content/uploads/2021/09/192259_25.jpg 506×248 24bit N JFIF [OK] 19402 –> 19360 bytes (0.22%), optimized.
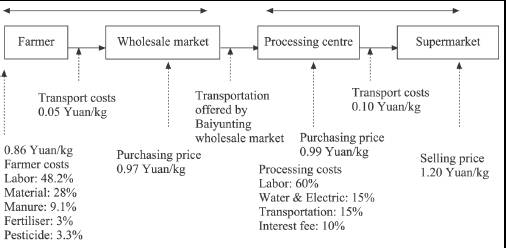
These suppliers were offered long term delivery contracts based on quality, quantity and prices; use of standardized crates, trimming and grading and refrigerated transport if required, backward chain control to trace the produce backward. This arrangement produced about 40% reduction in the costs, reduction in lead-time, assured quality.
Msimangira (Msimangira 2003) has suggested that SCM in developing countries has not matured as much as the developed countries and this is because of a lack of managers to recognise the importance and also because the top management does not support the effective development of SCM functions. In some developing countries of Africa, purchasing is not recognised as a profession and the purchasing activity is not centralised but buy decisions are made by various departments. The author has conducted research to show that a majority of organisations do not have a purchasing policy manual and purchasing is regarded as an extension of the finance or accounting department. The importance of purchasing is realised only when there is a stock out of items. Among the problems reported by Msimangira are that organisations do not critically evaluate vendors, there is no market survey, poor inventory management and other issues.
Toy Retail Industry
Wong (Wong et all, 2005) has studied the SCM practices in the toy store industry. The reports analyses the toys market and suggest that the nature of this market is very variable, with very specific and short selling windows and short life cycles. The customers are toddlers; kindergarten kids, pre teens and their preferences are very unpredictable. Consequently obsolete inventory of unwanted goods, high-unsold goods costs are a frequent occurrence and unsold stock has to be frequently disposed off through discounts and markdowns. The main requirement here is to provide the right shops with the right types of toys, in the required quantity and at the right time. Types of toys include dolls, action heroes, puzzles, building sets and so on. Point of sales are supermarkets, department stores, discounters and toy specialist shops and hypermarkets. There are three types of retailers: just-in-time (JIT) or pull retailers, main-order retailers and one-off or push retailers and they use different SCM practices. JIT or pull retailers are toy specialists and discounters who use 20% push and 80% pull practices. Main order retailers are department stores, discounters and hypermarkets with 60 % push and 40% pull while one off retailers or push retailers.
Studies and interviews by the researchers have suggested that these retailers wish to reduce the risk of inventory and markdown by implementing the demand-driven (JIT) model and therefore initiating supply chain initiatives such as accurate response, cross docking, and CPFR. Figure 8 gives an illustration that details the SCM practices for three different types of toy retailers.
/var/www/blog-sandbox.itp/wp-content/uploads/2021/09/192259_26.jpg 576×608 8bit N JFIF [OK] 57496 –> 57041 bytes (0.79%), optimized.
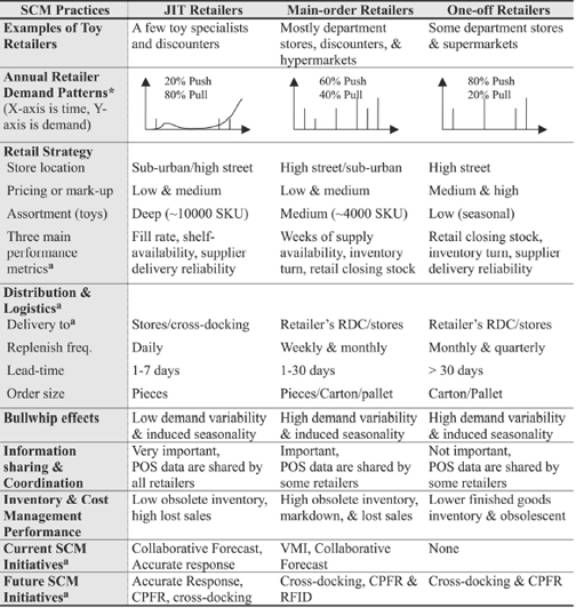
The study concludes by arguing that the volatile nature for toy demand and these retailers’ wishes require toy manufactures to be more market responsive; however, most toy manufacturers have responded with the traditional mass production strategy and low market responsive.
Zara Fashion Retail Supply Chain
Anderson (Anderson J, 2005) has conducted research on how Zara manages its supply chain in the fashion and apparel industry. Zara is a steady fashion and apparel company with its headquarters in Spain. The company has 650 clothing stores in 50 countries and it offers apparel to men, women as well as children. Zara has introduced some unique concepts in retail clothing and it does not overstock the stores but maintains a bare inventory and the items are always in demand. Consequently, customers wait for the arrival of stocks and the stocks are quickly sold out. The company has structured its operations around the head quarters in La Coruna and controls all operations from this place. All activities such as design, production and marketing are controlled from the centre hence there is no need for expensive and complex planning software. The company maintains different lines for men, women and children wear and this ensures that a problem in one line does not affect the others. Zara does not utilize its full capacity and the reason is that full capacity utilization, there would be no way that it can offer quick response to any market demands. It however has set strict deadlines for the ordering patterns from the store managers across the globe and the delivery is strictly implemented. These practices have resulted in maximum profits with low investments and funds blocked in inventory.
Grocery Retail Store
Holmström (2002) has researched the status of European grocery suppliers who face unique problems of catering to country and region specific variations in the product demands. With variations in product demands, the service and efficiency for large and central regions can be maintained but severe problems are encountered in the smaller markets. The variations increase the transaction volumes by a factor of 10. Holmström has argued that the key business decision for the supplier is whether to provide good service for customers in all regional markets or not. If yes, then he argues that supply service levels are not based on sales volume but are provided according to the role of individual products in specific markets. An argues that an extended local supply chain with a complex “many-to-many” supply chain structure, cannot achieve good service efficiently and that a hub-and-spoke supply chain structure is a viable alternative.
Music Industry Supply Chain
Graham (2004) has prepared a case study on the impact of the Internet on the supply chain for music which is a 38 billion US$ industry. According to Graham, the music industry was dominated by the big 5 recording companies: EMI, Sony, Universal-Vivendi, Time Warner and Bertelsmann BMG and these companies control the supply chain of about 90% of the market and prevent artists from distributing their own music. With the wide spread use of the Internet, illegally downloading and distributing music and piracy has undermined the dominance of the big 5 recording companies. The authors suggest that companies such as Amazon have proved that there is no real need to have a physical, brick and mortar store and thus the supply chain becomes truncated as these middle-agents become redundant. This dilutes the position of the big companies and with the increase in piracy, the bottom lines of these companies as well as the artists face erosion due to lost sales. The authors suggest that a number of virtual companies would be quick to step in and act as virtual coordinators between the artists and the consumers and this changes the music supply chain. Following figure provides an illustration of the traditional and the future supply chain.
/var/www/blog-sandbox.itp/wp-content/uploads/2021/09/192259_27.jpg 505×131 24bit N JFIF [OK] 11396 –> 11365 bytes (0.27%), optimized.
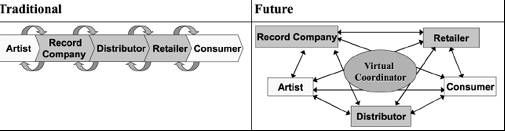
Wal-Mart Supply Chain
Wang (2006) has conducted extensive research into the IT systems that are used at Wal-Mart. The author has reported that the company is increasingly using RFID tags on the consignment and this allows them to know the exact location of a shipment and know when a shipment would be delivered. The company has used web-based interface for electronic data exchange – EDIINT AS2. In addition, the company uses NeoVista data mining software developed by JD Edwards and this allows the company to deeply understand the buying patterns in different ethnic groups, predict seasonal variations in demand, adjust the sales forecasting intelligently and in an informed manner and reduce the inventory.
Rhee (2007) has argued that individual systems in a supply chain should be able to communicate with each other. He has suggested that when the vendors are big enough and have been around for sometime, they will have their own legacy systems while the buyer may have a different IT system. Some vendors may be suppliers to other retailers also. For the supply chain to function, the IT systems is able to speak with each other, exchange data, accept work orders and so on. If this cannot be automated and operators are required to type data from one system to another or to look at Fax or emails and then feed in the order, then there can be human errors and the supply chain develops bottlenecks. The author has said that Wal-Mart uses a web based and SOAP driven IT system for the supply chain as shown in the following figure.
/var/www/blog-sandbox.itp/wp-content/uploads/2021/09/192259_28.jpg 577×350 24bit N JFIF [OK] 24876 –> 24798 bytes (0.31%), optimized.
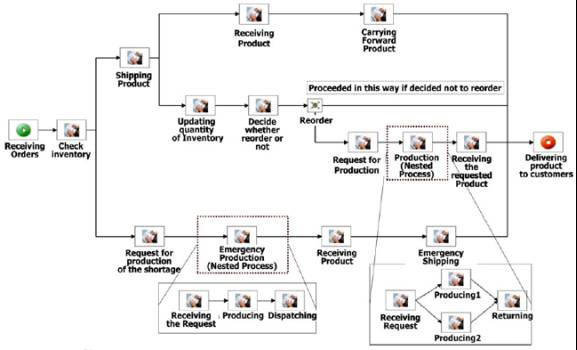
As seen in the figure, the process begins when the buyer places an order for a large amount. The vendor reviews the order, checks the inventory and if sufficient stocks are present, then the order is completed and the goods despatched. If the stocks are not sufficient, then the supply chain is initiated with the vendor placing order for the material and so on.
Toyota Supply Chain
Since the Toyota motor company was created in 1937, the Japanese automobile manufacturer has risen to the position of the 3rd largest auto manufacturer in the world. Its has set certain new standards and concepts such as the Toyota manufacturing practices, Kaizen, six Sigma and others that have raised the standards for productivity and quality. The company has managed to replicate its success in not only Japan but also in other countries where it began off shoring operations. The company has managed to perform the transplanting operations and reproduced its business activity’s in US, Europe. India and many other countries and has recreated its management philosophy, work methods and adherence to productivity.
Fang (2003) has suggested that the famed Toyota Production System (TPS) that was established by the famous Taiichi Ohno has been applied to all aspects of the outsourcing model. The authors have defined Off shoring as the relocation or creating afresh, the infrastructure and processes from one country to another. Off shoring may be utilized for the transplanting of production, services, backend services, call centre operations, help desk support and other business functions. Outsourcing is the process of procuring core and non core business function and services from suitable vendors. The term outsourcing includes parts ad spares manufacturing, procurement of raw materials, finished goods, apparel, automobile components, outsourcing of intellectual work such as market research and others.
According to the Paul (et all, 2005), when Toyota decides to offshore manufacturing base in another country, it either opens a fully owned company if the rules of the foreign country permit or it may decide to take a partnership with a like minded partner who values the principles of Toyota manufacturing company. Other than recreating the manufacturing process by buying machines and testing equipment, the company extends the TPS model to cover other areas such as maintaining a flat corporate structure that empowers individuals to strive for excellence, hiring practices that favour the young and inexperience but who can be moulded to easily adapt to new trends, teamwork where each member helps the other in achieving goals, establishing two way open communications where people are urged to speak about their problems; non-monetary awards where individual recognition is given to people who excel in their work and by introducing a pay bonus system. The off shoring model tries to reduce the impact between efficiency and flexibility and tries to ensure that the new companies are able to change their process and methods quickly to manufacture new models as and when required. Regassa (et all, 2007) has argued that while the US car manufacturers such as GM and Chrysler have reported losses of billions of dollars, the Japanese manufacturers such as Toyota, Nissan, Honda, Suzuki and others have turned in healthy profits. The authors argue that this success is primarily due to the huge cost savings that these companies have procured by using the successful model of off shoring and outsourcing.
Toyota has set up companies in any countries and while some of them are fully owned by the company, others have been done with collaborations with foreign companies. Toyota has overseas facilities in 27 countries and regions and these are made of 52 production centres and eight overseas offices. There are also R&D and design centres in seven locations showing that the off shoring is extended from development and design to production, sales and service, Toyota has achieved consistent globalisation as well as localisation. Some of the countries in which the company has fully owned manufacturing establishments are Australia, Canada, France, Indonesia, Mexico, Thailand, Turkey, United Kingdom and the United States. Countries where the company has opened manufacturing centres with collaboration with local companies are Czech Republic, Pakistan, United States, India and Vietnam. In many instances, the models that are manufactured are directly for sale in the local market while a small percentage are also exported to other countries (Ina Koichi. 2007).
3.10. Amazon Supply Chain
Amazon is a outstanding example of the new age economy company or the virtual organisation. The company does not have any manufacturing facility of its own or a large warehouse and other such facilities but is purely based on the Internet and supported by an outstanding IT development team, very good marketing and excellent vision of the management. There was nothing of a legacy system that could be upgraded to a modern IT system and everything was developed from ground zero. The system is illustrated in the following figure.
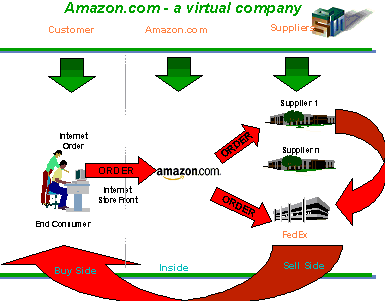
Amazon sits as a gateway between the consumer and the supplier and while the consumer makes the buy side, the supplier makes up the sell side. Amazon has a huge database in which information about the suppliers, products offered, rates, location, lead time for supply and other details are maintained. When a consumer decides to buy an item and places the order, details of the location where the item is to be despatched is found out. The company has arranged the suppliers in all strategic locations and the software application immediately trawls its database to find out the nearest supplier to the desired delivery location and the time estimate and cost as to when the delivery would be made is calculated and displayed to the user. Once the user makes the buy decision by entering the credit card information, the order for despatch is relayed instantly to the supplier and at the supplier end, the order to pack and despatch the product is relayed, all through computers. When the supplier confirms the date and time of delivery, an order to pick up is despatched to the courier or logistics company and the customer then gets the product. Four companies are involved and they are Amazon, Credit Card Company, Courier Company and the supplier. The supply chain works in such a manner that at no point is Amazon faced with dead inventory or the supplier is forced to carry excess inventory and the courier is not made to make idle visits and the whole system works on cash and not on credit basis.
Nike Supply Chain Disaster
Koch (Koch, 2004) analysed the supply chain disaster at Nike. The company has a global presence with a turnover of 20 Billion US$ and makes sports shoes and sports apparel and has a market share of 39%. Nike was using a demand planning software made by i2 and problems with the software, poor understanding of how to use the software caused wrong work orders to be placed with the subsidies. Excess orders were placed for the ‘Air Garnett’ shoe models while lesser order were placed for the ‘Air Jordan’ shoe model and this created a loss of 100 million US$ besides causing a 20% loss in the share prices besides other losses.
An analysis has revealed that i2’s predictive demand application and its supply chain planner that maps the manufacturing of specific products used different business rules and stored data in different formats. This made integration of systems difficult. The i2 software had to be extensively customized so that it could communicate with Nike’s legacy systems. This resulted in long delays and it took almost 1 minute to record a single entry. Since Nike had millions of product numbers, the system frequently crashed.
The system ignored some orders, duplicated others, deleted ordering data six to eight weeks after it was entered and this made it impossible for planners to understand why the order was placed with a subsidiary. The market demand for Air Jordan’s was more while it was less for Air Garnett’s and the system reversed the numbers so that more of Air Garnett’s and less of Air Jordan’s were produced.
The WebVan Supply Chain Disaster
WebVan was an on-line grocer that was backed by Goldman Sachs and others. The business model was such that registered users would login to the website, select the groceries they wanted, pay through online payment systems and the company would despatch the groceries to the users address (The WebVan Story, January 2006). The grocery business typically has very low margins and an online grocery store is expected to have wafer thin margins (James, 2004).
The company raised billions of dollars by going public and then went on to erect heavily automated warehouses that cost up to 30 million US$ each. The management decided to automate the whole business so that once the order was placed, the order would be processed by the automated warehouse that would arrange to pack and despatch the shipment. The management did not realise that huge volumes was needed to break even with the capital costs. The high volumes were never realised and the company went bankrupt within a year.
Other SCM Disasters
There have been quite a few disasters in SCM implementation and these are given in Table 1. It should be noted that most of these incidents happened before 2000, when SCM software had not yet matured. While some of these disasters happened due to software glitches, the other disasters happened because the management made bad decisions and it was too dependant on the promised wonders that software alone could deliver the solutions.
/var/www/blog-sandbox.itp/wp-content/uploads/2021/09/192259_30.jpg 576×617 24bit N JFIF [OK] 74772 –> 74579 bytes (0.26%), optimized.
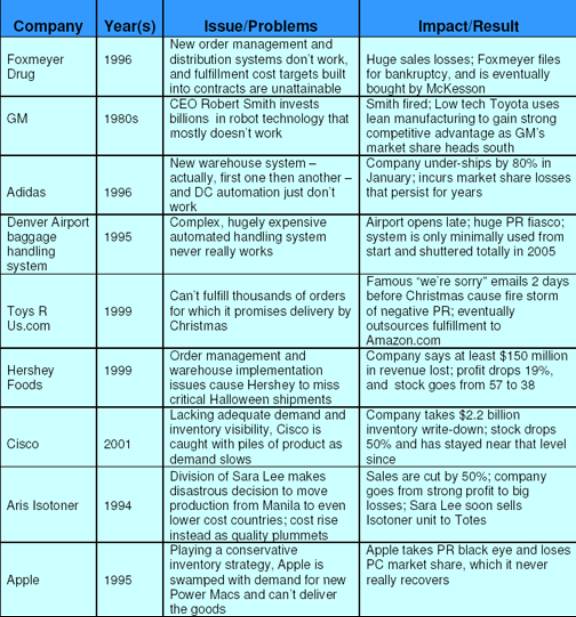
Conclusions
The extensive review of peer-reviewed journals has provided a wealth of information that would serve as guidelines for company’s that wish to implement supply chains. The conclusions of the paper are presented in this section.
The Bullwhip Effect occurs in forecast driven channels. This refers to an amplifying effect that is inherent in supply chains that try to maintain a buffer stock so that any upsurge in demand does not result in stock out’ situations The effect can occur due to uncertainties in the supply chain with regards to cost, schedules, political fallout, scarcity and other factors. The bullwhip effect, induced within the supply chain greatly increases the level of risk for each partner. The further the partner is from the marketplace, the greater is the likely increase in risk. Therefore, for the supply chain as a whole to remain competitive, it is essential that each value stream be engineered to minimise unnecessary bullwhip. The effects can be countered largely by information sharing in the supply network to reflect the actual demand from the inflated demand.
Quick Response – QR is a technique where vendors and buyers partner with each other and share information so that they can respond quickly to the customer requirements. QR is needed when information flowing through a soppy chain is distorted and a bullwhip effect is created. This produces large variance in the purchase order when compared to the sales made to the buyers. There is a subsequent distortion in the demand and the information gets amplified as the information travels upstream. Members in the supply chain that receive information only from the immediate node will be mislead by the information and there is a subsequent false increase in demand. As a result, more products are manufactured and the inventory levels increase and this can cause losses to the vendor, clogging of warehouses and additional load on the transporters. Information and cooperation is the key for effective control of QR and this would lead to reduction of the negative effects of bullwhip.
Cross Docking is a strategy used for warehouse management where goods are transferred directly from the receiving station to the shipping station. This means that the material is not stored in the warehouse but directly transferred to the shipping station. Receiving and shipping stations can be trucks, airplanes, ships or locomotives. This technique can help to very much reduce the cost of transportation and warehousing storage and ensure that inventories are maintained to the level required by the customer service. The technique can also reduce the processing and order cycle timing and results in improving the response and effectiveness of the distribution network. Use of cross docking requires very fine adjustment on the input and the output side. Cross docking is not a means to cover delays in supply and if a outbound truck is kept waiting for the input truck to arrive, it is not cross docking.
Different types of warehouses are consolidation warehouse, break-bulk warehouse and mixed warehouse. In the consolidation warehouse, goods from different vendors may be sourced in less than FTL or LTL and the warehouse in located at a central place near the vendors. From this warehouse, FTL are shipped to other locations and thus the warehouse helps to ‘consolidate multiple LTL into a larger FTL. This ensures that the transportation costs are reduced. In a break bulk warehouse, the reverse process of consolidation warehouse is used. Bulk material is input as FTL from multiple vendors or even a single vendor. This input goods is then split or broken into smaller sized lots and then output as LTLs or in smaller vans for retailers and distributors who may be located in nearby areas. In the mixed type of warehouse, a combination of the two methods is used. Goods are received as FTL from different vendors to the warehouse and there could be multiple products. The FTL is then broken up and consolidated as different FTL shipments and there may again be different products in the FTL. The FTLs are then despatched to different retailers and distributors as per the orders. There is no right or wrong type of warehouse and each type is appropriate for a work process.
Performance of supply chains is very important but the issues of measures to be adopted arise. The measure of a supply chain system should have three separate types of performance measures and these output measures, resource measures and flexibility measures. Measures for resources are personnel requirements, inventory levels, equipment utilization, cost and energy use while measures for out put are: customer responsiveness that include, quantity and quality of the product while flexibility measure is used to evaluate the ability of a network to accept fluctuations and changes in schedule and volume.
The demand driven supply network works with the assumption that organisations have started to change from the earlier push type of supply chain to an innovation and supply ability, as required by customers. There is a move to transform the previous push model to the demand driven model. The main reason for this shift is that organisations that use the demand driven model are able to obtain financial returns for measures such as returns on investment, earnings per share and profit margins. Using a demand driven approach does not mean that everything is left to the market but it is the advertisers and savvy marketers that attempt to generate interest in products. The idea is to generate demand and then use the demand to drive production and fine tune the supply chain so that production is scaled as per the market demand and inventories and production just keeps pace with the demand. Four core areas form the quadrants on which businesses operate and they are supply, product, demand and information. Each of the quadrants have a dimension in which they operate.
Corporate culture and HRM policies have a major impact on the supply chain. Research shows that a good corporate culture and HRM policies creates satisfied employees whose needs have been met and these employees in turn foster cooperative relations between the supply chain members. An organisation with dissatisfied employees would have a negative effect on the supply chain members and the performance of the network would go down.
Clusters tend to promote cooperation among members of a supply network and when cluster has members who interact and help each other, then the supply chain thrives and efficient. Effective and cooperative clusters are very important for communities, industrial estates and large organisations that source products from vendors in a geographic location.
A number of case studies were examined and some important conclusions have been formed and they are:
The Tesco Meat Supply chain case study revealed the internal problems of the supply chain. Tesco relied on hundreds of small time animal farmers and slaughter houses and it became increasingly evident that the existing meat supply chain was too haphazard and compliance with the codes would be very difficult. The weekly requirements of meat products are estimated at 6000 cattle, 80, 000 pigs, 20, 000 lambs and 1, 200, 000 chickens. There were strict health concerns and measures of quality that had to be taken care of in the light of the mad cow disease. To solve the problem, the Tesco team interviewed managers with face-to-face interviews and through questionnaires and this resulted in an understanding of the complex chain. Suppliers were treated as partners and they had to follow strict guidelines such as ensuring animals were killed with the least painful methods, animal feeds used the least chemicals and anti microbial, responsible use of medicines, slaughter houses complied with the standards for meat processing, storage and hygiene and so on. Tesco then redesigned the supply chain and developed a centralised distribution system and bought directly from suppliers who had to be certified by Tesco’s Quality Assurance program. The redesigned supply chain assured the quality of meat products, ensured safety and hygiene for consumers, created a reliable supply base for Tesco and gave assured business for suppliers.
General Pump Supply Chain case study showed how internal process improvements is essential for a supply chain to succeed. The company used an ERP system with General Pump and Noramco as separate facilities. Forecasting was done at General Pump and interplant orders were processed to pull products from Noramco to General Pump using the MRP Program. The system could not respond to changes in demand and when demand was lesser than forecast, work orders already generated based on the forecast where not adjusted to reflect demand drop. This created an artificial increase in capacity requirement and inventory. the inventory had to be reduced by creating an accurate forecasting method, smoothening the production flow and by eliminating unnecessary steps. The original process flow had more than 50 steps and these were analysed for the value addition and the wasteful steps were eliminated so that the final flow had 17 steps. The redesigned supply chain with the enhanced forecasting method allowed optimum work orders where excess inventory was eliminated. Accurate forecasting ensured that work orders for the required nozzle type and quantity were raised as per the market demand and the redesigned process flow ensured timely production of nozzles.
The Vegetable SCM in Asia case study reveals how TOPS managed to solve the problem of the supply chain in rural Thailand. examined Huacheng supermarkets in Nanjing City of China, TOPS supermarkets in Bangkok Thailand. The results showed that small suppliers delivered in small lots, in non-refrigerated trucks, non-standardized crates and high variations in price and quality and it took up to 50 people to grade the produce. The small suppliers were also unreliable and stock outs were a frequent problem. The company introduced standardised containers for transport and set up a grading system that would remove the problems and the final, ready to use vegetables were delivered to the retail stores.
The Toy Retail Industry analysed the Toys retail supply chain and the market for toys depends on the whims and fancies of young children. Retailers are not ready to have excess inventory for fear that the toys would lose popularity and they would be stuck with dead inventory. Studies and interviews by the researchers have suggested that these retailers wish to reduce the risk of inventory and markdown by implementing the demand-driven (JIT) model and therefore initiating supply chain initiatives such as accurate response, cross docking, and CPFR
Zara Fashion retail stores shows how the company manages its supply chain without using expensive software applications. It maintains a tight control over what is to be sent where and when and as a result, the company manages to keep the stores supplied with just the right volume so the clothes always seem fresh.
The music industry supply chain case study shows the problems that the new age music with the digitised and downloadable songs creates a viable alternate from the recording studios of the big labels. The traditional supply chain uses the virtual coordinator who interfaces between the artist, the record company, the retailer and the consumer. As a result, the consumer obtains the required music at far lower costs and the artist gets the required money.
Wal-Mart supply chain shows how emergent technologies such as RFID tags combined with advanced software applications allows the company to track and trace multiple shipments so that at no point of time is there too much inventory in the pipeline.
On the other hand, the Nike Supply chain, the WebVan case studies highlight how an over dependence on IT systems without having human intervention or a viable business model can spell doom for an enterprise.
Final Recommendations for Supply Chains
- Customers should be segmented based on the service requirements of discrete groups and the supply chain should be used to service these groups.
- The logistics network should be customised as per the profitability and service requirements of the customer segments.
- Attention should be paid to the market signals and demand planning has to be aligned through the supply chain to ensure that there is consistency.
- Product differentiation should be in line with customer requirements
- Sources of supply should be managed strategically to reduce the inventory cost of owning materials
- The technology used should be applicable across the supply chain and should support different levels of decision making
- Measures to understand and measure performance across channels should be implemented to understand how it affects the customers
- While technology is very useful, it cannot replace humans and there should not be an over reliance on technology.
References
- Andrew Cox, 2004, Power value and supply chain management, Supply Chain Management: An International Journal, 9(4), pp: 167-175.
- Apte Uday, Viswanathan S. 2000. Effective Cross Docking for Improving Distribution Efficiencies. International Journal of Logistics: Research and Applications. Volume 3. No. 3. pp: 291-303.
- Bacheldor Beth. 2004. From Scratch: Amazon Keeps Supply Chain Close To Home.
- Ballou RH, 1999. Business Logistics Management, 4th edition. New Jersey: Prentice Hall
- Basnet Chuda, Corner Jim, Wisner Joel, Tan Keah-Choon, 2004, Benchmarking supply chain management practice in New Zealand, Supply Chain Management: An International Journal, vol 9. no. 3, pp: 57-64
- Beamon Benita M. 1999. Measuring supply chain performance. International Journal of Operations & Production Management. Volume 19. No. 3. pp. 275-292
- Cohen M.A, Moon, S. 1990. Impact of production scale economies, manufacturing complexity, and transportation costs on supply chain facility networks. Journal of Manufacturing and Operations Management. Vol. 3, pp. 269-92
- Cooper, Martha C, Lisa M. EUram, John T. Gardner, and Albert M. Hanks, 1997. Meshing Multiple Alliances. Journal of Business Logistics, Vol. 18, No. 1, pp. 67-89.
- Cox JF, Blackstone JH, Spencer MS, 1995, (Eds) (1995), APICS Dictionary (8th ed.), American Production and Inventory Control Society, Falls Church, VA
- Cox Andrew, 1999, A research agenda for supply chain and business management thinking, An International Journal, Supply Chain Management: An International Journal, 4(4), pp: 209-211
- Cox Andrew, Hines Peter, 1997, Advanced Supply Management: The Best Practice Debate, Somerset: England, Earlsgate Press, ISBN 1973439512
- Desrochers Pierre. Sautet Frédéric. 2004. Cluster-Based Economic Strategy, Facilitation Policy and the Market Process. Journal of the Review of Austrian Economics. Volume 17. Issue 2-3. pp: 233-245
- Dewhurst Frank, Spring Martin, Arkle Nigel, 2000, Environmental change and supply chain management: a multi-case study exploration of the impact of Y2000, 5(5), pp: 245-260
- Dunning John. March 1980. Towards an Eclectic Theory of International Production: Some Empirical Tests. Journal of International Business Studies. Volume 11. Number 1. pp: 9-31
- Fang Samsong. Kleiner Brian H. 2003. Excellence at Toyota Motor Manufacturing in the United States. Journal of Management Research News. Volume 26. Issue 2-4. pp: 116-123
- Garelli, S. 1997. The four fundamental forces of competitiveness, The world competitiveness yearbook 1997, 17th edition, Switzerland: IMD
- Gattorna John, 1998, Strategic Supply Chain Alignment: Best Practice in Supply Chain Management, Hampshire: England, Gower Publishing Limited, ISBN 0566078252
- Graham Gary, Burnes Bernard, Lewis Gerard, Langer Janet, 2004, The transformation of the music industry supply chain A major label perspective, International Journal of Operations & Production Management, vol 24, no. 11, pp: 1087-1103
- Heng Michael, Wang William, 2005, Supply chain management and business cycles, Supply Chain Management: An International Journal, vol 10, no. 5, pp: 157–161
- Hoek Remko, Chatham Robina, Wilding Richard, 2002, Managers in supply chain management, the critical dimension, Supply Chain Management: An International Journal, vol 7, no. 3, pp: 119-125
- Holmström, 2002, Product range management: a case study of supply chain operations in the European grocery industry, Journal of Supply Chain Management, vol 7, no. 3, pp: 107-115
- Hollis John, 2004, Supply chain re-engineering: the experience of Littlewoods chain stores, Journal of Supply Chain Management, vol 9, no. 1, pp: 5-10
- Hymer S. 1960. The International Operations of National Firms. Ph.D dissertations. Massachusetts Institute of Technology
- Ina Koichi. 2007. Globalization and localizing manufacturing.
- James Mark, Grosvenor Prickett Paul, 2004, e-Distribution: Internet-based management of a merchandiser supply chain, Supply Chain Management: An International Journal, vol 9, no. 1, pp: 7-15
- Kennett Julie, Molder Pauline, Brooks Harvey, 1998, Supply Chain Management: the case of a UK baker preserving the identity of Canadian milling wheat, Journal of Supply Chain Management, vol 3(3), pp: 157-166
- Koch Christopher, 2004, How and why Nike Recovered from its supply chain Disaster, Web.
- Kuah Adrian T.H. 2002. Cluster Theory and Practice: Advantages for the Small Business Locating in a Vibrant Cluster. Journal of Research in Marketing and Entrepreneurship. Volume Four. Issue 3. pp: 206-228
- Kumar Sameer, Chandra Charu, Stoerzinger Mike, 2001, Serve your supply chain, not operations – a case study, Journal of Industrial Management & Data Systems, vol 101, no. 8, pp: 414-425
- Lee Hau, Padmanabhan V, Whang Seungjin, 1997, The Bullwhip Effect in Supply Chains, Sloan Management Review, vol 38, no. 3, pp: 93-102.
- Lindgreen Adam, Hingley Martin, 2003, The impact of food safety and animal welfare policies on supply chain management, British Food Journal, vol 105, no. 6, pp: 328-349
- Lummus Rhonda, Vokurka Robert, 1999, Defining supply chain management: a historical perspective and practical guidelines. Journal of Industrial Management & Data Systems, vol 99, no. 1, pp: 11-17
- McAfee Bruce, Glassman Myron. 2002. The effects of culture and human resource management policies on supply chain management strategy. Journal of business logistics. Vol. 23, No. 1. pp: 1-19
- McCrea Bridget. 2008. Supply Chain Software and Technology: The Status and the Future. Supply Chain Management Review.
- McMichael Hamish, 2000, Quick response in the Australian TCF industry A case study of supplier response, International Journal of Physical Distribution & Logistics, vol 30, no. 78, pp: 611-626
- Msimangira Kabossa, 2003, Purchasing and supply chain management in Botswana, Supply Chain Management: An International Journal, vol 8. no. 1, pp: 7-11
- Narayanan VG, Raman A, 2000, Aligning Incentives for Supply Chain Efficiency, Harvard Business School Review, Boston MA, 9600110
- New Stephen, 1997, The scope of supply chain management research, Journal of Supply Chain Management, vol 2, no. 1, pp: 15-22
- O’Marah Kevin. 2008. The Top 25 Supply Chains. Supply Chain Management Review. pp: 16-24.
- Padmanabhan V, Whang Seungjin. 2004. Information Distortion in a Supply Chain: The Bullwhip Effect. Journal of Management Science. Volume 50. Issue 12. pp: 1975-1886.
- PMI, 2008. Trade Analysis Container: Containing the bulge. [Online] Port Management International. Journal of Port Management International, 2, pp: 38-40.
- Porter, M.E.1998. Clusters and the new economics of competition. Harvard Business Review. Volume 33. Issue 1. pp: 77-90
- Quayle Michael, 2005, A study of supply chain management practice in UK industrial SMEs, Supply Chain Management: An International Journal, vol 10, no. 1, pp: 79-86
- Radjou Navi. 2008. Trends 2008: SCM Market Outlook. Forrester Research, Inc., Cambridge, MA, USA.
- Regassa Hailu. Ahmadian Ahmad. Sumer 2007. Comparative Study of American and Japanese Auto Industry: General Motors Versus Toyota Motors Corporations. Journal of the The Business Review. Volume 8. Issue 1. pp: 1-12
- Rhee Seung-Hyun, Bae Hyerim, Choi Yongsun (2007), ‘Enhancing the efficiency of supply chain processes through web services’, Journal of Inf Syst Front, Volume 9, pp: 103-118
- Ross Fredrick David, 1998, Competing Through Supply Chain Management: Creating Market Winning Strategies Through Supply Chain Partnerships, New York: USA, Chapman and Hall, ISBN 0413137216
- Ruben Ruerd, Boselie Dave, Lu Hualiang, 2007, Vegetables procurement by Asian supermarkets: a transaction cost approach, Supply Chain Management: An International Journal, vol 12, no. 1, pp: 60-68
- Schwind, G. F. 1995. Considerations for cross docking. Journal of Materials Handling Engineering. Volume 50. Issue 12. pp: 47-49.
- Spekman Robert, Kamauff John, Myhr Niklas, 2001, An empirical investigation into supply chain management: a perspective on partnerships, Journal of Supply Chain Management, Journal of Supply Chain Management, vol 3(2), pp: 53-67
- Supply Chain Digest, 2006, The 11 Greatest Supply Chain Disasters.
- The WebVan Story, 2006, Supply Chain Digest: The 11 Greatest Supply Chain Disasters, Web.
- Tom DeWitt, Larry C. Giunipero, Horace L. Melton. 2006. Clusters and supply chain management: the Amish experience. International Journal of Physical Distribution & Logistics Management. Volume 36. Issue 4. pp: 289-308
- Towill Denis, 2005, The impact of business policy on bullwhip induced risk in supply chain management, International Journal of Physical Distribution & Logistics Management, vol 35, no. 8, pp: 555-575
- Viaene Jacque, Verbeke Wim, 1998, Traceability as a key instrument towards supply chain and quality management in the Belgian poultry meat chain, Journal of Supply Chain Management, vol 3, no. 3, pp: 139-141
- Wang Jianfeng (2006), ‘Economies Of It Systems At Wal-Mart – an Historical Perspective’, Academy of Information and Management Sciences Journal, Volume 9, Issue 1, pp: 45-67
- Wong Chee Yew, Arlbjørn Jan Stentoft, Johansen John, 2005. Supply chain management practices in toy supply chains. Supply Chain Management: An International Journal. vol 10, no. 5, pp: 367–378