Tip Top Markets is a regional supermarkets chain in the Southeastern United States. Recently, one store in the chain received a substantial number of customer complaints were received, with a large proportion of grievances being submitted by shoppers on Tuesdays. In order to improve the operations of the Tip Top Markets outlet, the data collected by the store manager will be analyzed, a cause-and-effect diagram will be constructed, and the appropriate recommendations will be made.
Any recommendations to the Tip Top Markets outlet should be based on factual information. A check sheet can help identify the main issues with the store operations as they provide an accessible format to record and organize the data (Stevenson, 2017). The check sheet for the outlet indicates that the most significant problem experienced by the outlet is items being out of stock. Poor store maintenance and food problems, such as spoiled products, also present a critical issue for the store.
Figure 1. Check sheet
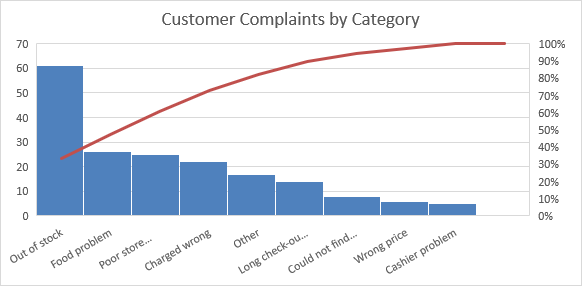
Similarly, a Pareto chart can be used to identify the problem areas of the store’s operations. Specifically, it is utilized to arrange categories from highest to lowest frequency of occurrence (Stevenson, 2017). The chart helps visualize the types of errors most prevalent in the Tip Top Markets outlet. In addition, the Pareto 80/20 rule states that approximately 80% of all effects stem from 20% of all causes (Tanabe, 2018). As the diagram indicates that out-of-stock items present the primary issue for the store, it can be assumed that the causes that contribute to the problem contribute to other substantial problems of the outlet.
In addition, it is crucial to evaluate how customer complaints change over time. A run chart can be employed to estimate the changes in variables during the period under review (Stevenson, 2017). According to the data provided by the store manager, no significant change occurred since the implementation of a new policy to reduce out-of-stock complaints on July 15th. Combined with the data from the check sheet, it can be concluded that the new policy was ineffective and had a damaging effect on the store’s operations and customer satisfaction.
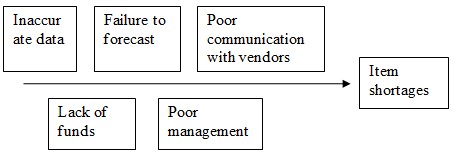
Considering that the item shortages are the primary issue for the outlet, and their occurrence showed no decrease after the July 15th intervention, causes for products being out of stock need to be investigated. According to Nicasio (2021), inaccurate data, failure to forecast and order items timely, poor management, poor communication with vendors, and lack of funds can contribute to shortages. Since the occurrence of most of the complaints, excluding out-of-stock items and store maintenance, decreased after intervention implementation, it can be assumed that these causes were not addressed appropriately. Therefore, store management should immediately attend to those causes to meaningfully impact the Tip Top Market outlet issues.
In summary, the data provided by the Tip Top Market outlet manager indicates that a low quantity of items presents a significant challenge for the store. Therefore, the causes that lead to products being out of stock need to be addressed. Thus, the store is recommended to reevaluate the demand for products to accurately forecast it and order the appropriate amount each week. In addition, a better inventory system can be installed to account for all items. Finally, contracts with vendors can be reassessed, and new ones can be signed to ensure timely delivery of all items. If these causes are addressed, it can be argued that the lack of funds issue will be resolved due to customers spending more money in the store and an influx of new customers.
References
Nicasio, F. (2021). Avoiding Stockouts: 5 preventable causes of out-of-Stocks and what to do about them. Vend Retail Blog.
Stevenson, W. J. (2017). Operations management. McGraw-Hill Education.
Tanabe, K. (2018). Pareto’s 80/20 rule and the gaussian distribution. Physica A: Statistical Mechanics and its Applications, 510, 635–640.