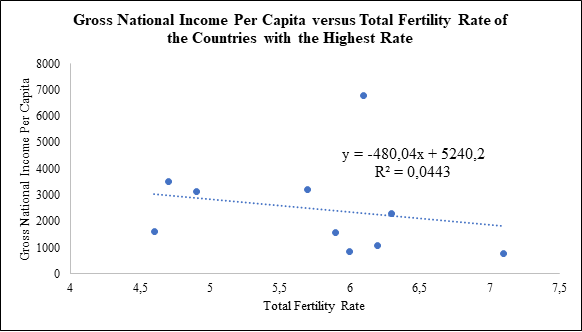
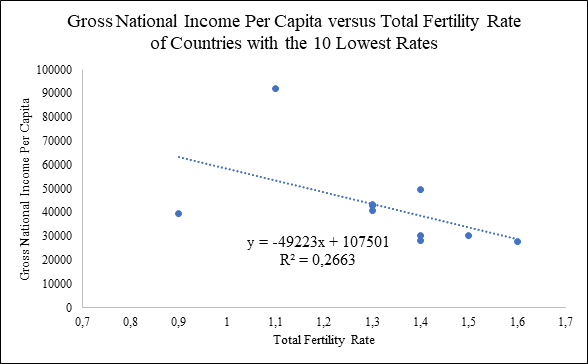
The distribution of total fertility rate and gross national income in both countries with the highest TFR and lowest TFR appear to have a negative relationship. The scatter plot and trend line confirm that the total fertility rate and gross national income per capita have a significant negative relationship in both countries. These findings imply that as the total fertility rate increases, the gross national income declines.
The contrast between the two sets of countries is the strength of the relationship and the degree of explanation of variation. The scatter plot and trend-line show that countries with the highest TFR have a weaker negative relationship than countries with the lowest TFR. In countries with the highest TFR (Figure 1), a unit increase in the total fertility rate makes the gross national income per capita decline by $480. Additionally, the trend line shows that the total fertility rate accounts for 4.43% of the variance of the gross national income per capita. In contrast, in countries with the lowest TFR (Figure 2), a unit increase in the total fertility rate causes the gross national income per capita to decrease by $49,223. Moreover, the trend line shows that the total fertility rate explains 26.63% of the variation in the gross national income per capita.

