Macro-Environment (PESTLE Analysis)
Political Factors
Political factors play substantial roles in ascertaining the factors that influence the long-term profitability of businesses in a particular market or nation. As a beverage and soft drinks company operating in dozens of nations, the Coca-Cola Company is exposed to myriad political environments and system risks. The company experiences direct effects from governmental regulations and laws about food products (‘‘More than a beverage company,’’ n.d.). Taxes imposed by the government on products, such as raising tariffs on aluminum and steel, has caused cost pressure, affecting company revenue generation. Countries like the U.S. have low-rated and broad-based consumption taxes that do not single out beverages. Trade sanctions impact the industry due to the effect on sales and prices of products in the market. Many countries have raised health and wellness concerns on carbonated drinks, which has affected the industry immensely in terms of preferences as they enforce laws that ban the sales of some products. China and the U.S. are among the largest consumers of the Coca-Cola Company products, and the recent political instability caused trade that affected prices of canned products.
Economic Factors
The Coca-Cola Company has nearly 50% of the market share in the market of carbonated beverages. The company has continuously recorded growth in its revenue despite increased prices due to tariffs. Operations of the Coca-Cola Company in different countries is affected differently (‘‘More than a beverage company,’’ n.d.). In developed countries, its products are affordable for consumers than in developing nations. Global economic conditions have an effect on consumer behavior such that when loss of jobs results in financial limitations that reduces the consumption of beverages. New trade agreements that allow free and fair trading between countries enacted by Canada, Mexico, and the U.S. have supported the company’s economic growth. The company has also seen increased demands for low calories drinks such as zero sugar and diet coke than sugary drinks. The increased cost of labor and raw materials has affected the industry.
Social Factors
Culture molds the potential audience, and consumer behaviors vary from place to place depending on political influences, geography, traditions, social history, and socio-economic factors. Culture has an immense influence on consumer behavior as it determines why particular products sell well amongst certain businesses and nations but others fail (‘‘More than a beverage company,’’ n.d.). The Coca-Cola Company has had social campaigns that allow it to stay connected with consumers. Through these campaigns, the company has encouraged people to use its products. There has been growing importance of health consciousness that impact the company’s products portfolio making it offer drinks that meet the new needs of the consumer like Diet coke. Across the globe, the market for non-alcoholic beverages has increased, with most people switching from beer to other beverages. A growing population has strongly impacted the market for the Coca-Cola Company, making it adapt and set strategic plans that improve its production.
Technological Factors
Since its inception, the Coca-Cola Company has been on the lead to experiment with its product line. The company has a culture of innovation that drives its daily business operation as it focuses on having an effective and efficient production of its products. The Coca-Cola Company has embraced technology like social media networking to stay current, fresh, and young in the market and to link with audiences and showcase its brands (‘‘More than a beverage company,’’ n.d.). The use of machinery has assisted the company in manufacturing large quantities and development of quality products, which are delivered fast to the market. The use of digital technology has developed new consumer experiences through innovative programs like a computer that has been integrated into the Coca-Cola Company performance to allow consumers to develop their beverage combinations. The Coca-Cola Company has made significant investments in development and research integrating artificial intelligence to gain substantial insights into consumer behavior from collected data. Advanced data analytic has assisted in developing new flavors that meet the demand of consumers.
Environmental Factors
The Coca-Cola Company has experienced many environmental elements that affect its business operations such as the backlash experienced in India when draining off groundwater. As the leading producer of plastic bottles, the company relies on fossil fuels that cause carbon (iv) oxide emissions. To curb this menace, the Coca-Cola Company has taken myriad steps to eliminate its environmental issues by producing recyclable products and declining carbon footprints to almost zero (‘‘More than a beverage company,’’ n.d.). The company has employed strategic plans that save on water utilization, such as smart farming methods like CARE and RAIN. In some countries like Fiji, the company has been depicted to turn to solar as a renewable source of energy to produce its beverages. The sustainability reports of the Coca-Cola Company show that the company is driven towards having a world without waste. In conclusion, Coca Cola PESTLE analysis provides insight into numerous factors that affect business performance. Knowing these factors helps evaluate external business factors for numerous brands and maintain competitive marketing advantage and sustainable development.
Financial Analysis
Revenue Growth (last 2 years)
The revenue for the Coca-Cola Company based on financial analysis of 2020 and 2019 were $33,014B and $37,266B, respectively. The revenue for the year 2020 declined from the previous annual year revenue.
Operational Expenses (last 2 years)
Annual operating expenses for 2020 and 2019 were $24.017B and $27.18B, respectively, showing a decline in operational expenses.
Profit Margin (last 2 years)
From the data analysis, gross profit margin and net profit margin were good profit margins because their values were higher than 20%. For the Coca-Cola Company, the profit margin entails three metrics which are determined from revenue, cost of goods sold, operating expense, and income (‘‘Financial results,’’ n.d.).
Stock Performance (last 2 years)
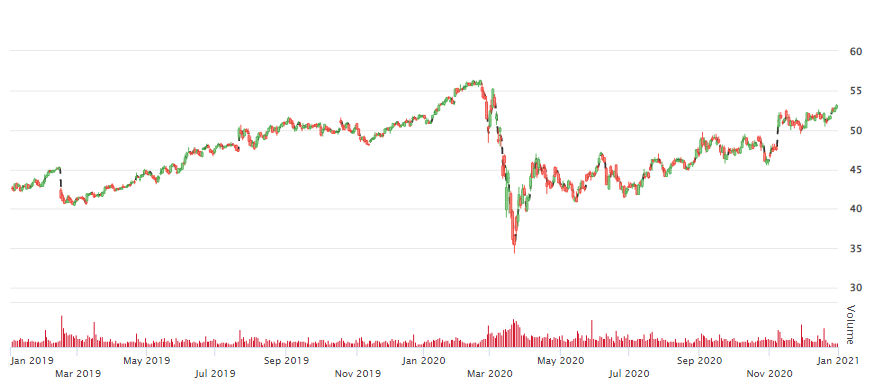
The stock closing price at year-end 2019 was $55.35 with an annual dividend per share of $1.60, and the company maintains an excellent profit margin showing a good generation of cash.
Latest Market Value
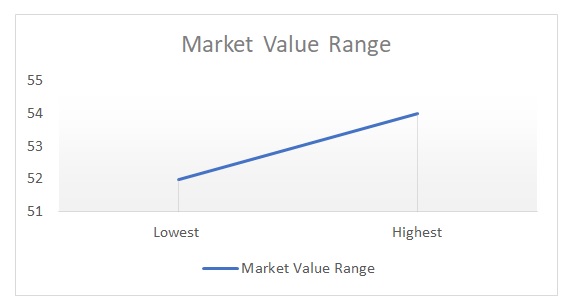
The latest market value for the Coca-Cola Company ranges was between $52 and $54.
Debt: (short & long Term)
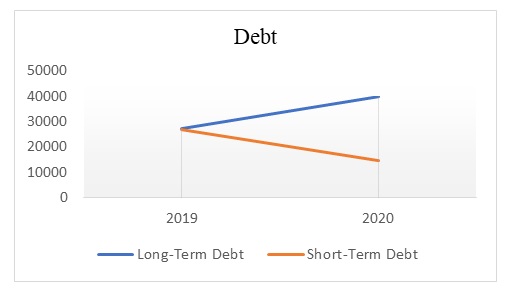
Net long-term debit was $40,125M and $27,516M in 2020 and 2019 respectively while short term debt for respective years was $14,601M and $26,973M.
Cash Position (last 2 years)
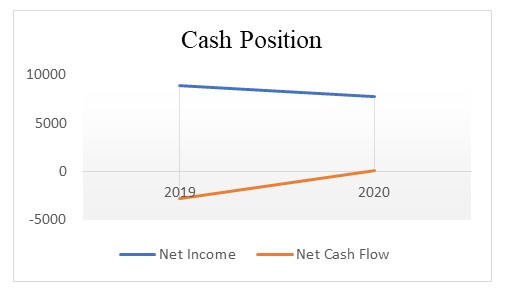
Net income in 2020 and 2019 was $7,747M and $8,920M, respectively, while net cash flow was $58M and $-2838M in 2020 and 2019, respectively.
Liquidity Measurement Ratios (Current; Quick; Cash)
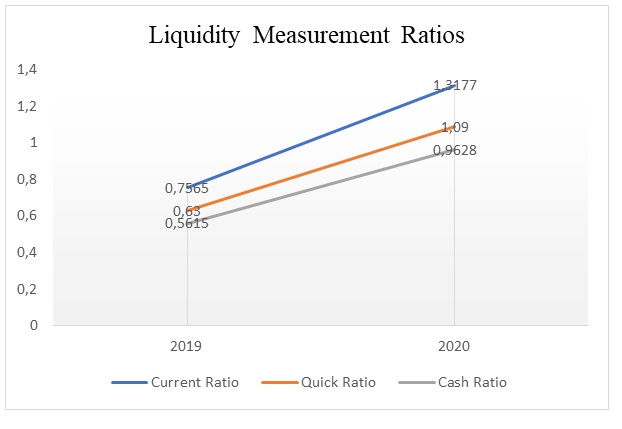
The current ratio and quick ratio for 2020 was above 1, showing the company had enough assets to meet its immediate responsibilities. In 2019, the company had less than one liquidity ratio, showing that the company had difficulties meeting short-term obligations.
References
Financial results. (n.d.). The Coca-Cola Company. Web.
More than a beverage company. (n.d.). The Coca-Cola Company. Web.