Market Positions of Nike and Adidas
Nike Incorporation
Nike is American company operating within the sports apparel market that was founded in the year 1964 in Oregon and operates in the free market. Nike Inc is one of the top sports footwear and accessories designers in the world. At present, the company controls a market share of 20% of the global athletic market and has annual revenues of 25.3 billion dollars. This company stocks sports balls, bags, and eyewear, footwear, and sports shoes for adults and children (NIKE, 2015). Nike’s strategy for operating in the oligopolistic market focused on utmost premium brand quality that customer demand or may not know that they require at that time. For instance, in the year 2014, the company invested more than 100 million dollar on product research and development to improve on its product line in a bid to gain dominance over other giant apparel brands. The strong market position has positioned the company meet customer demand since it has a resounding knowledge of the global consumer trends.
Adidas Corporation
Adidas is a multinational company which was founded in 1949 in Germany and specializes in sports apparel within the free global market. The current operating income of the company is 1.202 billion Euros with total equity of 5.489 billion Euros. Other subsidiaries of the company are Reebok and Runtastic that deal in products such as footwear, toiletries, sports equipment, and sportswear (Adidas Group, 2015). The Adidas Corporation has been strategic in product diversification to minimize cases of failure in this oligopolistic market characterized by few strong brands in the market. The business approach of the Adidas Corporation is organic growth since its expansion has been necessitated by the increasing customer base and demand for different sports apparel product lines. From the inception of the company, the business strategy has always followed a strategic plan in physical growth and market growth within Germany and external markets in order to gain a better stand in the free global market. The company has enjoyed global presence and is currently positioned to increase its current market share following the strategy of establishing other subsidiaries that operate independently of the mother company across all continents.
Market Potential for Nike and Adidas
The demand for sports apparel and accessories is across the globe. Nike and Adidas are global and leading players in this industry. As a result, the two international entities have great influence on the market trends.
Market Potential for Adidas Corporation
As a global incorporation with steady distribution chain for different sports apparel and accessories, Adidas is well positioned to gain maximum benefits of the current and future free market opportunities in the sports apparel industry (Mishra, 2008). Besides, the company has an active presence in all the continents and offers very competitive prices for its high quality products to ensure that it is well positioned to survive the demand related swings in the oligopolistic market (McEachern, 2011). As a strategy for maintaining global dominance above other oligopolistic competitors, Adidas “brand is featured in several games, including Commodore Amiga: Daley Thompson’s Olympic Challenge, Sony PlayStation: Adidas power soccer and Commodore 64, ZX spectrum, and Amstrad CPC: Adidas Championship Football” (Adidas Group, 2015, par. 6). Despite competition from other global brand such as Nike and Puma, the above analysis indicates that Adidas has potential of further growth and expansion in the global apparel industry.
Market Potential for Nike Incorporation
Nike Incorporation faces very strong competition from established sports apparel companies in the global market such as Puma and Adidas since it operates in a market where few strong brands dominate. However, Nike has potential of surviving such competition and maintaining dominance in the global sports apparel and accessories market through its current product diversification and research and development to improve on the level of demand attached to these products by potential clients. For instance, Nike is renowned for diverse products, affordable prices, household name, and global operation as few strategies for sustaining dominance in the free market. Besides, the company offers diverse designs and ability to offer series of products to different groups of potential customers. In relation to the diamond analysis, under the element of arena, the most active product category is that of men and it accounts for 34% of the total revenues. Despite the product presence in Europe, Canada, and Asia, the US market is the most active and commands 96% of the company’s revenues (NIKE, 2015). The apparel category is more active than the footwear and the licensing revenues for the company. Under the element of vehicles, the company has been proactive in licensing and joint venture, especially with the foreign market as part of its internalization strategy to improve on its dominance position among the other few giants. This has been successful as evident in its expansion into Germany, Japan, the UK, Canada, and France.
Nike Incorporation has three pricing categories for the high-end, middle, and low-end customers to tap demand for its products from different categories of customers. In addition, all the product lines (footwear and apparel) are very stylish. The company has a sequence of initiatives such as product diversification. In the years 2004, 2005, 2009, and 2013, the company managed to roll out new products and stores that were very colorful and easy to notice (NIKE, 2015). The economic logic of the above strategies was to provide premium products at competitive prices to ensure that company survives competition from other giants such as Puma and Adidas. Despite competition from other global brand such as Adidas and Puma, the above analysis indicates that Nike has potential of further growth and expansion in the global apparel industry.
Elasticity indicators for the main products offered by Nike and Adidas
Price elasticity of Nike products (Nike jersey)
Nike’s products are price elastic since they are categorized as luxury goods. For instance, the demand for the luxury Nike jersey product is very sensitive to price changes since potential customers can do without the product when it is considered too expensive. This is explained in the diagram below.
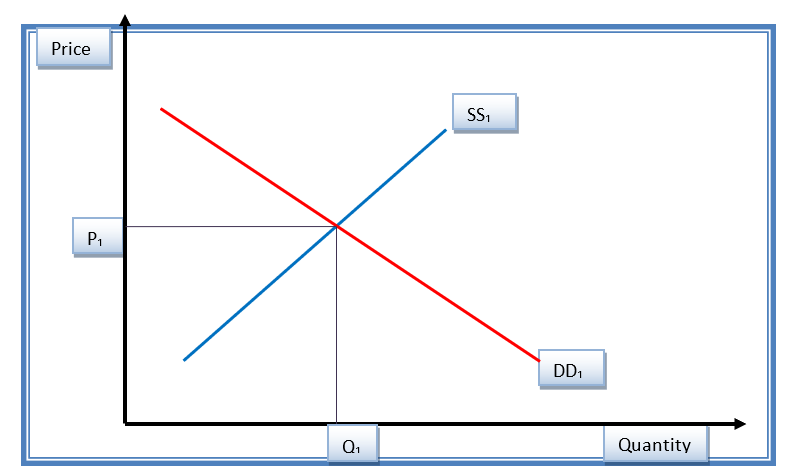
Figure 1.1 shows the initial equilibrium status of the Nike products before the changes in the price. DD1 shows the demand curve while SS1 shows the supply curve (Baumol & Blinder, 2011). Equilibrium price and quantity are P1 and Q1 respectively.
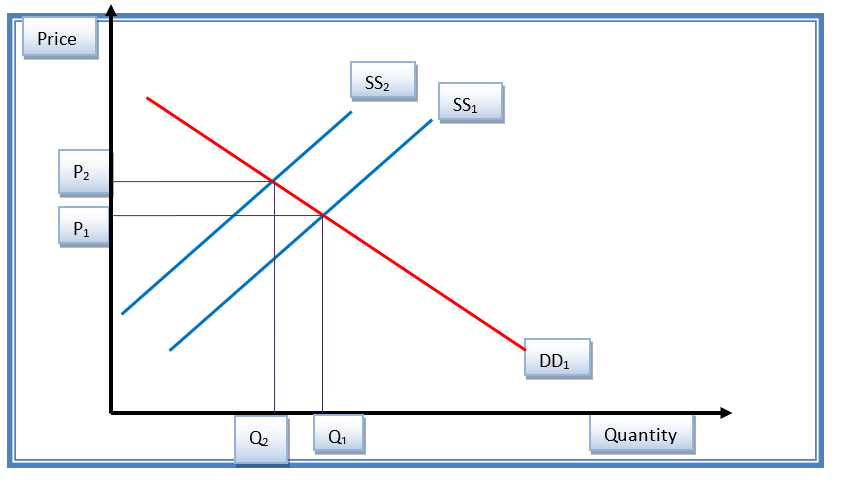
An increase in the price Nike jersey with other perfect substitute products such Adidas jersey causes an inward shift of the supply curve from SS1 to SS2 as indicated in figure 1.2. This gives a new equilibrium position. Price increased from P1 to P2 (Baumol & Blinder, 2011). This indicates reduced demand from the customers. The net effect of increase in price is a contraction of the demand side. The price elasticity for Nike jersey product is pre-calculated at 0.7 (Baumol & Blinder, 2011).
Price elasticity of Adidas products (Adidas jersey)
Adidas’ products are also price elastic since they are categorized as luxury goods. The demand for Adidas jersey product is sensitive to price changes since potential customers can do without the luxury product when it is considered too expensive. Therefore, when the price of Adidas jersey increases, customers will respond by buying less or switching to perfect substitute products deemed as more affordable. This is explained in the diagram below.
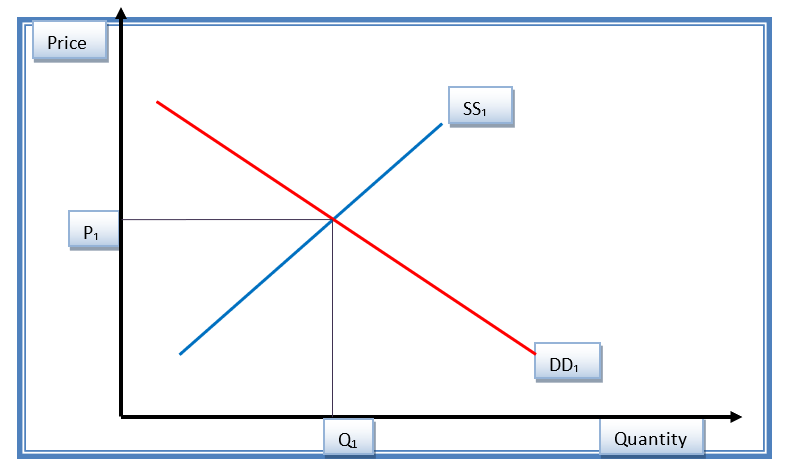
Figure 1.1 shows the initial equilibrium status of the Adidas products before the changes in the price. DD1 shows the demand curve while SS1 shows the supply curve. Equilibrium price and quantity are P1 and Q1 respectively.
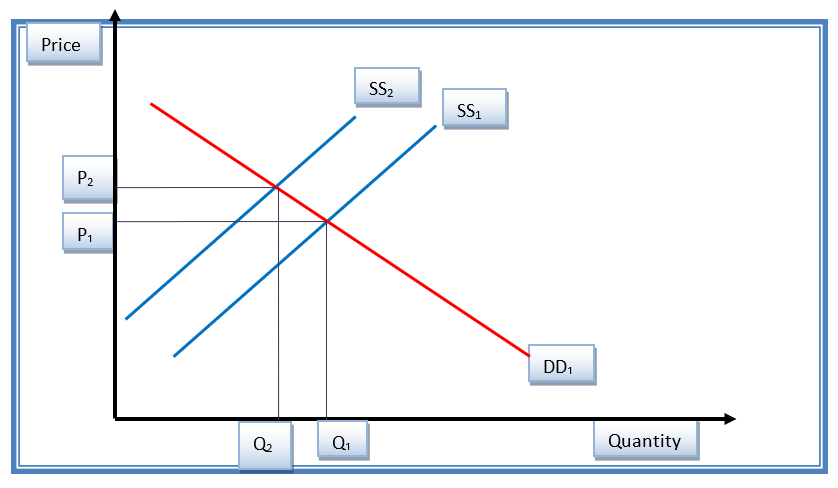
An increase in the price of Adidas jersey with other perfect substitute products such causes an inward shift of the supply curve from SS1 to SS2 as indicated in figure 1.2. This gives a new equilibrium position. Price increased from P1 to P2. The price elasticity for Nike jersey product is pre-calculated at 0.5 (Baumol & Blinder, 2011).
Comparative analysis
According to Baumol and Blinder (2011), “it can be argued that goods that account for a large proportion of disposable income tend to be elastic. This is due to consumers being more aware of small changes in price of expensive goods compared to small changes in the price of inexpensive goods” (Baumol & Blinder, 2011, p. 34). In this case, the Nike and Adidas products are price elastic. These products have elastic supply since their prices determine their ease to be purchased in the market. Besides, when the demand for the same falls, the supply will respond almost instantly in the market. Considering an event in which the prices of Nike and Adidas products increase, the demand for the same products will decrease by the same magnitude triggering the supply to decrease in the long run. On the other hand, reduction in price of Nike and Adidas products will influence the demand to increase as more customers will prefer the products (Witcher & Chau, 2010).
Income elasticity
Income elasticity of Adidas products (Adidas jersey)
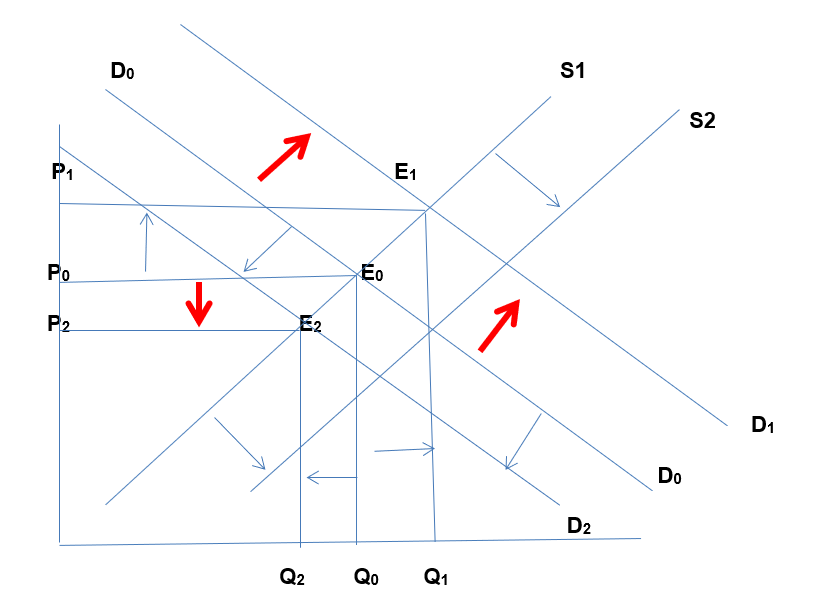
Since Adidas jersey is a luxury product, it is income elastic. That is, an increase income of a household would translate into more demand for the product since the household will have more disposable income to purchase the product. The reverse is also true. For instance, when income of a household increases, the demand for Adidas jersey will increase. This leads to outward shift in the demand curve for product from D0 to D1 and a new equilibrium is achieved at point E1 with price P1 and a higher quantity Q1. Conversely, when income reduces, individuals’ disposable incomes reduce (Baumol & Blinder, 2011). Given that Adidas product is a luxury commodity, the demand will decline, resulting in the drop of quantity of products demanded. The income elasticity of Adidas jersey is pre-determined at 0.4 (Baumol & Blinder, 2011).The corresponding price will fall from the initial P0 to P2. A new equilibrium will be achieved at point E2. This is ilustrated below.
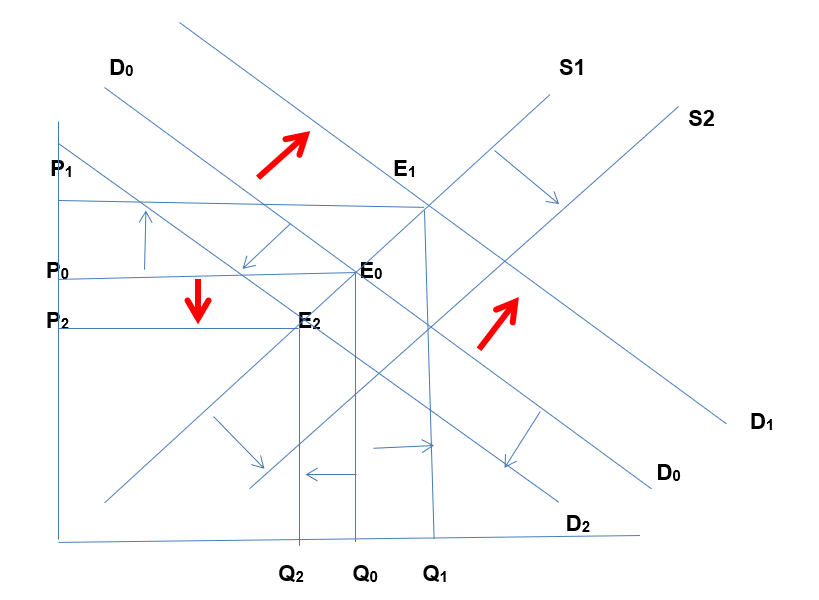
Income elasticity of Nike products (Nike jersey)
Nike jersey is a luxury product, which is income elastic. When income of a household increases, the demand for Nike jersey will increase. This leads to outward shift in the demand curve for product from D0 to D1 and a new equilibrium is achieved at point E1 with price P1 and a higher quantity Q1. Conversely, when income reduces, individuals’ disposable incomes reduce (Baumol & Blinder, 2011). Given that Nike product is a luxury commodity, the demand will decline, resulting in the drop of quantity of products demanded. The corresponding price will fall from the initial P0 to P2. A new equilibrium will be achieved at point E2. The income elasticity of Nike jersey is pre-determined at 0.5 (Baumol & Blinder, 2011). This is ilustrated below.
Cross price elasticity
Basically, Nike, Adidas, and major players in this oligopolistic market have similar income elasticity behavior since the luxury products are the same and within similar price range. For increase, an increase in price of Nike jersey by 5% will result in an increase in demand for Adidas jersey by 10%, meaning that the cross price elasticity for these two substitutes and other products in the same categy is 2 (Garrett & Kolesnikova, 2014). The cross price elasticity of demand between the products of Nike and Adidas and competing products is 2 since market conditions are constant for all the players in the sports apparel industry (Nelson, 2013). However, Nike has higher price elasticity of 0.7 and income elasticity of 0.5 as compared to 0.5 and 0.4 respectively for Adidas. This means that Nike has higher price and income elasticity that Adidas.
Social, political, and environmental factors
In the case of Nike and Adidas, the prices of the sports apparel are closely controlled by the social and political climate of the sports market. Since these factors are similar to all players in the sports industry, customers have no alternative but to operate within the set prices. On the other hand, Nike and Adidas must struggle to set the most competitive prices since industry players operate in different social and political environments. With the availability of many substitutes that vary in prices, customers will find it easy to buy the alternative to either Nike or Adidas products that have the most competitive price tag (Hammitt & Robinson, 2011).
Degree of necessity depends on the nature of a product meant for a household. Reflectively, products that are basic and necessary in daily lives of a household will not affect demand curve very much despite increase in price of such a product. The household has no option but to continue consuming or using the product as it is basic. In the case of Adidas and Nike, their products are considered a luxury and the households can do without them when the prices are considered too high. Therefore, an increase in price of such a product will lower the demand (Witcher & Chau, 2010). A small change in price leads to a greater change in quantity demanded as customers will opt to wait and do the purchasing when prices are lower since the product is but a luxury in the product market as opposed to necessities.
The Nike and Adidas companies are currently threatened mainly by their fast trend of unchecked growth in the recent past. The need to supply the fast growing market as opposed to slower growth in the companies’ production capacity can put pressure on the quality of the products manufactured. It is therefore important for the companies to fast adjust its production with the fast growing sports apparel market. Secondly, products from Nike and Adidas are quite durable and long-lasting, implying that the buyers stay longer with them on a single purchase. This may create a scenario where the companies will in the future experience a low demand period despite having a big market (Guru, 2015). The consumers will still be having their first single purchase products thereby preventing them from making other purchase.
Comparative foreign exchange also affects businesses that conduct global transactions. Differences in the value of money at the points of production and destination markets can immensely impact on the earnings from exports and imports (Vigneron & Johnson, 2009). Such concerns have had effects on the Nike and Adidas companies, especially in their foreign market. Due to exchange rate fluctuations, Nike and Adidas companies recorded loss of up to 2 million dollars and 3.7 million pounds respectively in the year 2014 alone. As the companies plan to extend to other markets, fluctuating foreign exchange rates pose a challenge in their sales. Measures should therefore be undertaken to ensure that this concern does not create a negative impact to their future international operations (Schott, 2004).
Conclusion
Apparently, Nike and Adidas have perfect substitute products and operate in the same industry. Since the products of the two companies are categorized as luxury goods, they are considered price elastic since any change in the prices results in a proportional change in the demand. The two companies have potential for future growth due to their global brand image dominance as a result of product diversification, competitive pricing mechanisms, overzealous marketing, and strategic brand positioning.
Recommendations
As indicated in the analysis, it is apparent that Adidas Corporation has better investment gearing than Nike due to its strategy of product diversification, creation of different subsidiaries, and being very active in the global sports arena as a sponsor of major sports events. I will invest in Adidas since its portfolio indicates that it has a P/E value of 9.4 as compared to P/E of 14.6 for Nike. This is an indication that Adidas’s stability is assured in the near foreseeable future. In addition, Adidas has higher revenue of 17.5 billion dollars as compared to Nike’s 14.5 million dollars, meaning that Adidas has higher value and potential for growth than Nike. In terms of EBITDA (Earnings before Interest, Taxes, Depreciation, and Amortization), Adidas has stronger dominance of 18.5 billon as compared to Nike’s 15.6 billion. The existence of more subsidies and products in Adidas would translate into higher returns on investment than in Nike Incorporation. Besides, Adidas’ proposed expansion through establishing a new subsidiary in the Asian market is likely to translate into increased revenues and better returns on investment.
References
Adidas Group. (2015). Investors. Web.
Baumol, W., & Blinder, A. (2011). Economics: Principles & policy. New York, NY: Joe Sabatino.
Garrett, T., & Kolesnikova, N. (2014). Local price variation and the income elasticity of demand for lottery tickets. Public Finance Review Journal, 18(4), 53-67.
Guru, S. (2015). Main factors which determines the price elasticity of demand for a commodity. The Quarterly Journal of Economics, 9(18), 47–77.
Hammitt, J., & Robinson, L. (2011). The income elasticity of the value per statistical life: Transferring estimates between high and low income populations. Journal of Benefit-Cost Analysis, 2(5), 1-29.
McEachern, W. (2011). Economics: A contemporary introduction. Alabama, Al: Cengage Learning.
Mishra, R. (2008). Industrial economics and management principles. New York, NY: Firewall Media.
Nelson, J. (2013). Meta-analysis of alcohol price and income elasticities – with corrections for publication bias. Health Economics Review, 3(17), 8-29.
NIKE (2015). Targets and performance. Web.
Schott, P. K. (2004). Across-product versus within-product specialization in international trade. The Quarterly Journal of Economics, 119(2), 647–678.
Vigneron, F., & Johnson, W. (2009). Measuring perception of brand luxury. The Journal of Brand Management, 11(6), 484-506.
Witcher, B., & Chau, V. (2010). Strategic management: Principles and practice. Alabama, Al: Cengage Learning.